Tutorial
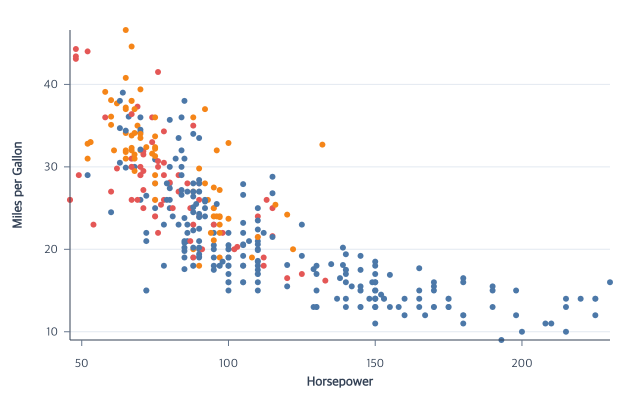
Scatterplot
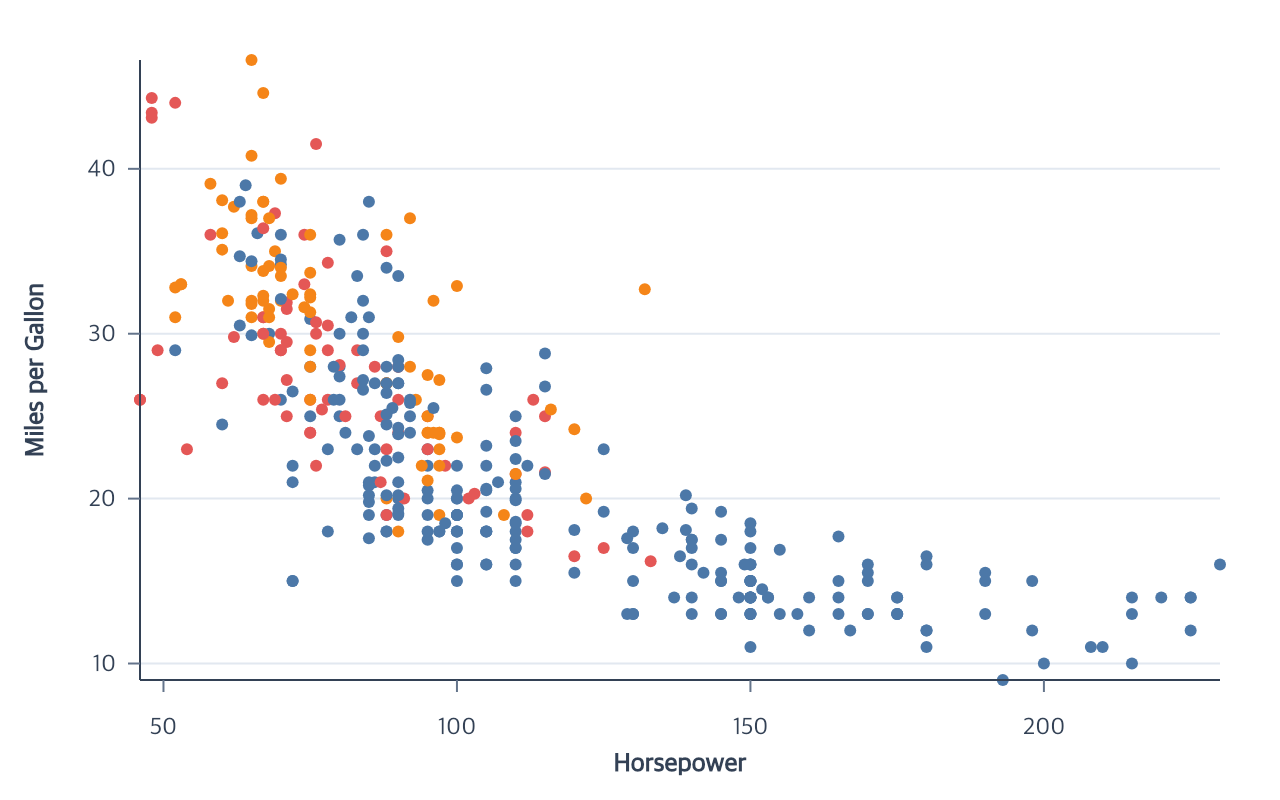
Compare two quantitative fields and encode a category with color.
createScatterPlot
View full size
Published-release documentation · release compatibility
A grammar for how charts are made.
Most visualization grammars describe a finished chart. ggaction represents chart authoring itself as an immutable, traceable sequence of graphical actions.
Build, inspect, select, and revise charts one meaningful action at a time.
Start with a complete example, then use the API pages when you need to customize one part. The main, basic, extension, SVG, PNG, and PDF entry points include TypeScript declarations.
Experimental 0.0.24 · APIs may change before 1.0.0. Review the changelog when upgrading.
Learn how the same chart stays editable across authoring levels, then choose from every complete chart family.
Start with common Cartesian charts for relationships, comparisons, trends, and distributions.
Compare two quantitative fields and encode a category with color.
createScatterPlot
View full size
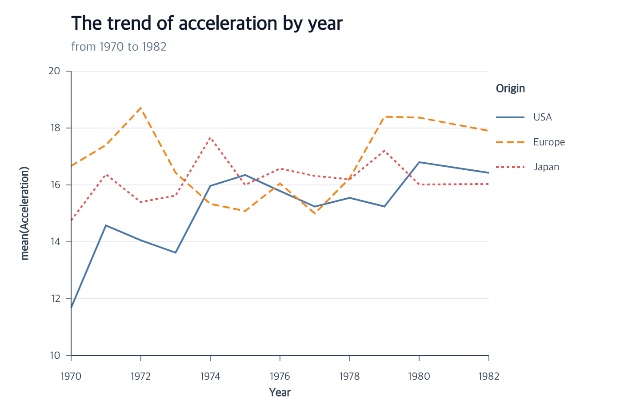
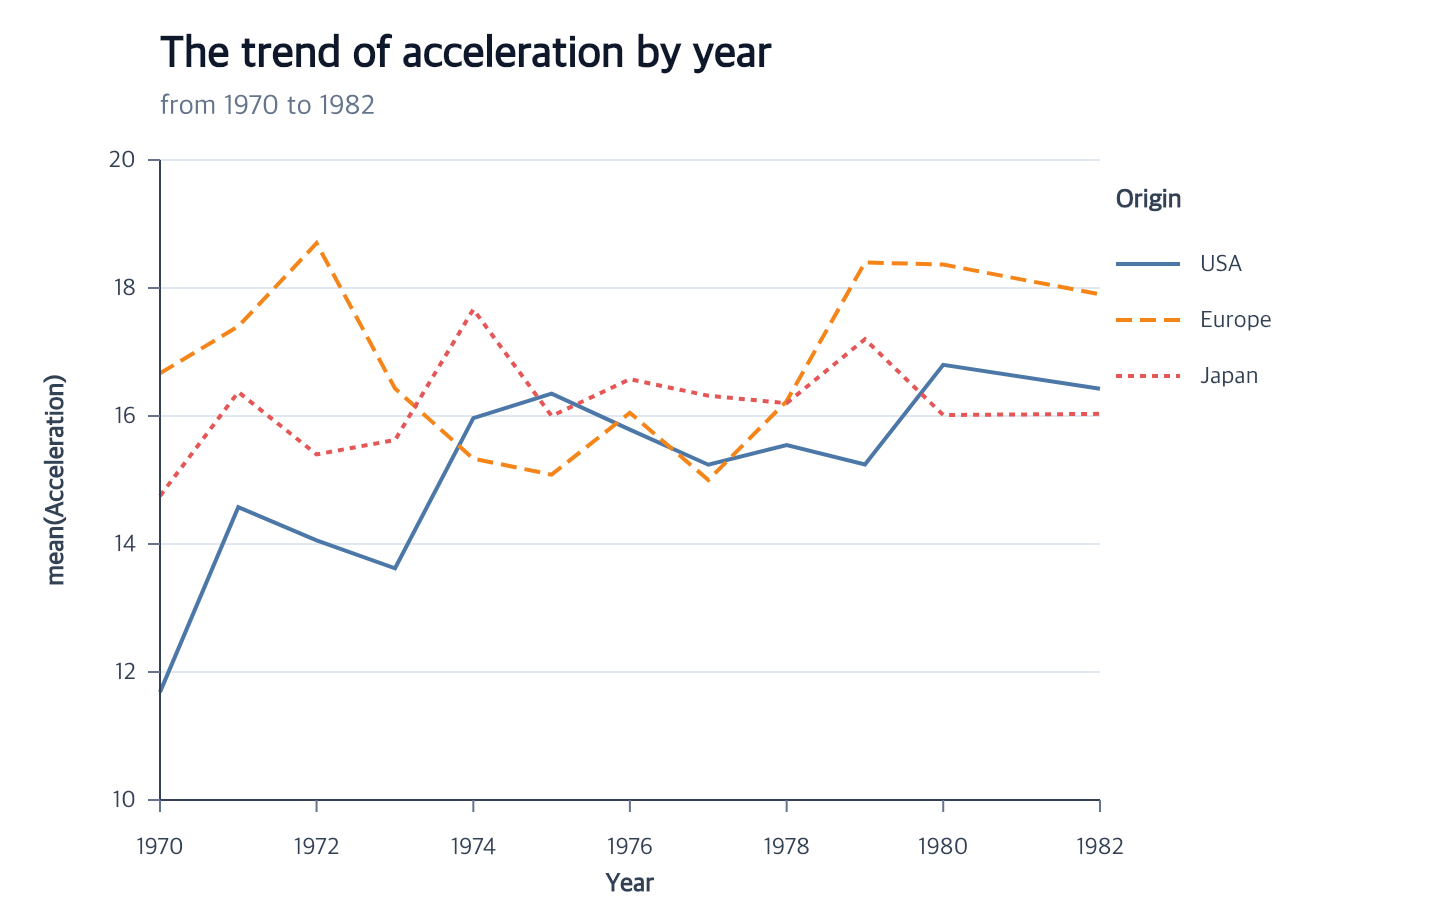
Aggregate values over time and split the result into series.
createLinePlot
View full size
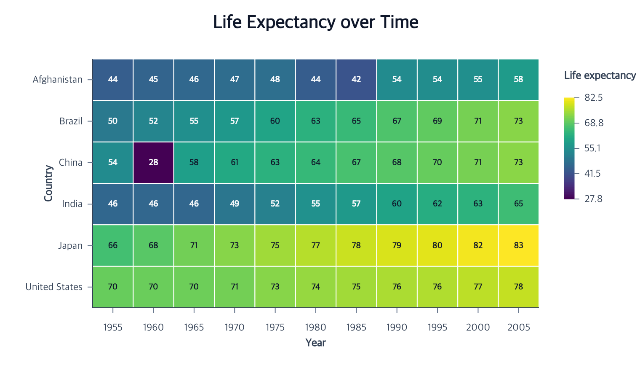
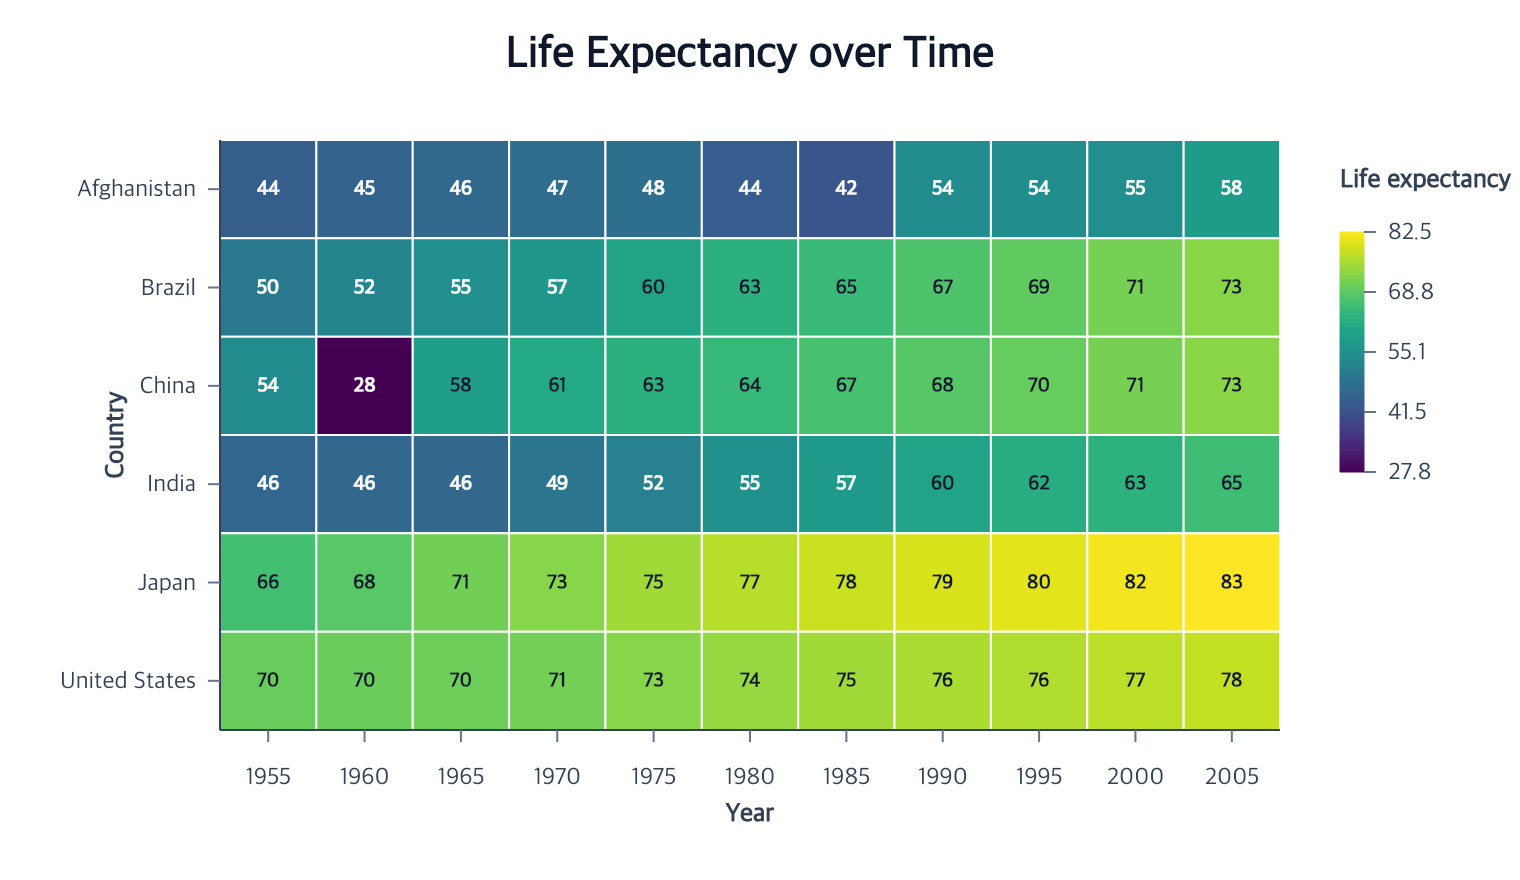
Map two discrete fields to cells and a quantitative field to color.
createHeatmap
createTextMark
encodeText
View full size
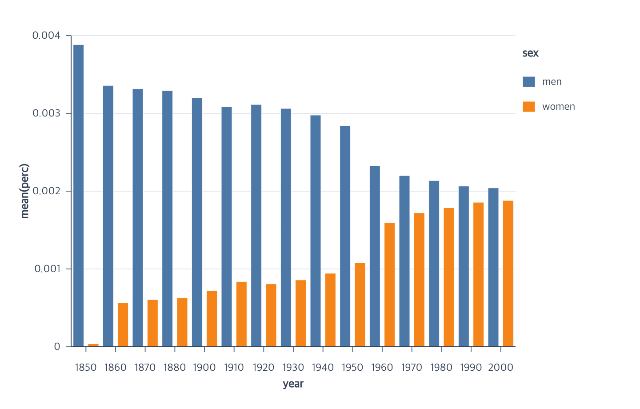
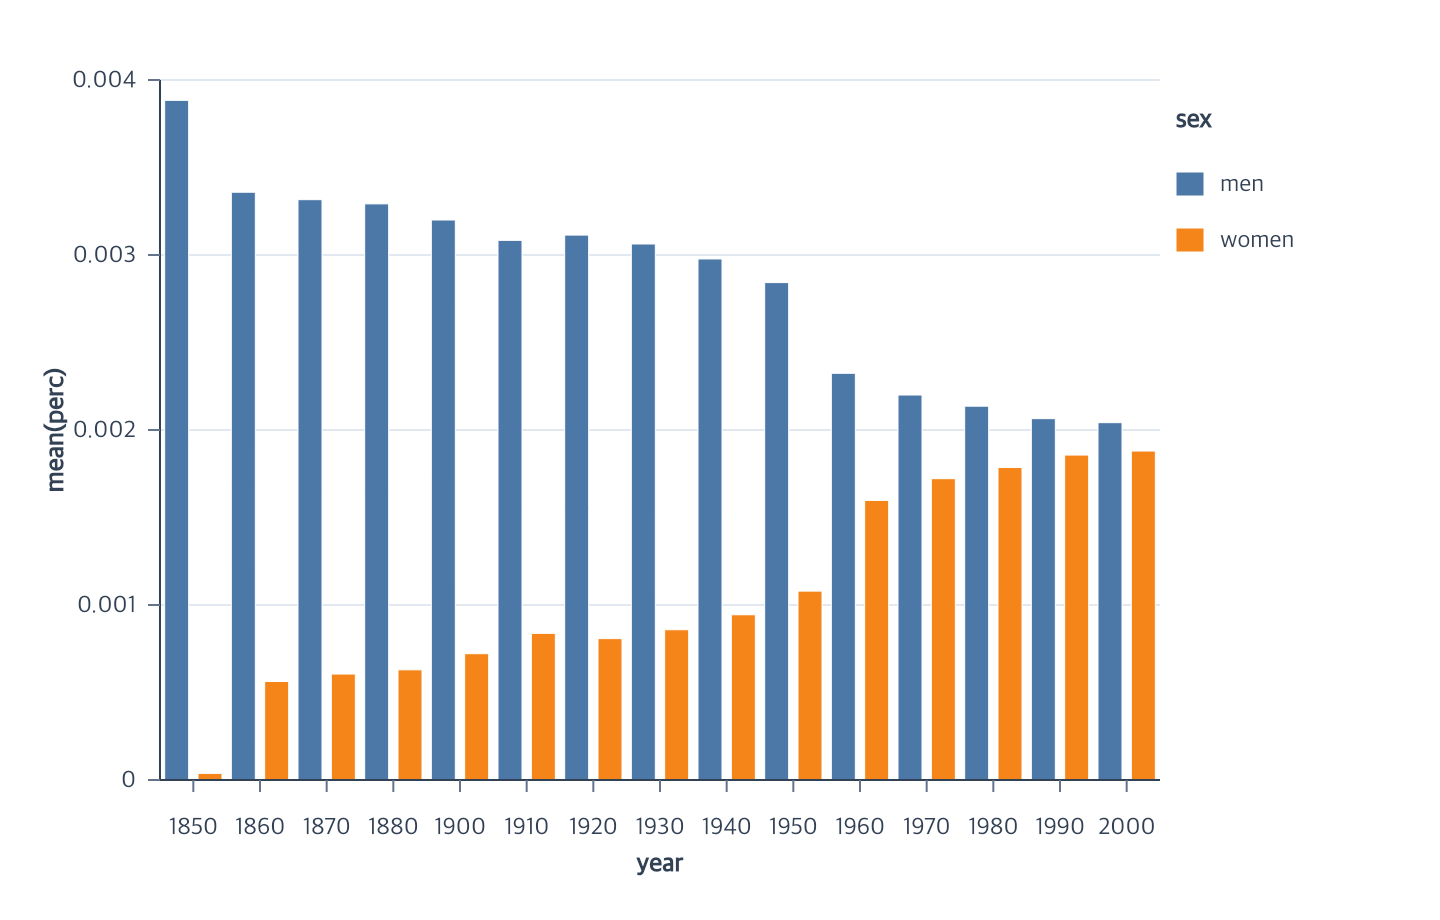
Aggregate ordinal categories and arrange nominal groups side by side.
createBarPlot
View full size
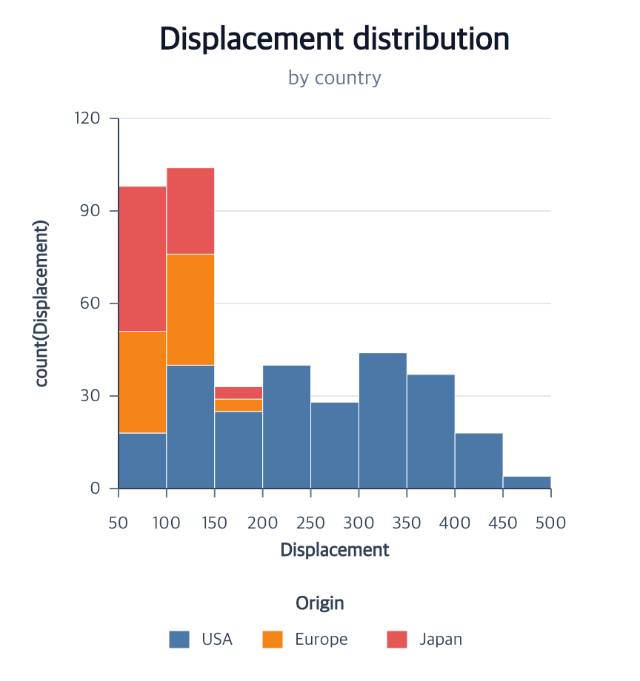
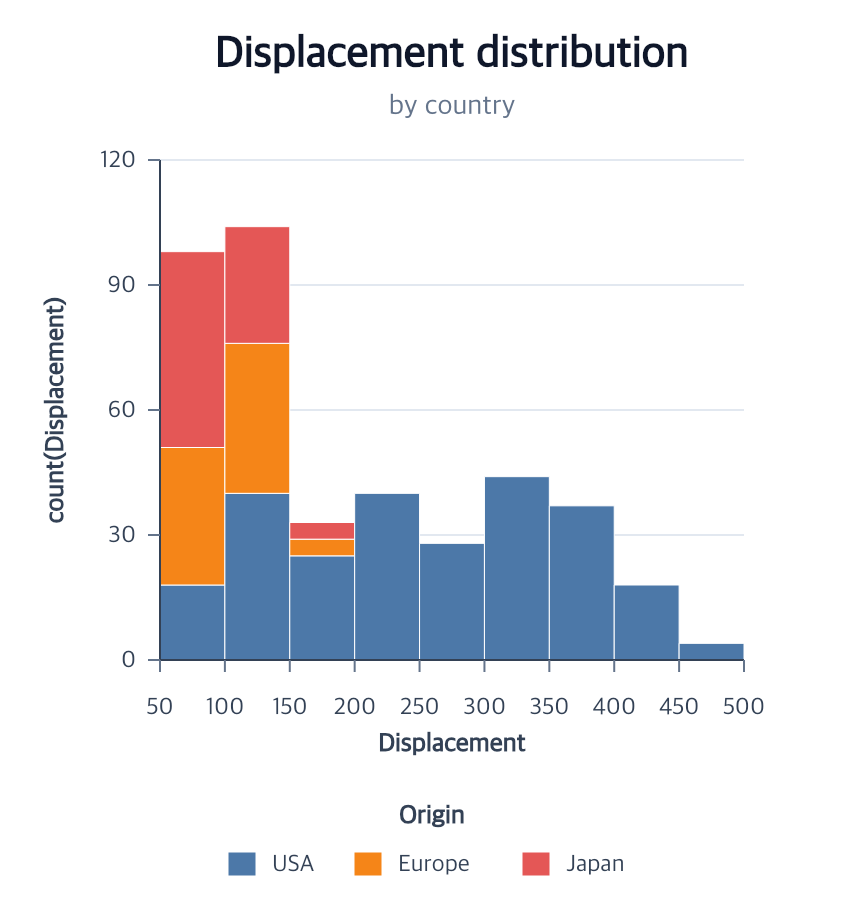
Bin a quantitative field and count category partitions.
createHistogram
View full size
Compose ordinary marks and derived data into higher-level statistical views.
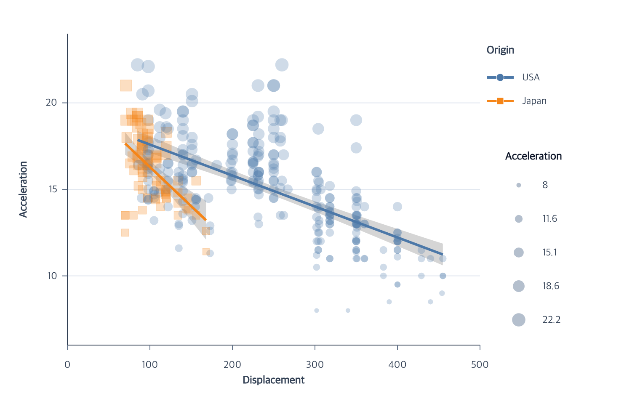
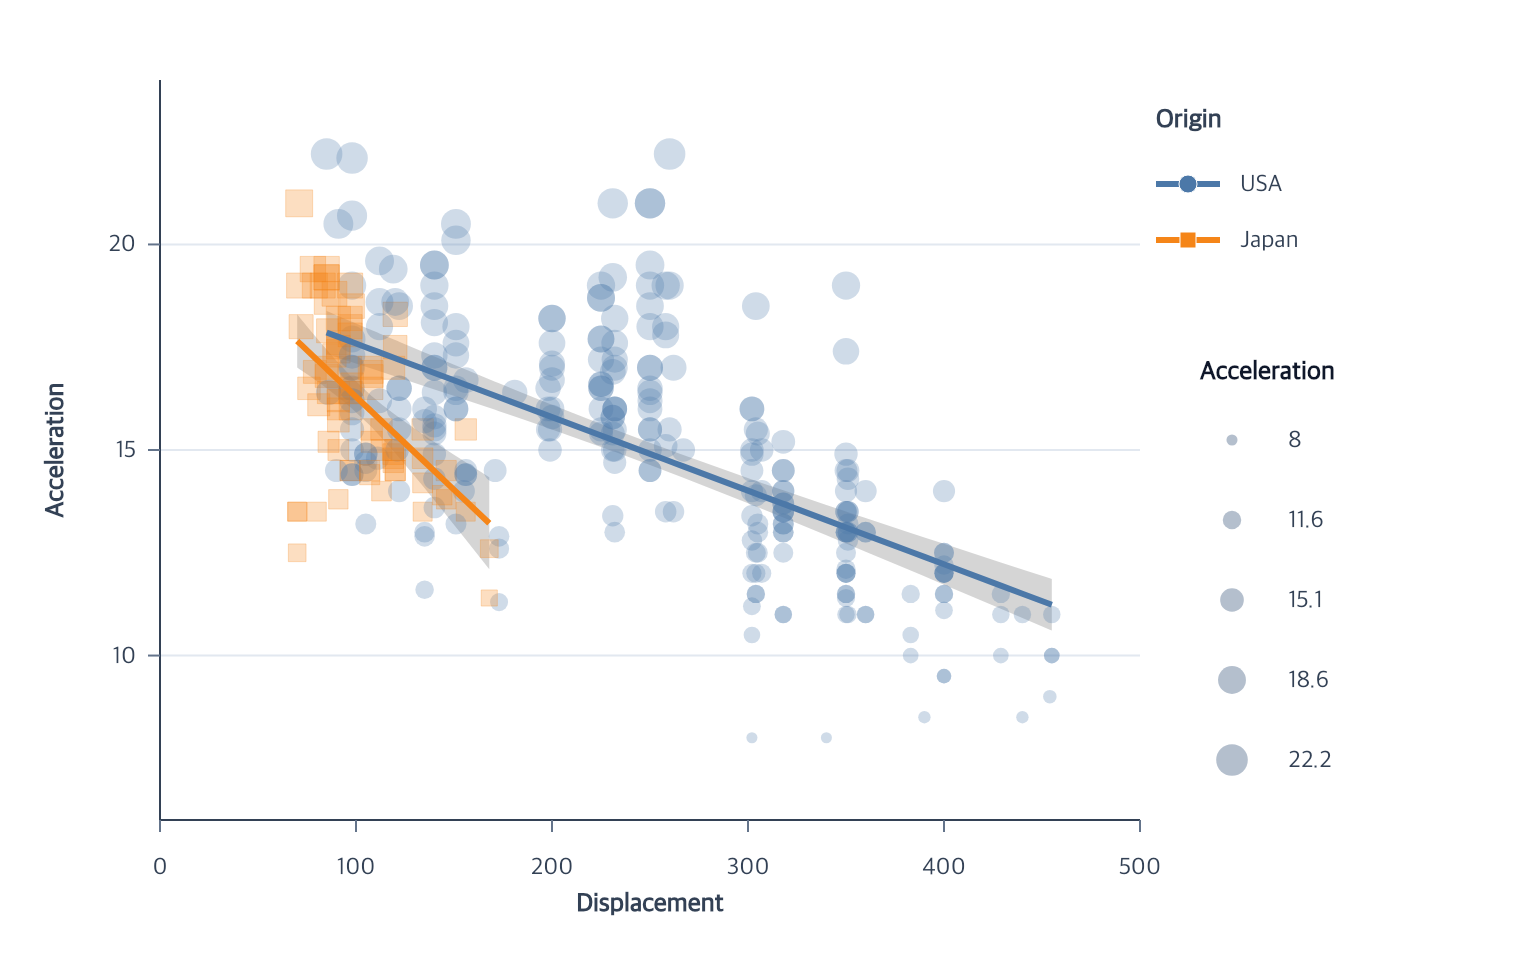
Layer observations, grouped fits, and confidence bands.
createPointMark
createRegression
View full size
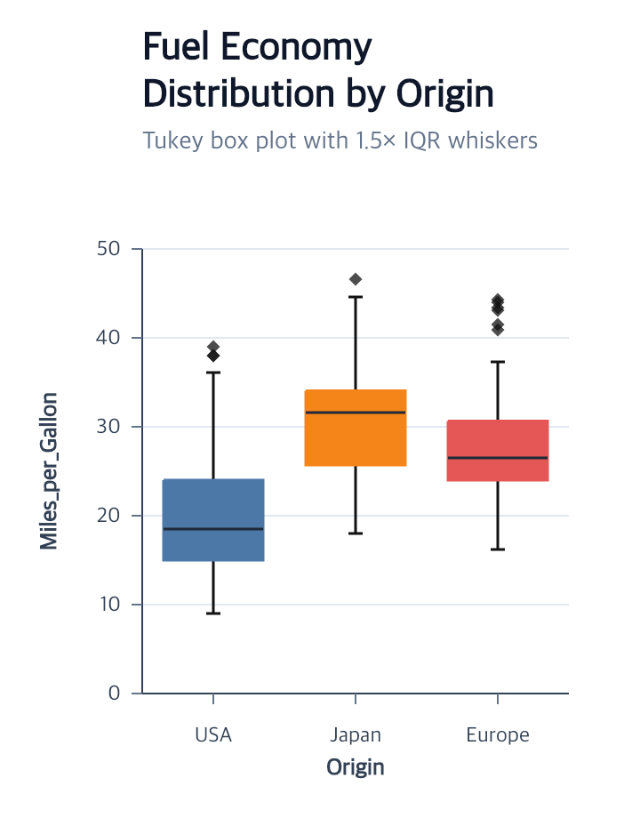
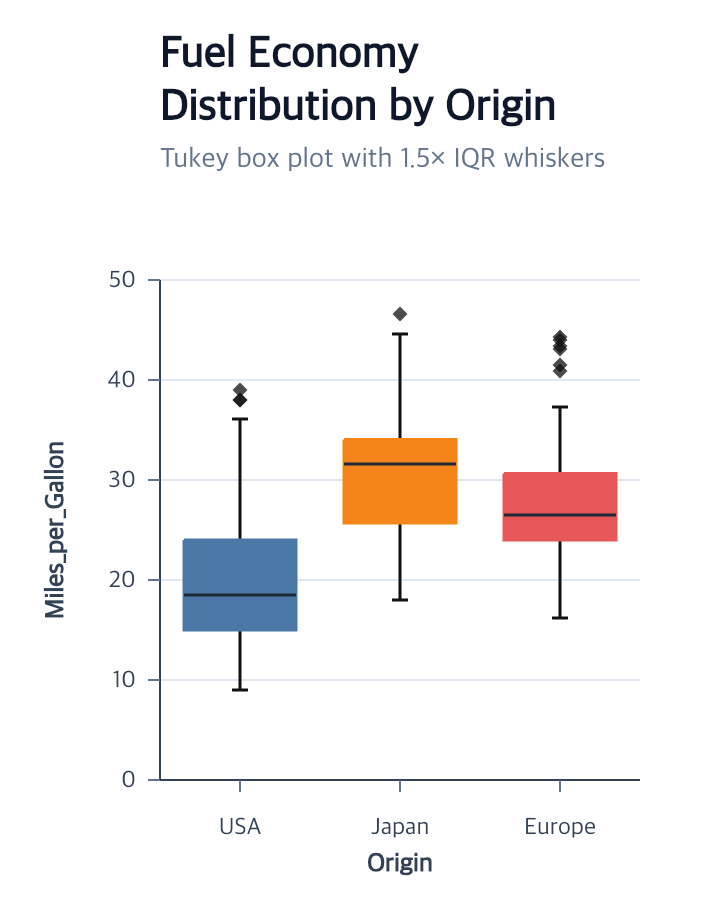
Compose quartiles, whiskers, medians, and outlier points.
createBoxPlot
View full size
Use parallel axes or angle and radial distance when Cartesian x and y are not the clearest structure for the comparison.
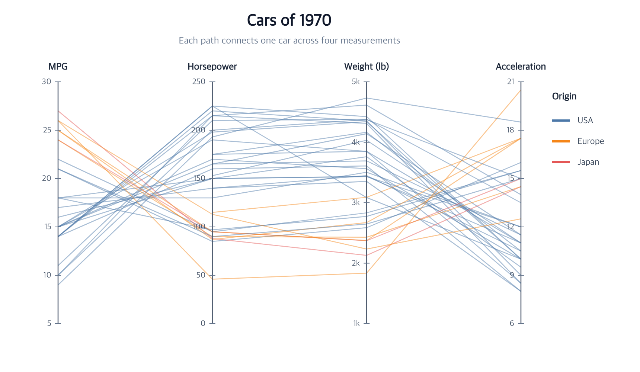
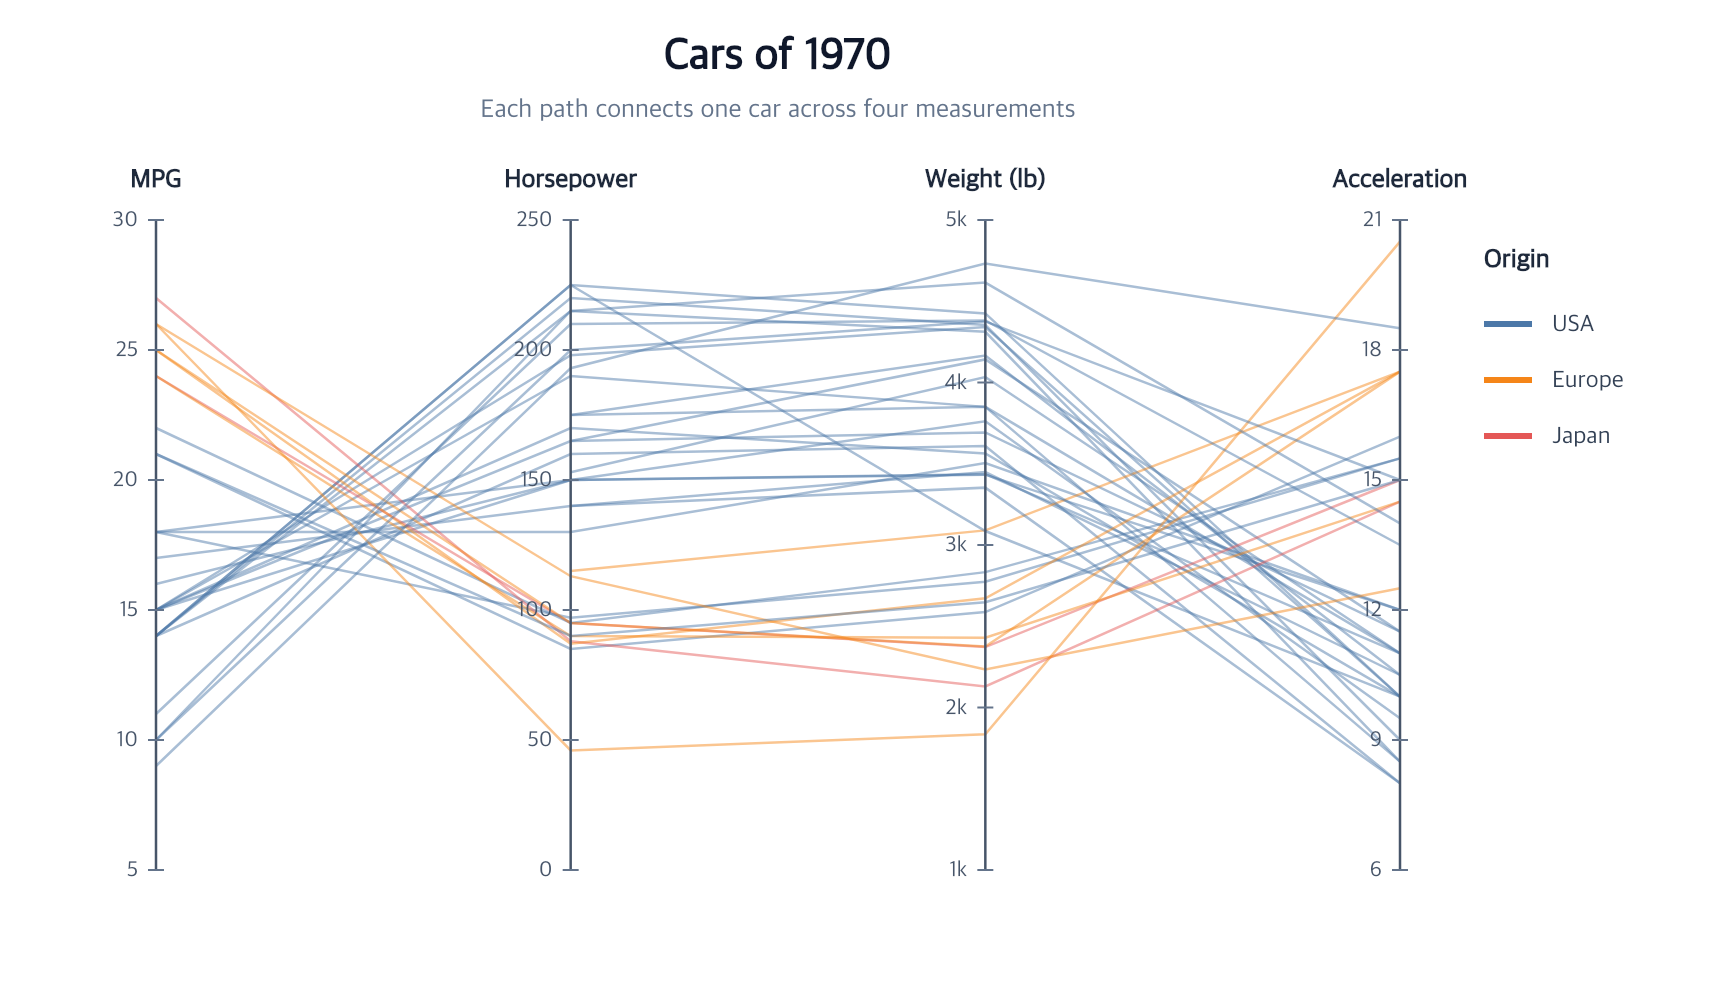
Compare multivariate row profiles while retaining row-level identity.
createParallelCoordinates
encodeParallelCoordinates
View full size
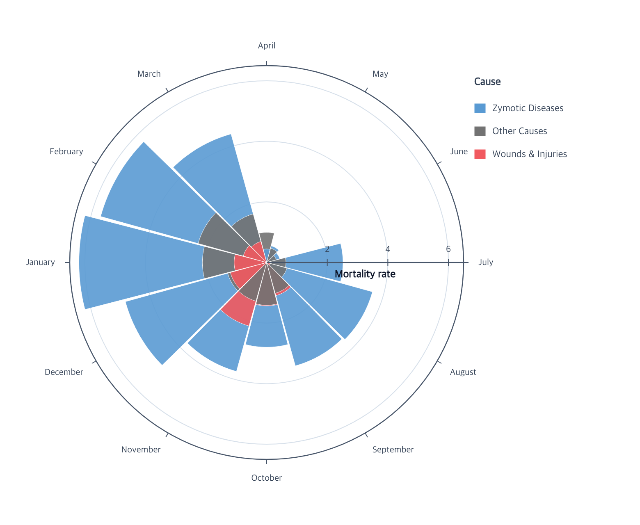
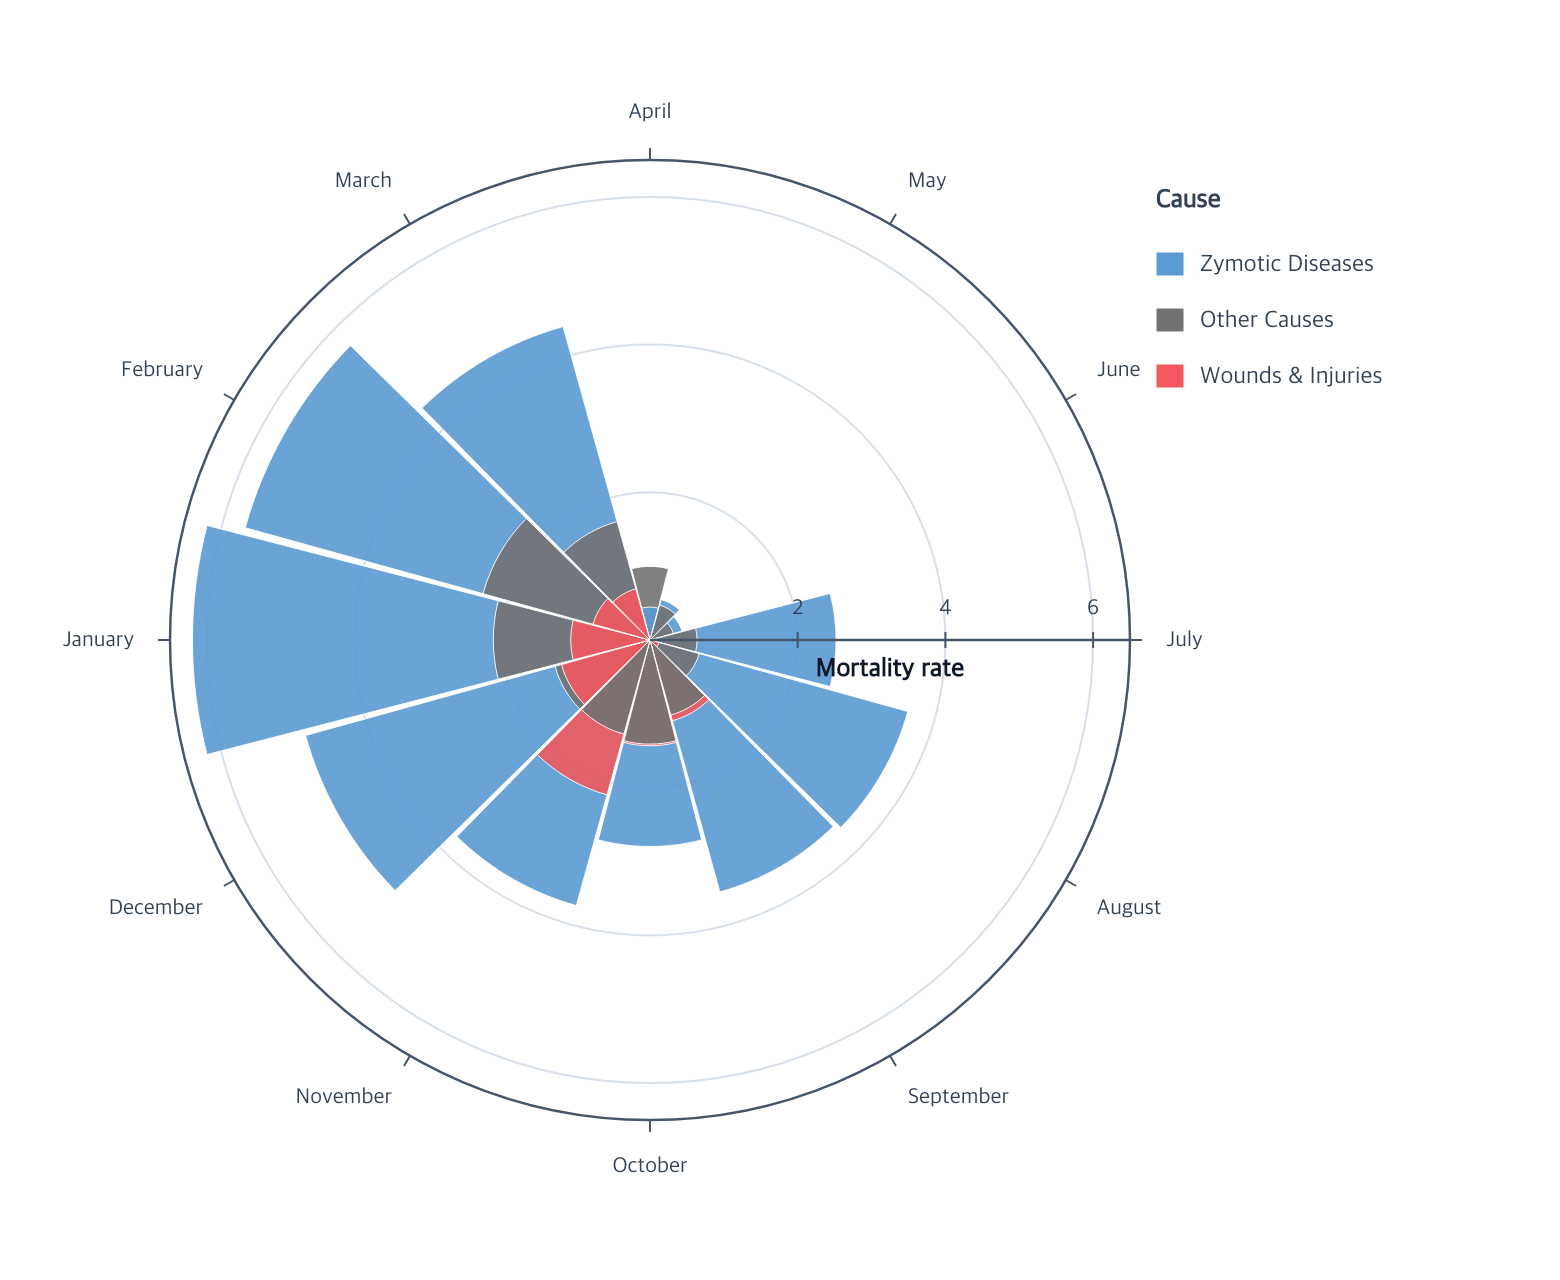
Compare radial magnitudes inside ordered categorical sectors.
createArcMark
encodeTheta
encodeR
View full size
Browse the curated chart gallery →
Understand immutable ChartProgram state, semantic and graphical state, and action trace trees. Extension authors can continue with action authoring and the primitive API. For boundaries and failures, see supported features and troubleshooting. Language models can use the concise documentation index, the local read-only MCP server, or the generated full-text bundle.
Source, issues, and development history are available on GitHub.
293 actions · sha256:e755591a2e5f5e2b494867583876e28020a478c5220b77bdc6ad469a6224891d