Published-release documentation · release compatibility
Error Band Chart Tutorial
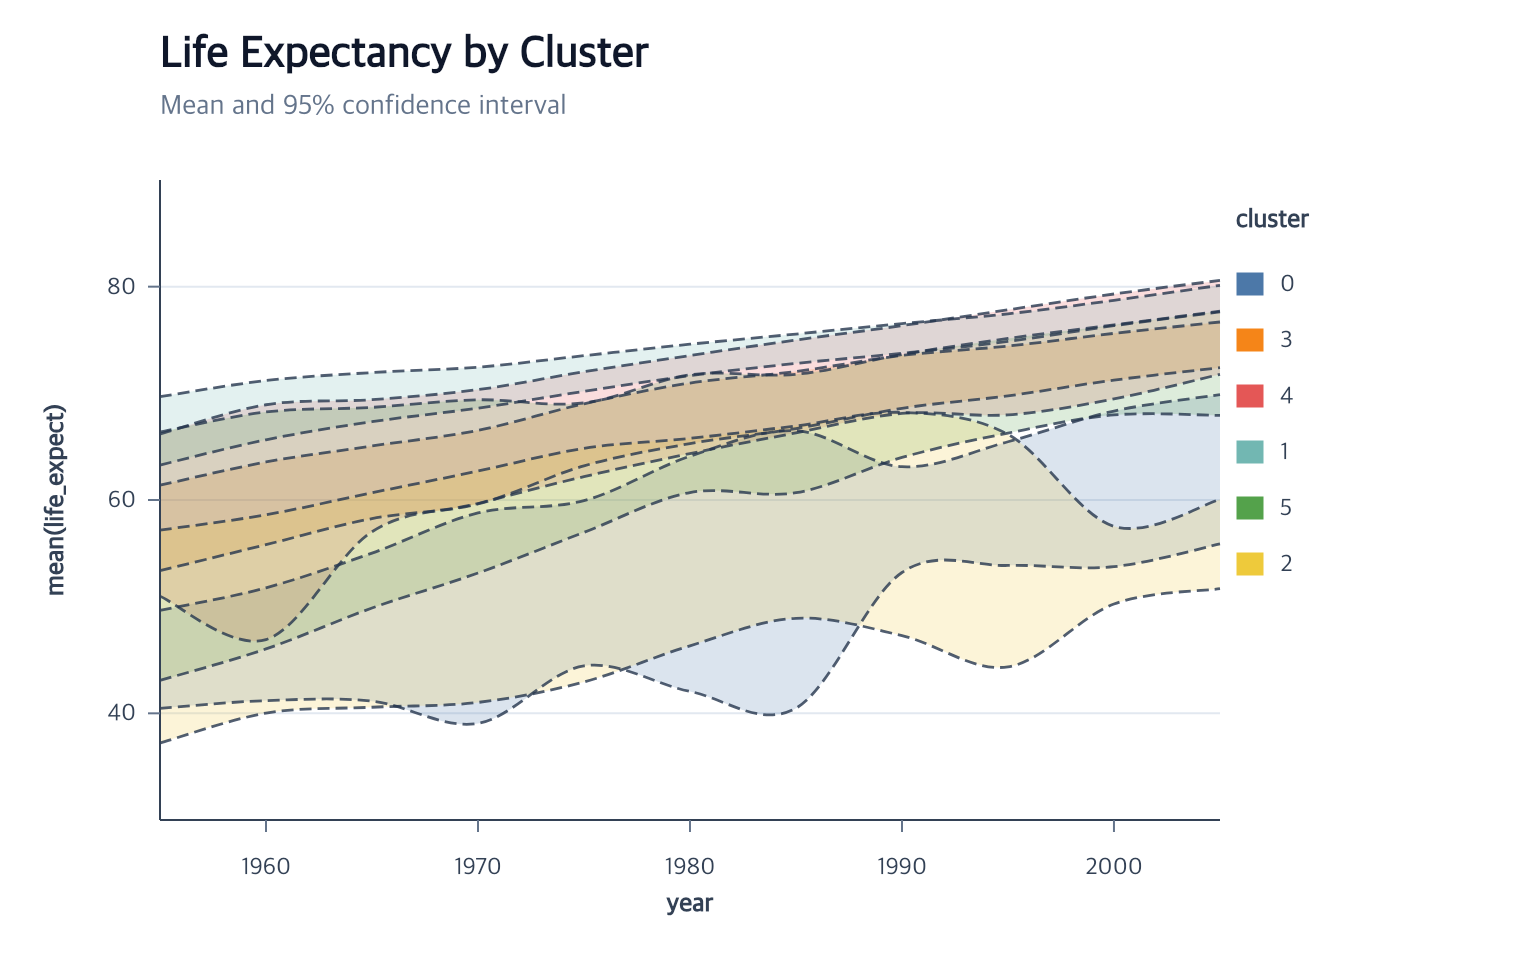
This chart summarizes life expectancy over time for each Gapminder cluster.
createErrorBand derives one mean and two-sided 95% Student-t confidence
interval per year and cluster, then creates one closed area path plus explicit
lower and upper boundary paths per cluster.
The repository contains a
runnable browser example
and its complete program.
Start with the Vite project from Getting Started, then place the tutorial dataset in Vite’s public directory:
mkdir -p public
curl --fail --location https://raw.githubusercontent.com/ggaction/ggaction/6422776b0a379c8c89809f41b434f366fbc1f143/data/gapminder.json --output public/gapminder.json
Complete program
import { chart, render } from "ggaction";

const response = await fetch("/gapminder.json");
if (!response.ok) throw new Error(`Failed to load gapminder data: ${response.status}`);
const gapminder = await response.json();

const program = chart()
  .createCanvas({
    width: 760,
    height: 480,
    margin: { top: 90, right: 150, bottom: 70, left: 80 }
  })
  .createData({ values: gapminder })
  .createErrorBand({
    x: { field: "year", fieldType: "temporal" },
    y: { field: "life_expect" },
    groupBy: "cluster",
    curve: "cardinal",
    boundaries: {
      stroke: "#25364d",
      strokeWidth: 1.4,
      strokeDash: [6, 3],
      opacity: 0.8
    }
  })
  .encodeColor({
    target: "errorBand",
    field: "cluster",
    fieldType: "nominal",
    scale: { palette: "tableau10" }
  })
  .createGuides()
  .createTitle({
    text: "Life Expectancy by Cluster",
    subtitle: "Mean and 95% confidence interval"
  });

render(program, document.querySelector("#chart").getContext("2d"));
What the actions establish
| Stage | Semantic result | Graphical result |
|---|---|---|
createErrorBand |
Immutable year × cluster interval rows, one area layer, and boundary layers | Six closed bands with explicit lower and upper paths |
encodeColor |
Shared nominal cluster scale | One fill per cluster |
createGuides |
Temporal x, quantitative y, axes, horizontal grid, legend | Grid behind bands and guides above them |
createTitle |
Title and subtitle | Plot-aligned text above the chart |
The dataset ID, error-band ID, coordinate, scales, center, extent, and confidence level are inferred. The x field, y field, and grouping field are the only chart-specific decisions in this flow.
Horizontal bands and boundaries
Place the interval definition on x and the independent position on y to create
a horizontal band. Pass boundaries: {} to add lower and upper line paths, or
provide shared stroke, width, dash, opacity, and curve options:
program.createErrorBand({
  x: { field: "value", extent: "ci" },
  y: { field: "date", fieldType: "temporal" },
  curve: "cardinal",
  boundaries: {
    stroke: "#25364d",
    strokeWidth: 1.4,
    strokeDash: [6, 3],
    opacity: 0.8
  }
});
Key action trace
program
├─ createErrorBand
│  ├─ createIntervalData
│  ├─ createAreaMark
│  ├─ encodeX
│  ├─ encodeYRange
│  └─ encodeGroup
├─ encodeColor
├─ createGuides
└─ createTitle
Run and continue
- Serve the repository root and open
examples/gapminder-error-band/. - Read the exact error-band options.
- Use Data when interval rows are needed independently.
Documentation provenance
293 actions · sha256:e755591a2e5f5e2b494867583876e28020a478c5220b77bdc6ad469a6224891d