Published-release documentation · release compatibility
Box Plots
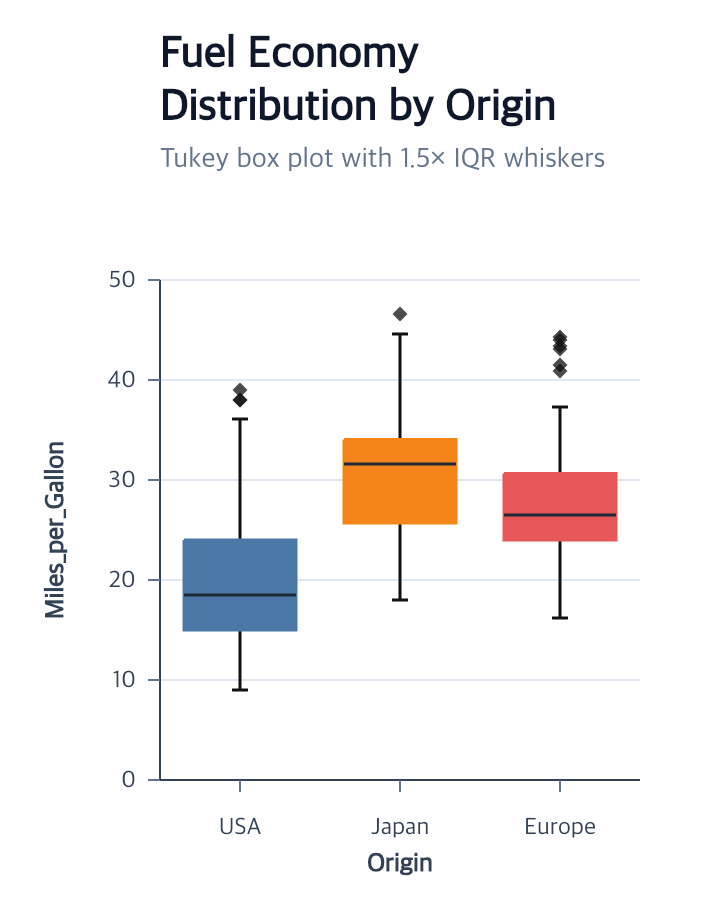
createBoxPlot creates vertical or horizontal box plots from one categorical
field and one quantitative field. It derives immutable summary data and
composes ordinary ranged-bar, error-bar, rule, and optional point actions.
At a glance
| Action | Shortest call | Result |
|---|---|---|
createBoxPlot |
createBoxPlot() after one eligible encoded layer |
Quartile boxes, medians, whiskers, caps, and optional outliers |
editBoxPlot |
editBoxPlot({ width: { band: 0.5 } }) |
Stable owner and current summary retained unless statistics change |
Contextual fragment. Use an ES module with the imports, data, and prepared resource state described in this section. Resolve these names from setup in this fragment or section; alternatives branch from the same base.
import { chart } from "ggaction";

const program = chart()
  .createCanvas({
    width: 360,
    height: 460,
    margin: { top: 140, right: 40, bottom: 70, left: 80 }
  })
  .createData({ values: cars })
  .createBoxPlot({
    x: { field: "Origin", fieldType: "nominal" },
    y: { field: "Miles_per_Gallon" },
    guides: { legend: false }
  });
createBoxPlot
Contextual fragment. Use an ES module with the imports, data, and prepared resource state described in this section. Resolve these names from setup in this fragment or section; alternatives branch from the same base.
createBoxPlot({
  id?, target?, data?, x?, y?, coordinate?, color?, summary?, whisker?, width?, outliers?,
  box?, median?, outlier?, guides?
} = {})
| Option | Meaning | Default or inference |
|---|---|---|
id |
box-body owner ID | first instance uses "boxPlot" |
target |
compatible encoded source layer | current, then unique eligible layer |
data |
source dataset | explicit value, source layer, current dataset, then unique dataset |
x |
categorical or quantitative field and optional scale | inferred from target when omitted |
y |
categorical or quantitative field and optional scale | inferred from target when omitted |
color |
categorical field name/scale encoding, or { value } body fill |
omitted: existing body style |
coordinate |
Cartesian coordinate ID | source coordinate, then "main" |
summary |
{ min, q1, median, q3, max } source field names |
omitted: compute from raw observations |
whisker |
statistical policy plus caps, capSize, stroke, opacity and stroke details |
Tukey with factor 1.5; precomputed summaries use minmax |
width |
{ band }, where 0 < band < 1, or positive { pixels } |
{ band: 0.7 } |
outliers |
create Tukey outlier resources | true for raw data; false for precomputed summaries |
box |
fill, opacity, stroke, strokeWidth, cornerRadius, and stroke details |
blue, opaque, 1.5 stroke, square corners |
median |
stroke, strokeWidth, stroke details, and width: { pixels } |
dark stroke with width 1.5; span follows box body |
outlier |
shape, radius, opacity, and stroke details |
black diamond, radius 3, opacity 0.75 |
guides |
false or applicable axis/grid/legend options |
omitted: no guides; explicit {} creates applicable guides |
createBoxPlot() may also establish an incomplete owner first. Compatible
encodeX and encodeY calls can follow later; the completed semantic and
graphical state is the same as supplying both channels at creation time.
Stored explicit guide options are applied when those deferred positions become
complete. Omission and guides: false preserve the historical no-guide result.
Completion reuses compatible guides, preserves their titles and styles, and
creates only missing components. Creating the deferred owner alone does not
produce a finished chart.
color is the same encoding as a later encodeColor call on the box body,
including explicit color scales. It runs after position completion and before
guides, and supports deferred positions. It does not split a category into
additional summary groups. Choose either color or an explicit box.fill.
The category/measure pairing determines orientation. This horizontal min–max example creates no outlier resources:
Contextual fragment. Use an ES module with the imports, data, and prepared resource state described in this section. Caller-provided receivers:
program. Resolve these names from setup in this fragment or section; alternatives branch from the same base.
program.createBoxPlot({
  x: { field: "Horsepower" },
  y: { field: "Origin", fieldType: "nominal" },
  whisker: { type: "minmax" }
});
Tukey factor and component appearance can be changed together without exposing the child marks:
Contextual fragment. Use an ES module with the imports, data, and prepared resource state described in this section. Caller-provided receivers:
program. Resolve these names from setup in this fragment or section; alternatives branch from the same base.
program.createBoxPlot({
  x: { field: "Origin", fieldType: "nominal" },
  y: { field: "Miles_per_Gallon" },
  whisker: { type: "tukey", factor: 1 },
  width: { band: 0.5 },
  box: { fill: "#f28e2b", opacity: 0.82, stroke: "#9a3412", strokeWidth: 2 },
  median: { stroke: "#431407", strokeWidth: 3 },
  outlier: { shape: "diamond", radius: 4, opacity: 0.9 }
});
Set outliers: false to keep the Tukey summary and whiskers without creating
an outlier dataset, layer, or graphic.
The shape-detail vocabulary and lifecycle follow
Mark Style.
Editing a box plot
Edit the stable box owner instead of generated whisker, cap, median, or outlier IDs:
Contextual fragment. Use an ES module with the imports, data, and prepared resource state described in this section. Caller-provided receivers:
program. Resource selectors used here:target: "boxPlot". Resolve these names from setup in this fragment or section; alternatives branch from the same base.
const styled = program.editBoxPlot({
  target: "boxPlot",
  whisker: { type: "tukey", factor: 1 },
  width: { band: 0.5 },
  box: { fill: "#f28e2b", opacity: 0.82, stroke: "#9a3412", strokeWidth: 2 },
  median: { stroke: "#431407", strokeWidth: 3 },
  outlier: { shape: "diamond", radius: 4, opacity: 0.9 }
});
Revise the raw source or replace either complete positional role without recreating the plot:
Contextual fragment. Use an ES module with the imports, data, and prepared resource state described in this section. Caller-provided receivers:
styled. Resource selectors used here:data: "observations". Resolve these names from setup in this fragment or section; alternatives branch from the same base.
const horizontal = styled.editBoxPlot({
  data: "observations",
  x: { field: "value", fieldType: "quantitative" },
  y: { field: "group", fieldType: "nominal" }
});
Omitted data, x, and y retain the current source and role. The complete
result must contain exactly one categorical and one quantitative position.
Switching those roles changes orientation while retaining the stable box,
whisker, cap, median, and applicable outlier IDs. Position axes and the
continuous grid move to the new channels; incompatible shared-scale or stored
selection state rejects the whole edit.
Whisker or outlier-presence changes create an immutable summary revision and
rebind the body, whiskers, caps, median, and optional outliers together. Width
or appearance-only edits keep the current derived datasets. outliers: false
removes the optional outlier resources; a later true recreates them only when
the revised Tukey result actually contains outlier rows.
Current statistical and visual defaults
- Quartiles use linear interpolation at
(n - 1) × p. - Whiskers use the most extreme observed values inside
1.5 × IQRfences. { type: "minmax" }instead uses each category’s observed minimum and maximum and never creates an outlier dataset, layer, or graphic.- Missing category or measure rows are omitted; non-missing non-finite measures are errors.
- Category order follows first valid source appearance.
- Box width is
0.7of the category band and box opacity is1. - Box borders, medians, whiskers, and caps use
1.5logical pixels. - Outliers are black diamonds with radius-equivalent size
3and opacity0.75. No outlier resource is created when no outlier row exists.
The summary and optional outlier datasets, child layers, and graphics use deterministic IDs derived from the owner. Canvas or shared-scale changes explicitly rematerialize boxes, medians, whiskers, caps, and outliers.
Current limitations
Subgroup offsets, notches, variable-width boxes, and custom whisker appearance are not implemented.
Precomputed summaries
Supply one row per box when the five summary values are already known:
Contextual fragment. Use an ES module with the imports, data, and prepared resource state described in this section. Resolve these names from setup in this fragment or section; alternatives branch from the same base.
import { chart } from "ggaction";

const summaryChart = chart().createCanvas().createData({ values: [
  { group: "A", min: 3.07, q1: 13.3475, median: 17.795, q3: 24.1275, max: 50.81 }
] }).createBoxPlot({
  x: { field: "group", fieldType: "nominal" },
  summary: { min: "min", q1: "q1", median: "median", q3: "q3", max: "max" },
  width: { pixels: 30 },
  median: { width: { pixels: 18 } },
  whisker: { caps: false, stroke: "black" }
});
The omitted quantitative position is inferred from summary.median when the
other position is supplied. An explicit quantitative position must name that
same field. Use categorical y for horizontal boxes. Values are copied exactly;
quartiles, fences and sample counts are not estimated. Each row must have
finite values satisfying min <= q1 <= median <= q3 <= max.
Missing categories are omitted. Repeated categories retain separate boxes at the
same category position; facets can partition them by another field. Missing
summary values are errors. Precomputed mode rejects Tukey policy and outliers: true.
Pixel box and median widths remain fixed on resize. Omitted median width follows
the body; editBoxPlot({ median: { width: "auto" } }) restores that behavior.
Whisker cap and stroke settings use the same options as error bars. Appearance
edits preserve summary data, while source, field mapping or statistical edits
create an immutable derived revision. editBoxPlot({ summary: false }) returns
to computing summaries from the current measure field; supply data and a new
measure position together when switching to raw observations.
Related
Marks · Encodings · Error bars · Guides
Documentation provenance
293 actions · sha256:e755591a2e5f5e2b494867583876e28020a478c5220b77bdc6ad469a6224891d