Published-release documentation · release compatibility
Cars Scatterplot Tutorial
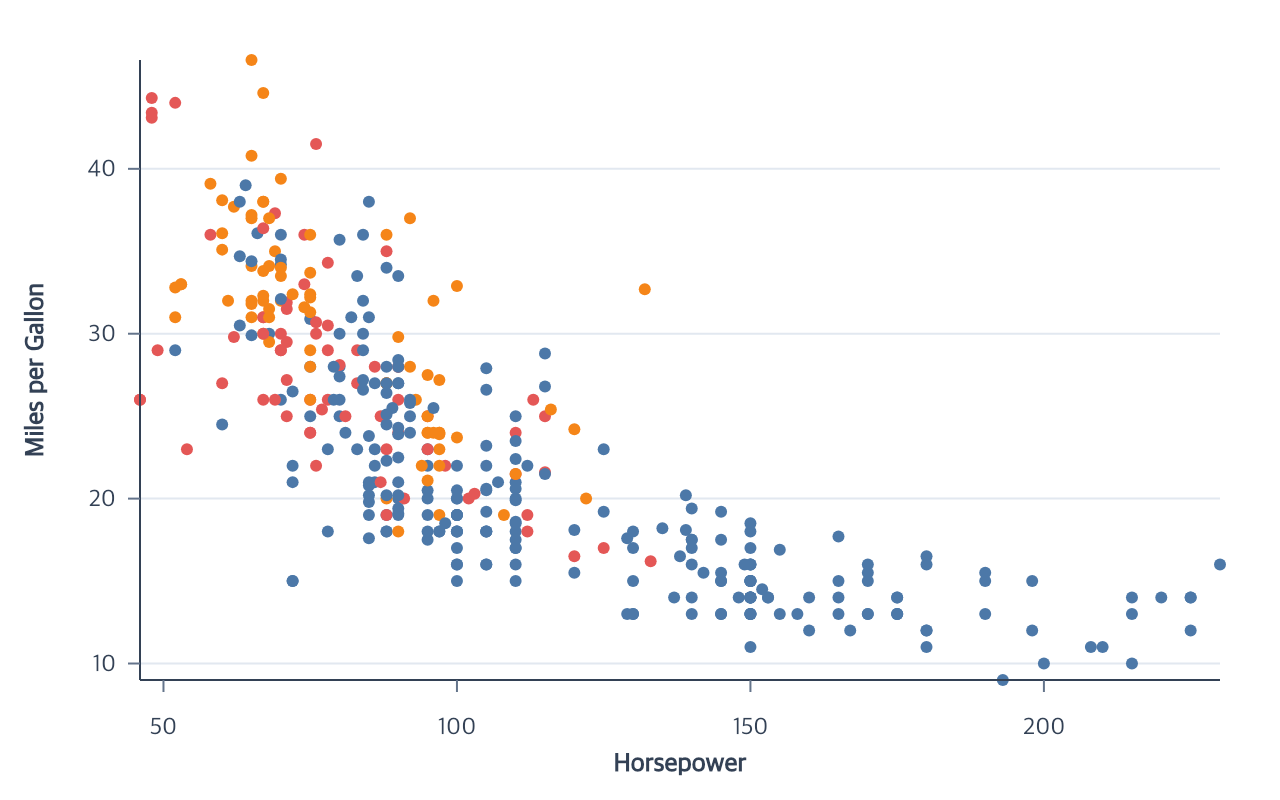
This tutorial uses the public npm package. The repository also contains a runnable browser example and its canonical program.
Start with the Vite project from Getting Started, then place the tutorial dataset in Vite’s public directory:
mkdir -p public
curl --fail --location https://raw.githubusercontent.com/ggaction/ggaction/6422776b0a379c8c89809f41b434f366fbc1f143/data/cars.json --output public/cars.json
Complete program
import { chart, render } from "ggaction";

const response = await fetch("/cars.json");
if (!response.ok) throw new Error(`Failed to load cars: ${response.status}`);
const cars = await response.json();
const rows = cars.filter(
  car =>
    Number.isFinite(car.Horsepower) &&
    Number.isFinite(car.Miles_per_Gallon)
);

const program = chart()
  .createCanvas({
    width: 640,
    height: 400,
    margin: { top: 30, right: 30, bottom: 60, left: 70 }
  })
  .createData({ id: "cars", values: rows })
  .createScatterPlot({
    id: "points",
    x: "Horsepower",
    y: "Miles_per_Gallon",
    color: "Origin",
    guides: {
      axes: {
        x: { title: { text: "Horsepower" } },
        y: { title: { text: "Miles per Gallon" } }
      }
    }
  });

const context = document.querySelector("#chart").getContext("2d");
render(program, context);
What each stage establishes
| Stage | Semantic result | Graphical result |
|---|---|---|
createCanvas |
— | Canvas dimensions and background |
createData |
Immutable named rows | — |
createScatterPlot |
Point layer, x/y/color encodings, scales, Cartesian coordinate, and guides | Concrete circles plus grid/axis lines, ticks, labels, and titles |
createScatterPlot calls createPointMark, the requested encoding actions,
and createGuides as wrapped children. Position encodings create the default
main Cartesian coordinate before guides are requested. The guide children
read that stored relationship; they do not create or repair coordinates.
Reassign encodings
The same encoding actions can replace compatible bindings. For a field-sized
variant, use the following alternative. If your own variant explicitly sets a constant encodeRadius, omit that conflicting graphical constant first:
const reassigned = chart()
  .createCanvas({ width: 640, height: 400, margin: 30 })
  .createData({ id: "cars", values: rows })
  .createPointMark({ id: "points" })
  .encodeX({ field: "Horsepower" })
  .encodeY({ field: "Miles_per_Gallon" })
  .encodeColor({ field: "Origin" })
  .createGuides({ axes: { x: {}, y: {} } })
  .encodeX({ field: "Displacement" })
  .encodeY({ field: "Acceleration" })
  .encodeColor({ field: "Cylinders" })
  .encodeSize({ field: "Weight_in_lbs" })
  .encodeShape({ field: "Origin" });
The calls reuse the current channel scales, recompute every concrete point and
connected guide, update inferred titles, and preserve explicit guide styling.
encodeSize remains incompatible with a stored constant radius; it does not
silently delete that graphical choice.
Continuous appearance variants
Use a quantitative field type to map point color continuously, then request its gradient legend:
const continuousColor = chart()
  .createCanvas({
    width: 760,
    height: 400,
    margin: { top: 30, right: 150, bottom: 60, left: 70 }
  })
  .createData({ id: "cars", values: rows })
  .createPointMark({ id: "points" })
  .encodeX({ field: "Horsepower" })
  .encodeY({ field: "Miles_per_Gallon" })
  .encodeColor({ field: "Acceleration", fieldType: "quantitative" })
  .encodeRadius({ value: 3 })
  .createGuides({ legend: { channels: ["color"] } });
Field opacity uses the same assignment style and automatically maps its domain
to [0.2, 1]:
const fieldOpacity = chart()
  .createCanvas({
    width: 760,
    height: 400,
    margin: { top: 30, right: 150, bottom: 60, left: 70 }
  })
  .createData({ id: "cars", values: rows })
  .createPointMark({ id: "points" })
  .encodeX({ field: "Horsepower" })
  .encodeY({ field: "Miles_per_Gallon" })
  .encodeRadius({ value: 4 })
  .encodeOpacity({ field: "Acceleration" })
  .createGuides({ legend: { channels: ["opacity"] } });
Both guides materialize concrete graphics and update after compatible scale or Canvas edits.
Key action trace
The trace keeps the user flow and meaningful guide decomposition. Primitive property edits remain available deeper in the same tree.
program
└─ createScatterPlot
   ├─ createPointMark
   ├─ encodeX
   ├─ encodeY
   ├─ encodeColor
   └─ createGuides
      ├─ createAxes
      │  ├─ createXAxis
      │  └─ createYAxis
      └─ createGrid
Run and continue
- Serve the repository root and open
examples/cars-scatterplot/. - View the complete browser source.
- Continue with Encodings, Guides, and the Basic Chart contract.
Documentation provenance
293 actions · sha256:e755591a2e5f5e2b494867583876e28020a478c5220b77bdc6ad469a6224891d