Published-release documentation · release compatibility
Line and Area Marks
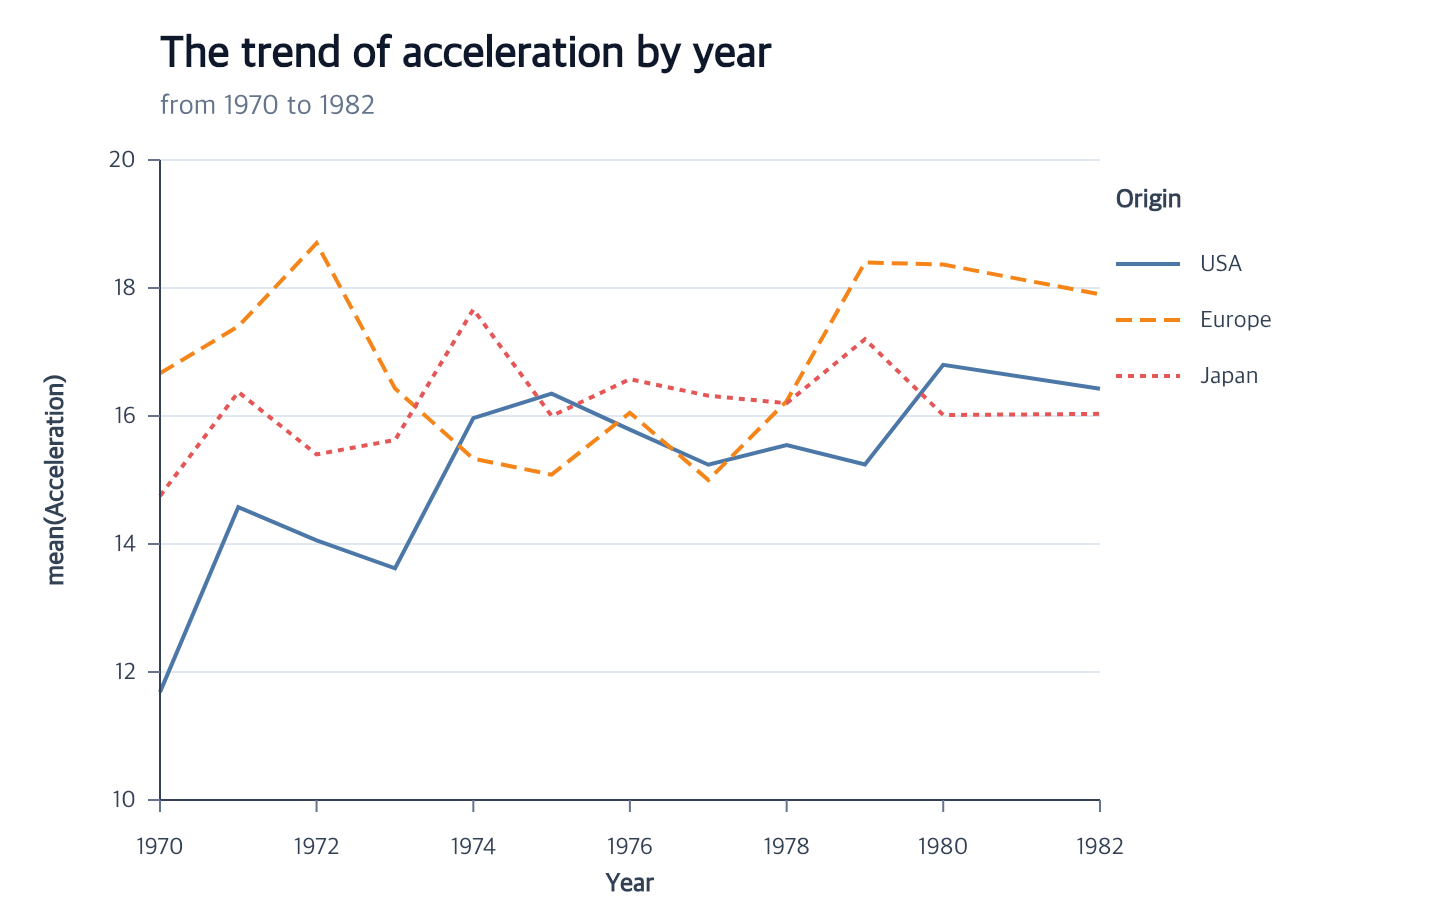
Line and area marks materialize ordered backend-neutral paths. Lines connect values; areas close two edges or one density edge against a baseline.
Line marks
createLineMark({ id?, data?, missing?, stroke?, strokeWidth?, opacity?, curve?, tension?, closed?, lineCap?, lineJoin?, miterLimit? } = {})
This heading shows common options. For the full callable contract and all branches, see createLineMark and the exact declarations.
Executable complete. Import chart from ggaction and supply the cars, rows, intervalRows, or values fixture described by this section. Each chain owns its Canvas.
const program = chart().createCanvas()
  .createData({ values: cars })
  .createLineMark({ stroke: "#7c3aed", opacity: 0.55 })
  .encodeX({ field: "Year", fieldType: "temporal" })
  .encodeY({ field: "Acceleration", aggregate: "mean" });
The first ID is "line", data defaults to current data, stroke width defaults
to 2, opacity defaults to 1, and curve defaults to "linear". A line begins
as an empty path collection because later grouping determines series
cardinality. Complete encodings materialize sorted commands; color and stroke
dash may regroup them.
For a direct quantitative line, encodeX and encodeY may be called in either
order. The first action stores valid incomplete semantic and scale state while
the path remains empty; the second completes the same final layer, resolved
scales, and graphics in both orders. Aggregate y lines are different: their
grain requires categorical, temporal, or binned quantitative x. Unbinned
quantitative x does not accept aggregate y.
Gaps
The default missing: "error" keeps strict validation. Choose missing: "break"
to leave a gap at null or absent x/y coordinates in a direct Cartesian line with
quantitative or temporal positions. Numeric strings, invalid dates and nonfinite
numbers remain errors. Each dimension needs at least one nonmissing value.
Valid x values still contribute to the x domain when y is missing, and vice versa.
Executable complete. Import ggaction in an ES module; all observations and required setup are included in this program.
import { chart } from "ggaction";

const gaps = chart().createCanvas().createData({ values: [
  { time: 1, amount: 2 }, { time: 2, amount: 4 },
  { time: 3, amount: null },
  { time: 4, amount: 5 }, { time: 5, amount: 6 }
] }).createLinePlot({ x: "time", y: "amount", line: { missing: "break" } });
Each run is a separate path and selection item; curves restart independently. Singletons have one move command; empty runs have no path. Raw rows remain, and each path owns its valid observations. Accessibility lists valid vertices. Snapshots retain gaps. Mark filtering retains selected series’ invisible gap rows so separated paths stay separate.
Default position sorting or explicit path order still applies. When the sorting
coordinate itself is missing, that row divides the original row order and each
side is sorted separately. Aggregate, binned, categorical, Polar and Parallel
positions do not accept this line policy. Parallel coordinates retain their own
independent missing-data option. editLineMark({ missing }) changes the policy;
switching to "error" rejects remaining missing coordinates atomically.
Ordered categories
A Cartesian line can use fieldType: "ordinal" or "nominal" on x, with raw
quantitative y or an explicit y aggregate. Both position authoring orders work.
The default categorical scale is point; band uses the same category centers
as companion points or bars. An explicit domain determines vertex order;
otherwise categories follow first appearance across the input rows.
Contextual fragment. Use an ES module with the imports, data, and prepared resource state described in this section. Resolve these names from setup in this fragment or section; alternatives branch from the same base.
import { chart } from "ggaction";

const weekly = chart().createCanvas().createData({ values: [
  { day: "Wed", value: 3 }, { day: "Mon", value: 1 }, { day: "Tue", value: 2 }
] }).createLinePlot({
  x: { field: "day", fieldType: "ordinal", scale: { domain: ["Mon", "Tue", "Wed"] } },
  y: "value"
});
Repeated categories retain source row order within each series unless an
aggregate is requested. Missing categories are not synthesized: the line
connects the remaining observed vertices, retaining their category spacing.
Missing/null raw values are rejected. A series still needs at least two
vertices; explicit encodePathOrder overrides default domain traversal.
Color/legend domain order does not change position order. Scale edits, reversal,
resizing, facets, selection, and accessible data retain the same category meaning.
When a line is layered immediately after a compatible encoded mark, omitted
data and positions are inferred. Compatible aggregate grain is inferred too,
so an aggregate trend over aggregate bars needs no repeated encodeX or
encodeY call:
Executable complete. Import chart from ggaction and supply the cars, rows, intervalRows, or values fixture described by this section. Each chain owns its Canvas.
const layered = chart().createCanvas()
  .createData({ values: cars })
  .createBarMark({ id: "bars" })
  .encodeX({ field: "Year", fieldType: "temporal" })
  .encodeY({ field: "Acceleration", aggregate: "mean" })
  .createLineMark({ id: "trend", strokeWidth: 3 });
Both layers reference the same x/y scales. The bar owns its bandwidth while
line vertices use the shared bar centers. Incompatible bin, stack, or offset
policies are not transferred. Pass data explicitly to assemble an independent
line with explicit encodings and scale IDs.
editLineMark({ target?, missing?, stroke?, strokeWidth?, opacity?, curve?, tension?, closed?, lineCap?, lineJoin?, miterLimit? })
This heading shows common options. For the full callable contract and all branches, see editLineMark and the exact declarations.
Contextual fragment. Use an ES module with the imports, data, and prepared resource state described in this section. Caller-provided receivers:
program. Resolve these names from setup in this fragment or section; alternatives branch from the same base.
program.editLineMark({
  curve: "monotone",
  stroke: "#7c3aed",
  strokeWidth: 4,
  opacity: 0.55
});
Supported curves are linear, step, step-before, step-after, basis,
cardinal, monotone, monotone-steffen, and natural. Smooth curves use cubic
commands. Two-point series use linear commands, except the existing monotone
recipe, which keeps its cubic representation. monotone uses weighted harmonic
tangents and requires strictly increasing or decreasing materialized x values.
monotone-steffen uses limited weighted secants and one-sided endpoint tangents.
It accepts either X direction, preserves vertical segments, and collapses consecutive
identical coordinates; an X-direction reversal is an error. The two recipes agree
at anchors but can differ between them. The explicit choice applies to Line, Area,
ErrorBand and requested boundary curves, and survives edits and saved programs.
Materialization rejects any line or complete area that would expand beyond
30,000 backend-neutral path commands before allocating that command array.
For Cartesian cardinal lines, tension is a finite number from 0 to 1,
with default 0 preserving the existing curve. It multiplies each tangent by
1 - tension: larger values make the line tighter, and 1 yields straight
segments represented by cubic commands with controls at the endpoints.
Endpoints use the nearest endpoint again as the missing neighbor; two-point
series remain linear. Other curve modes reject an explicit tension. Editing
away from cardinal clears the previous tension.
Contextual fragment. Use an ES module with the imports, data, and prepared resource state described in this section. Resolve these names from setup in this fragment or section; alternatives branch from the same base.
import { chart } from "ggaction";
const program = chart().createCanvas({ width: 400, height: 300, margin: 50 })
  .createData({ values: [{ x: 0, y: 0 }, { x: 3, y: 3 }, { x: 6, y: 0 }] })
  .createLinePlot({ x: "x", y: "y", line: { curve: "cardinal", tension: 0.9 } });
const softer = program.editLineMark({ tension: 0.5 });
A temporal x field with a quantitative y field can also retain raw observations:
omit aggregate to draw each row, or specify an aggregate such as mean to
combine observations at each time. Both encoding orders have the same result.
A constant stroke conflicts with field-driven encodeColor. Appearance is
stored and reapplied whenever scale, Canvas, or grouping changes rebuild paths.
lineCap, lineJoin, and miterLimit use the closed values and defaults in
Mark Style.
They remain authored state when a path changes between open and closed forms.
Polar lines and radar paths
Line marks also accept theta/radius positions. The two encoding actions may be called in either order; one channel remains valid semantic state but does not produce a path until both are present.
Executable complete. Import chart from ggaction and supply the cars, rows, intervalRows, or values fixture described by this section. Each chain owns its Canvas.
const radar = chart().createCanvas()
  .createData({ values: rows })
  .createLineMark({ closed: true, strokeWidth: 2.5 })
  .encodeTheta({ field: "category", fieldType: "nominal" })
  .encodeR({ field: "score", scale: { domain: [0, 1] } })
  .encodeGroup({ field: "series" });
closed defaults to false. When true, every series ends with one closing
Z command; the first row is not duplicated. editLineMark({ closed })
switches an existing Polar line between open and closed. Polar lines currently
accept only curve: "linear"; other interpolation modes remain available to
Cartesian lines. Color, stroke dash, grouping, legends, scale edits, Canvas
resizing, filtering, selection, and highlighting all rebuild the same path
through the shared line materialization lifecycle.
Area marks
createAreaMark({ id?, data?, fill?, opacity?, stroke?, strokeWidth?, curve?, missing?, lineCap?, lineJoin?, miterLimit? } = {})
This heading shows common options. For the full callable contract and all branches, see createAreaMark and the exact declarations.
Executable complete. Import chart from ggaction and supply the cars, rows, intervalRows, or values fixture described by this section. Each chain owns its Canvas.
const area = chart().createCanvas()
  .createData({ values: intervalRows })
  .createAreaMark()
  .encodeX({ field: "year", fieldType: "temporal" })
  .encodeYRange({ lower: "lower", upper: "upper" });
Area fill defaults to "#4c78a8", opacity to 0.2, and curve to "linear".
Area fill also accepts the existing FillPaint linear gradient. Coordinates
are normalized within each closed path, so grouped or broken paths each retain
the same local paint direction. The paint survives resizing, data/scale edits,
selection restoration, and editable or graphic persistence. Density, violin,
and error-band fill options share this contract. Use an explicit solid outline
when needed; a gradient cannot supply one inferred outline color.
Contextual fragment. Use an ES module with the imports, data, and prepared resource state described in this section. Resolve these names from setup in this fragment or section; alternatives branch from the same base.
import { chart } from "ggaction";
const gradientArea = chart()
  .createCanvas({ width: 300, height: 200, margin: 30 })
  .createData({ values: [{ x: 0, y: 1 }, { x: 1, y: 3 }, { x: 2, y: 2 }] })
  .createAreaPlot({ x: "x", y: "y", guides: false })
  .editAreaMark({
    fill: {
      type: "linear-gradient", from: { x: 0, y: 1 }, to: { x: 0, y: 0 },
      stops: [{ offset: 0, color: "white" }, { offset: 1, color: "#fc6721" }]
    },
    opacity: 0.7
  });
An area becomes renderable with exactly one ranged orientation, a complete
density value/density pair, or aligned grouped x/y values whose y encoding uses
stack: "center". encodeGroup creates one closed path per nominal group
without creating a scale or legend. For a center-stacked area,
encodeColor({ field, layout: "center" }) can author the matching group and
center y policy atomically.
editAreaMark({ target?, fill?, opacity?, stroke?, strokeWidth?, curve?, missing?, lineCap?, lineJoin?, miterLimit? })
This heading shows common options. For the full callable contract and all branches, see editAreaMark and the exact declarations.
Contextual fragment. Use an ES module with the imports, data, and prepared resource state described in this section. Caller-provided receivers:
program. Resolve these names from setup in this fragment or section; alternatives branch from the same base.
program.editAreaMark({
  opacity: 0.35,
  stroke: "#334155",
  strokeWidth: 1.5,
  curve: "cardinal"
});
stroke: false removes both outline and stored width. A width-only edit
requires an active outline. Constant fill cannot replace a field-driven color
encoding. Complete paths rematerialize immediately; incomplete paths retain the
configuration until their encodings become renderable. A later field color encoding
uses its scale while retaining the fallback paint; removing that encoding reveals
the stored fill. Without a field color, stroke-legend swatches preserve a gradient
area’s paint and opacity.
Area stroke details use the same shared Mark Style contract as Line.
Arc marks
createArcMark({ id?, data?, innerRadius?, padAngle?, fill?, opacity?, stroke?, strokeWidth?, lineCap?, lineJoin?, miterLimit? } = {})
Contextual fragment. Use an ES module with the imports, data, and prepared resource state described in this section. Resolve these names from setup in this fragment or section; alternatives branch from the same base.
const donut = chart()
  .createCanvas({ width: 640, height: 500, margin: 55 })
  .createData({ values: cars })
  .createArcMark({ innerRadius: 0.56, padAngle: 1.5 })
  .encodeTheta({ field: "Origin", aggregate: "count" })
  .encodeColor({ field: "Origin", palette: "tableau10" });
innerRadius is a ratio from 0 inclusive to 1 exclusive, or
{ unit: "px", value: 60 } for a fixed pixel hole. Pixel values must be finite,
non-negative, and smaller than the resolved outer radius. Automatic radial
ranges use that same inner baseline; explicit measured ranges must agree. padAngle uses
degrees. Direct quantitative theta creates one proportional sector per positive
row. Count or weighted-sum categorical theta creates aggregated proportional
sectors. Categorical theta plus quantitative encodeR creates equal-angle
radial sectors; repeated rows in one angle band are drawn larger first so
smaller overlays remain visible. Arc graphics are ordinary closed path
commands, so renderers do not interpret Polar semantics.
editArcMark({ target?, innerRadius?, padAngle?, fill?, opacity?, stroke?, strokeWidth?, lineCap?, lineJoin?, miterLimit? })
Geometry and appearance edits rebuild complete sectors. An incomplete arc
retains the edited settings until both required encodings exist. Constant
fill cannot replace a field-driven color encoding. stroke: false disables
the outline and stored width; a later string stroke restores width 1.
Arc stroke cap/join values are retained for the closed path and later replay.
Area endpoints can use a quantitative field or a finite { datum: number } bound.
At least one endpoint must be a field; the independent position is always a field.
Use encodeYRange({ lower: "value", upper: { datum: 0 } }) for a vertical zero baseline.
Both endpoints contribute to the shared scale domain. A log scale requires a nonzero baseline of the same sign as the field values.
The default missing: "error" rejects missing endpoints. With missing: "break",
null or undefined measured endpoints split the path into closed segments with at least two consecutive valid samples.
Missing independent positions, invalid group keys, NaN and Infinity remain errors.
editAreaMark({ missing: "break" }) changes the same policy. Density and Horizon retain their own missing-data policies.
Ordered categories.
Nominal/ordinal independent positions support point/band scales. Domain order (or first appearance) orders vertices unless path order is explicit. Stacking requires aligned groups; missing categories are not synthesized.
Align sparse groups with createCompleteData: explicitly fill counts/sums with
zero; keep missing means null with missing: "break". Stack/fill/center break all
series at unknown totals. Isolated samples produce empty paths with finite
domains. Completion edits rematerialize area consumers.
Contextual fragment. Use an ES module with the imports, data, and prepared resource state described in this section. Resolve these names from setup in this fragment or section; alternatives branch from the same base.
import { chart } from "ggaction";

const program = chart().createCanvas({ width: 640, height: 400, margin: { top: 30, right: 120, bottom: 60, left: 60 } }).createData({ values: [
  { day: "Mon", channel: "A", sales: 10 },
  { day: "Tue", channel: "A", sales: 20 },
  { day: "Mon", channel: "B", sales: 5 },
  { day: "Tue", channel: "B", sales: 8 }
]}).createAreaPlot({
  x: { field: "day", fieldType: "ordinal", scale: { type: "point", domain: ["Mon", "Tue"] } },
  y: "sales", groupBy: "channel", color: "channel", layout: "stack"
});
Stacked totals: Mon 15, Tue 28.
Related
Position encodings · Polar line tutorial · Series encodings · Density · Error bands
Documentation provenance
293 actions · sha256:e755591a2e5f5e2b494867583876e28020a478c5220b77bdc6ad469a6224891d