Published-release documentation · release compatibility
Density Area Chart Tutorial
Complete density facade
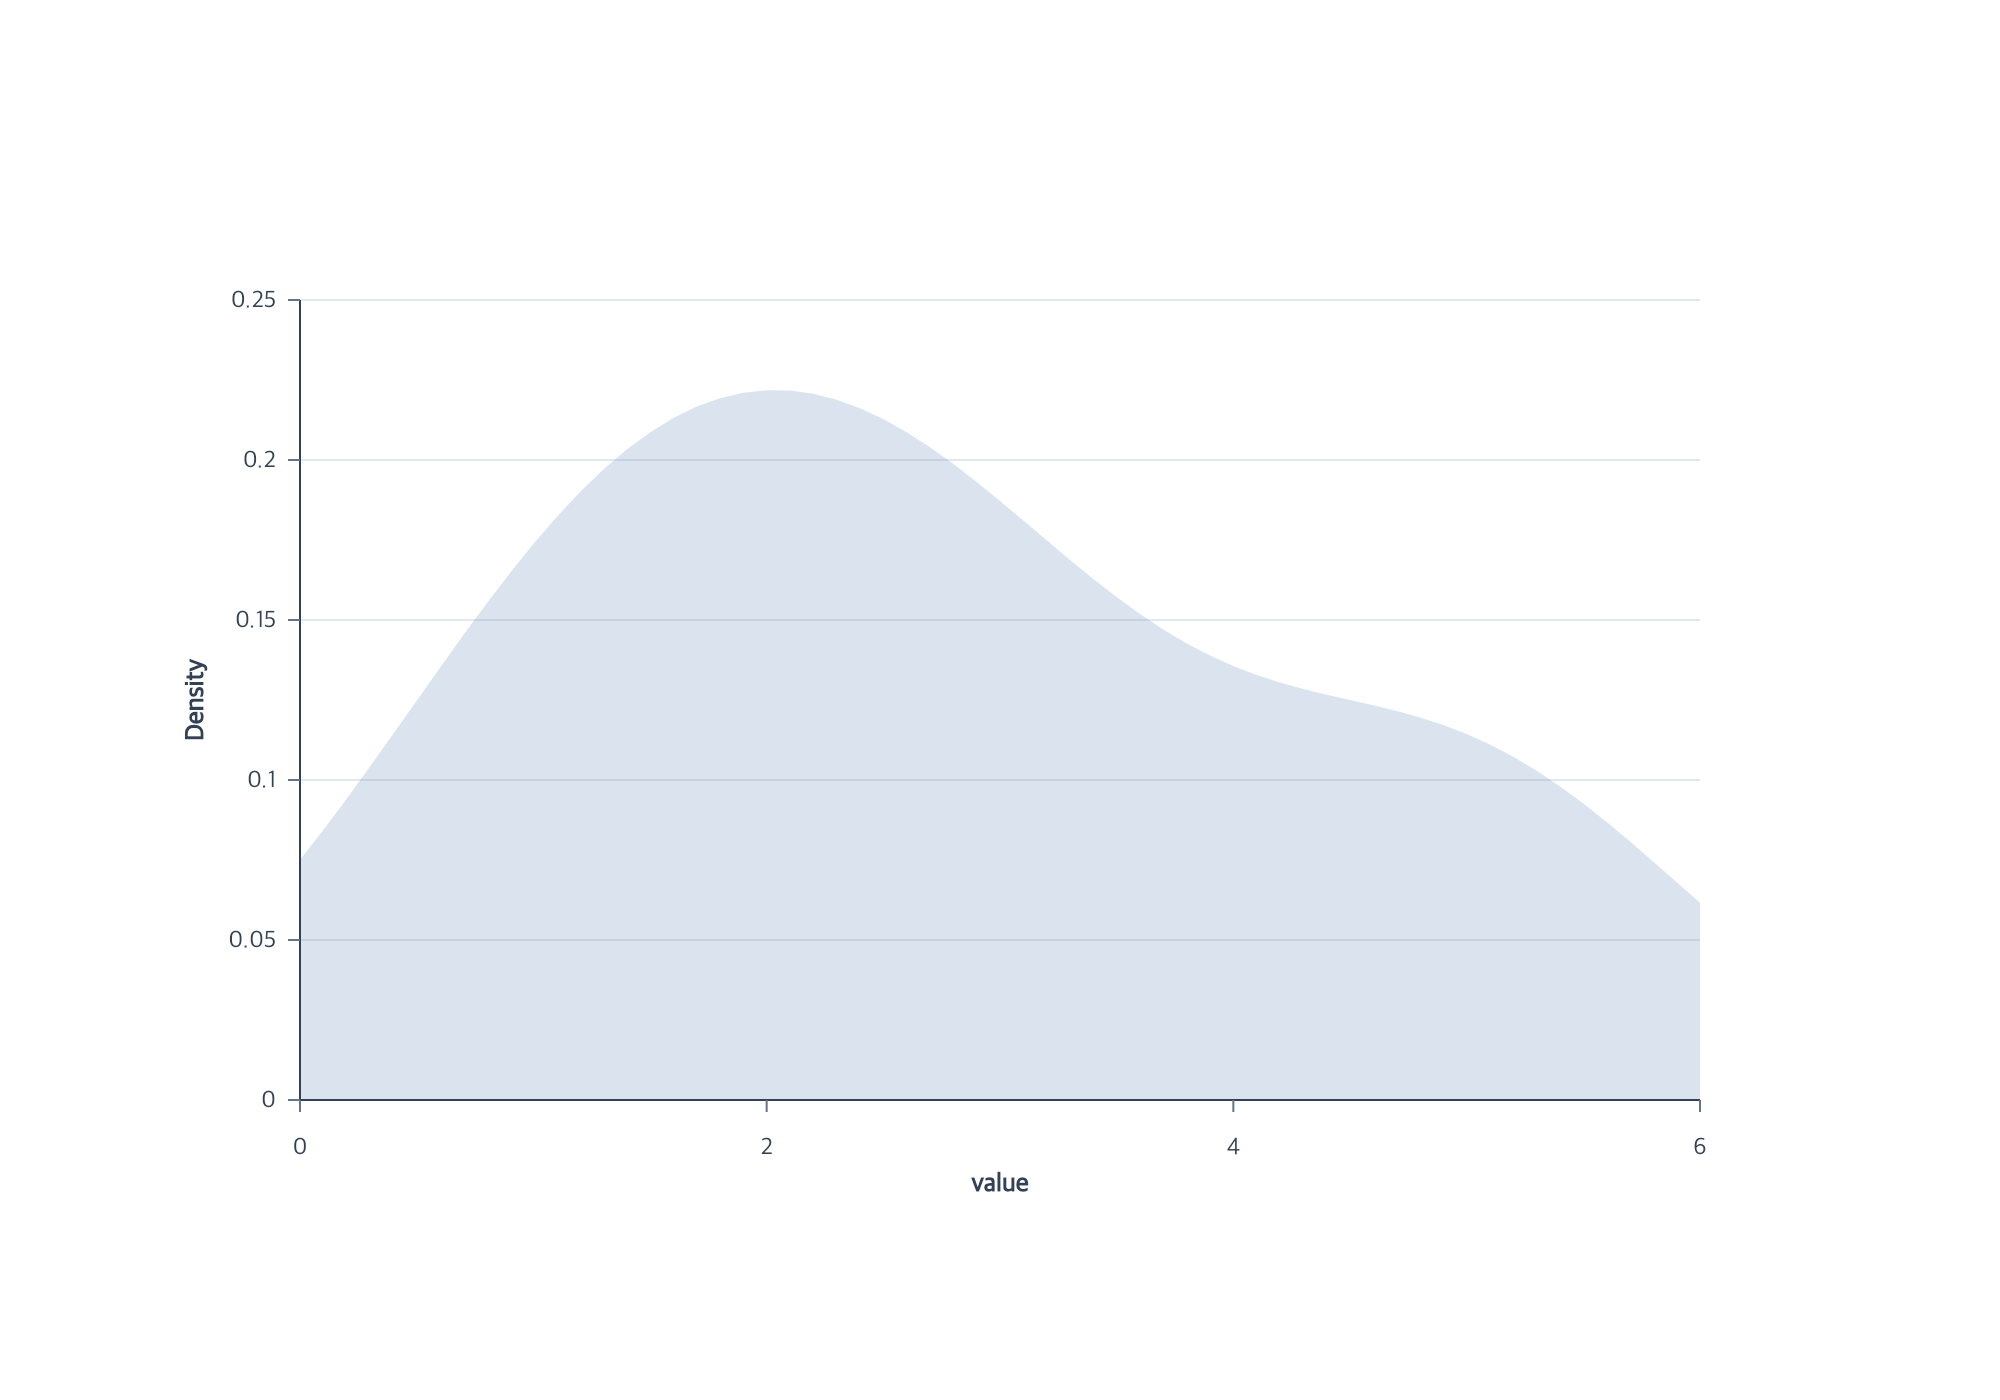
Use createDensityPlot to complete a density chart in one action:
import { chart } from "ggaction";

const program = chart()
  .createCanvas({ width: 1000, height: 700, margin: 150 })
  .createData({ id: "source", values: [
    { value: 1, group: "A" }, { value: 2, group: "A" },
    { value: 3, group: "B" }, { value: 5, group: "B" }
  ] })
  .createDensityPlot({ id: "density", field: "value", bandwidth: 1, extent: [0, 6], steps: 61 });
Add groupBy: "group", color: "group" for two colored profiles. Grouping alone does not add color.
Use densityChannel: "x" for horizontal density. Both orientations keep the existing horizontal grid;
explicit grid options can choose a direction. editDensity changes the statistical estimate, while
editAreaMark changes its appearance. The source remains immutable, and derived profiles retain only
the group and the two generated value/density fields.
The runnable example includes all three variants. The workflow below shows the same lower-level owners on car data.
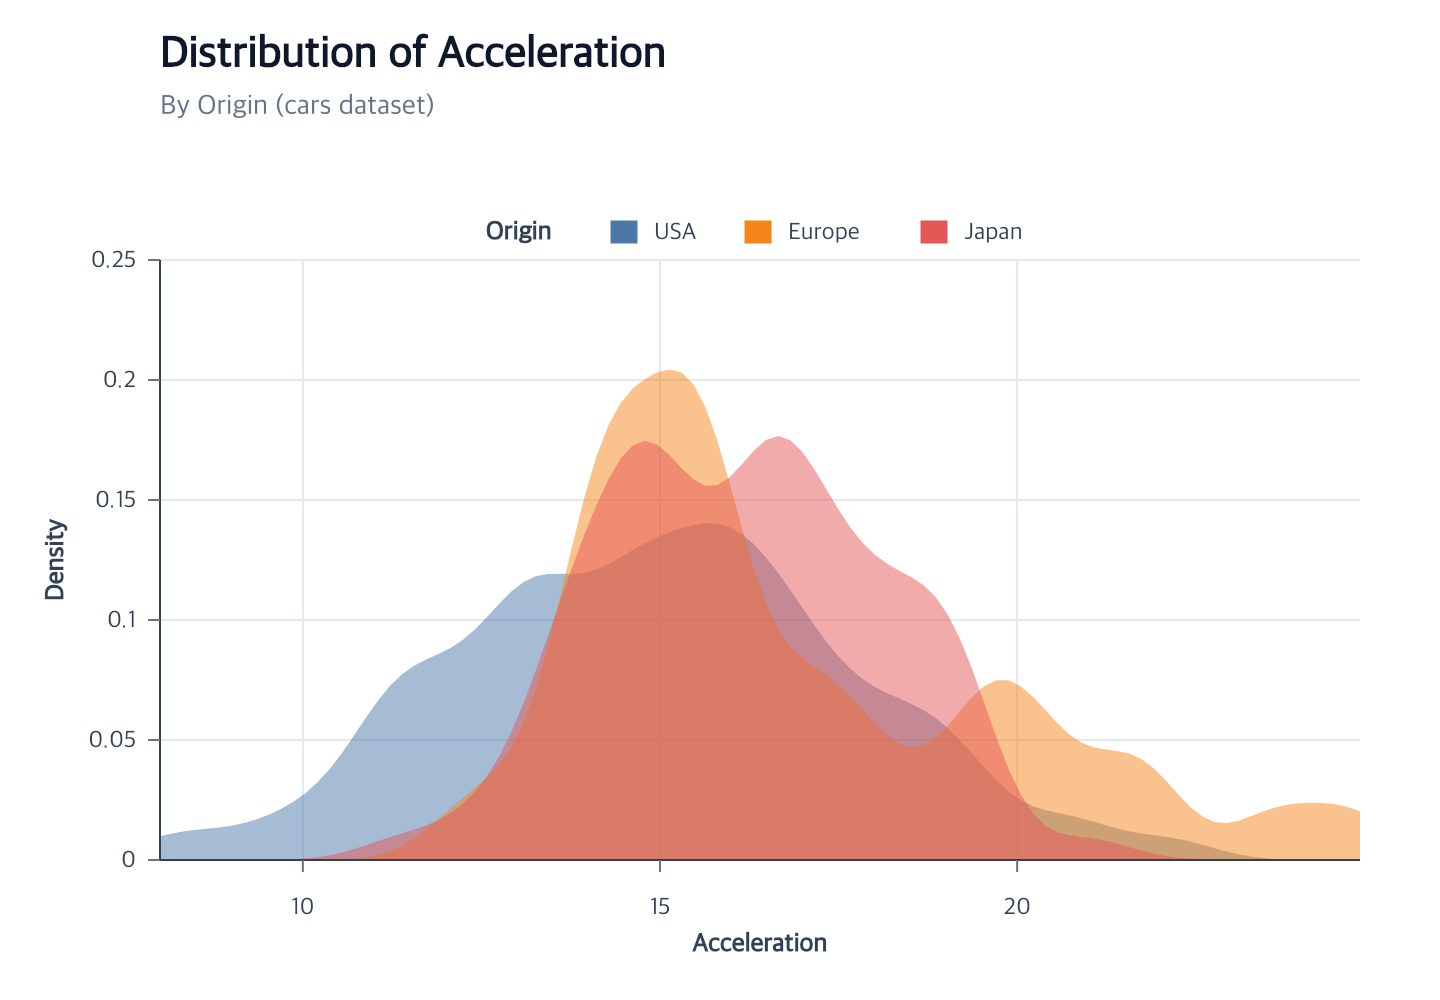
This chart estimates the distribution of car acceleration separately for each
Origin. The source rows remain immutable; encodeDensity creates a named
derived dataset and materializes one translucent, zero-baseline area per
group. The complete module below uses the public npm package. The repository
also contains a
runnable browser example
and its complete program.
Start with the Vite project from Getting Started, then place the tutorial dataset in Vite’s public directory:
mkdir -p public
curl --fail --location https://raw.githubusercontent.com/ggaction/ggaction/6422776b0a379c8c89809f41b434f366fbc1f143/data/cars.json --output public/cars.json
Complete program
import { chart, render } from "ggaction";

const response = await fetch("/cars.json");
if (!response.ok) throw new Error(`Failed to load cars: ${response.status}`);
const cars = await response.json();

const program = chart()
  .createCanvas({
    width: 720,
    height: 500,
    margin: { top: 130, right: 40, bottom: 70, left: 80 }
  })
  .createData({ id: "cars", values: cars })
  .createAreaMark({ id: "densities", opacity: 0.5 })
  .encodeDensity({
    field: "Acceleration",
    groupBy: "Origin",
    bandwidth: 0.6
  })
  .encodeColor({
    field: "Origin",
    scale: { palette: "tableau10" }
  })
  .createGuides({
    grid: { horizontal: {}, vertical: {} },
    legend: {
      position: "top",
      direction: "vertical",
      columns: 3,
      titlePosition: "left",
      offset: 8
    }
  })
  .createTitle({
    text: "Distribution of Acceleration",
    subtitle: "By Origin (cars dataset)"
  });

render(program, document.querySelector("#chart").getContext("2d"));
What the actions establish
| Stage | Semantic result | Graphical result |
|---|---|---|
createAreaMark |
Area layer initially bound to cars |
Empty path collection with opacity 0.5 |
encodeDensity |
KDE transform, derived data, x/y and group encodings | Three sorted, baseline-closed command paths |
encodeColor |
Origin ordinal color scale | Tableau fills in first-appearance order |
createGuides |
Shared axes, two grids, color legend | Grid behind paths; axes and top swatches above them |
createTitle |
Chart title and subtitle | Plot-aligned text above the non-overlapping legend |
The density axis defaults to y and includes zero. The value axis preserves the
shared observed extent. Set densityChannel: "x" to reverse the orientation;
the axis titles and baseline orientation follow automatically.
The default estimate uses the Gaussian kernel with unit normalization. Use
kernel and normalization on encodeDensity, or call editDensity later to
create and bind an immutable revised estimate while preserving the source.
direction controls how legend items fill a multi-row grid, while columns
sets its maximum column count. titlePosition: "left" places Origin beside
the three items without changing the chart-wide right-side legend default.
Move and wrap the title
The title is an independently editable resource. This optional continuation
uses the program created above and returns a new program without changing it:
const bottomTitleProgram = program
  .editCanvas({
    height: 620,
    margin: { top: 130, right: 40, bottom: 190, left: 80 }
  })
  .editTitle({
    text: "Distribution of Acceleration Across Vehicle Origins",
    subtitle: "Kernel density estimates for acceleration, grouped by origin in the cars dataset",
    position: "bottom",
    align: "center",
    offset: 60,
    gap: 12,
    maxWidth: 270,
    wrap: "word",
    lineHeight: 26
  });

render(bottomTitleProgram, document.querySelector("#chart").getContext("2d"));
The title action resolves deterministic lines before rendering. See Titles for all four positions, character wrapping, style editing, and subtitle removal.
Key action trace
The atomic encoding exposes every reusable action it delegates to.
program
├─ createAreaMark
├─ encodeDensity
│  ├─ createDensityData
│  ├─ editSemantic
│  ├─ encodeX
│  ├─ encodeY
│  ├─ encodeGroup
│  └─ rematerializeAreaMark
├─ encodeColor
│  └─ rematerializeAreaMark
├─ createGuides
│  ├─ createAxes
│  ├─ createGrid
│  └─ createLegend
└─ createTitle
Run and continue
- Serve the repository root and open
examples/cars-density-area/. - View the complete chart program.
- Continue with Encodings, Legends, and Scale options.
Documentation provenance
293 actions · sha256:e755591a2e5f5e2b494867583876e28020a478c5220b77bdc6ad469a6224891d