Published-release documentation · 281 actions; release compatibility · contract 5520b0fa9525
Complete Axes and Labels
createAxes(options?)
Creates complete axes for encoded Cartesian x/y, Polar theta/radius, or Parallel dimension channels. This is the recommended axis action for ordinary chart authoring.
Contextual fragment. Use an ES module with the imports, data, and prepared resource state described in this section. Caller-provided receivers:
program. Resolve these names from setup in this fragment or section; alternatives branch from the same base.
program.createAxes({
  y: { ticksAndLabels: { count: 6 } }
});
| Option | Type | Default |
|---|---|---|
coordinate |
{ id?, type? } |
unique coordinate used by x/y layers |
x |
axis options or false |
create when x is encoded |
y |
axis options or false |
create when y is encoded |
theta |
Polar axis options or false |
create when theta is encoded |
radius |
Polar axis options or false |
create when radius is encoded |
coordinate.type accepts "auto", "cartesian", "polar", or "parallel" as a stored
type assertion.
An explicit coordinate ID and type must agree with the stored coordinate.
Options from another family are rejected, including false: x/y options
require Cartesian encodings, theta/radius options require Polar encodings,
and Parallel axes do not accept these channel-specific option objects.
Each x/y axis option supports:
| Option | Value |
|---|---|
scale |
scale ID; inferred when one scale is used on the channel |
position |
x: "bottom" or "top"; y: "left" or "right" |
line |
false or { color?, lineWidth? } |
ticksAndLabels |
false or { count?, values?, ticks?, labels? } |
title |
false or title options including text, at, offset, and font styling |
Use either count or exact data-space values for ticks. Ambiguous coordinates
or scales must be selected explicitly. createAxes reads stored coordinates;
it never creates or repairs them. Tick, label, and grid count values and
explicit values arrays are limited to 10,000 generated items.
Linear scales create numeric nice ticks. Time scales choose a UTC calendar
interval near the requested count and format labels automatically. Automatic
formatting starts from the domain span, then raises precision only when two
distinct resolved ticks would otherwise share a label. For example, a
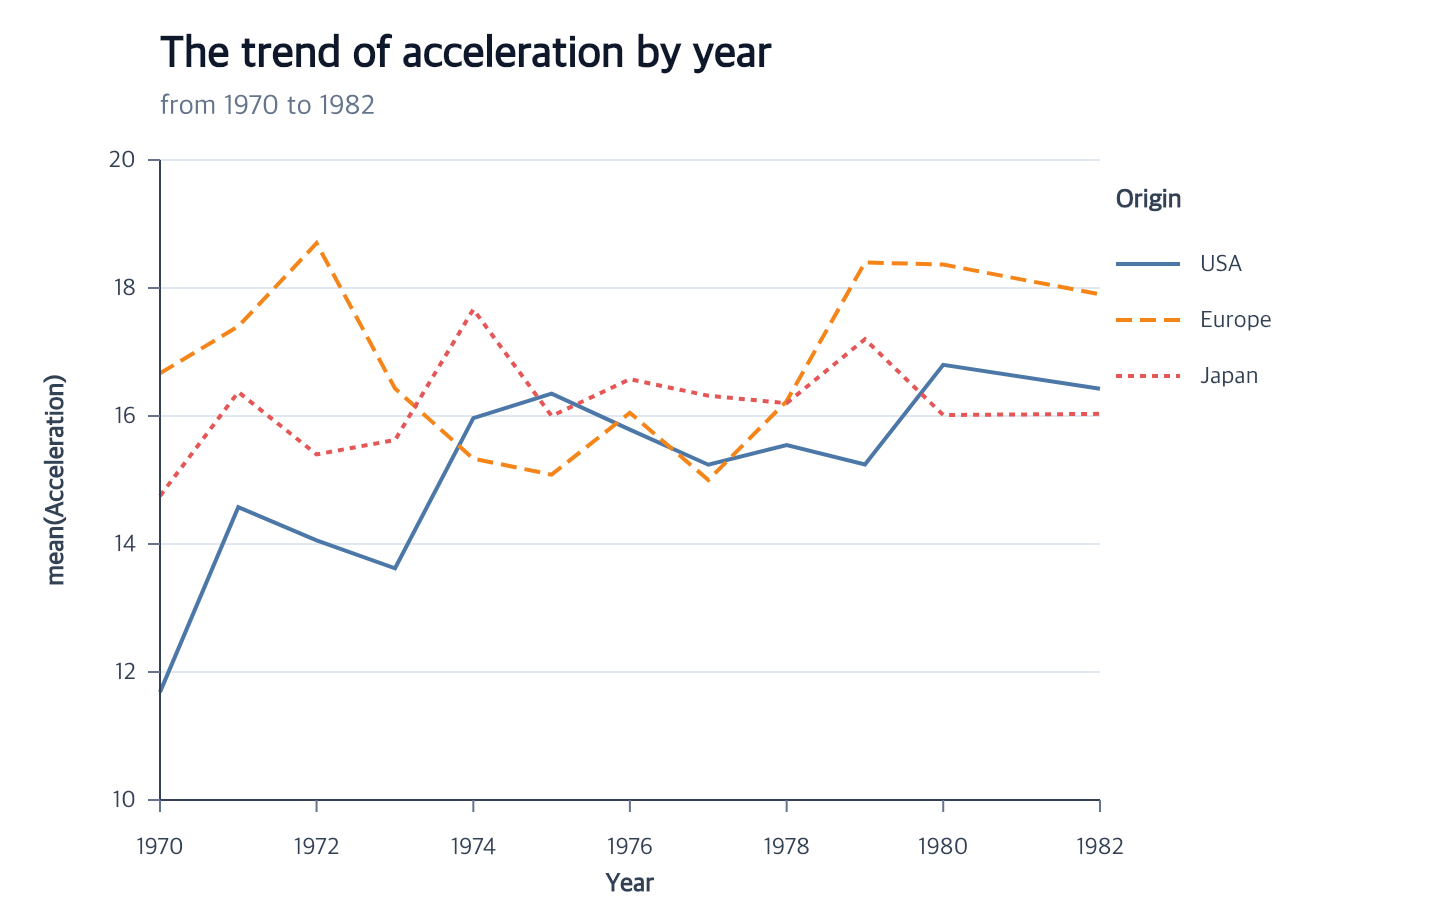
1970–1982 domain produces 1970, 1972, …, 1982, while sub-month ticks
include the day needed to distinguish them. Explicit time values are finite
timestamps. Exceptionally long valid date domains use a nice multi-year step
when the fixed calendar interval would grossly oversample the requested count.
A band or point x scale uses its complete domain as the default tick and label
values. Each value is placed at the shared band or point center and formatted
with String(value). Explicit ticksAndLabels.values may select a domain
subset in the requested order. Discrete axes reject count so categories are
not silently omitted. Reversed ranges and Canvas rematerialization preserve
the stored category values.
Categorical Cartesian labels and categorical theta labels can replace display text without changing raw categories:
Contextual fragment. Use an ES module with the imports, data, and prepared resource state described in this section. Caller-provided receivers:
program. Resolve these names from setup in this fragment or section; alternatives branch from the same base.
const named = program.createXAxisLabels({
  labelMap: [
    { value: 1, label: "One" },
    { value: "1", label: "String one" },
    { value: "KR", label: "South Korea" }
  ]
});
Map lookup uses the typed raw value, so 1 and "1" remain distinct. Values
missing from the map use the normal formatter. Repeated visible labels do not
merge scale entries, ticks, legend symbols, or selections. An empty label
hides that text while retaining its item; labelMap: [] stores an explicit
empty map and labelMap: "auto" removes the map. Cartesian continuous axes,
continuous theta axes, radial axes, and Parallel dimension axes reject this
option. The same option is available in focused label actions, nested
ticks-and-labels options, complete Cartesian axes, and categorical theta
facades.
For a binned histogram x encoding, omitted tick options use the inferred bin
boundaries. This keeps the axis aligned with every rect edge. Explicit
ticksAndLabels.count or ticksAndLabels.values takes precedence. Count y
axes use numeric nice ticks and infer titles such as count(Displacement).
Titles are inferred from the unique encoding consuming each scale. Aggregate
encodings include their operation, so mean on Acceleration becomes
mean(Acceleration). Pass title.text when inference is ambiguous or a custom
label is desired.
The default edges remain bottom for x and left for y. A complete axis forwards an explicit edge to its line, ticks, labels, and title:
Contextual fragment. Use an ES module with the imports, data, and prepared resource state described in this section. Caller-provided receivers:
program. Resolve these names from setup in this fragment or section; alternatives branch from the same base.
program.createAxes({
  x: {
    position: "top",
    ticksAndLabels: { labels: { format: ".1f" } }
  },
  y: { position: "right" }
});
Top ticks point upward and right ticks point right. Labels and titles are
placed outward from the selected edge. The Canvas margin must already be large
enough; guide creation does not resize it. A later explicit fitCanvas() call
can shrink excess margin on a Full unit chart.
Cartesian label styles accept rotation, maxWidth, wrap, lineHeight, and
overlap in focused label actions, ticks-and-labels groups, and complete axis
facades. Numeric rotations are radians; { value, unit } accepts radians or
degrees. Setting a positive maxWidth stores deterministic word or character
wrapping as concrete text lines. Word wrapping is the default, and an oversized
word is split by Unicode code point. lineHeight defaults to fontSize * 1.2
and cannot be smaller than the font size.
Contextual fragment. Use an ES module with the imports, data, and prepared resource state described in this section. Caller-provided receivers:
program. Resolve these names from setup in this fragment or section; alternatives branch from the same base.
program.createXAxis({
  ticksAndLabels: {
    labels: {
      maxWidth: 72,
      wrap: "word",
      rotation: { value: -24, unit: "degrees" }
    }
  }
});
overlap defaults to "error". Explicit "allow" permits label-to-label
intersection while Canvas overflow and axis-title collisions still fail.
editXAxisLabels({ maxWidth: false }) or its y counterpart removes wrapping;
that reset cannot include wrap or lineHeight in the same call. Canvas and
scale replay rebuild the same lines from the stored policy. The 10,000-item
limit applies after wrapping.
Cartesian title rotation accepts a finite legacy number in radians or an
explicit { value, unit: "degrees" | "radians" } object. Both forms normalize
to radians before materialization. This does not change the degree-valued
angle used to place radial-axis components.
Numeric label formats use .0f through .12f for fixed decimals, .0%
through .12% for percentages, and .0e through .12e for scientific
notation. A leading zero in a one-digit precision, such as .01f, is accepted
and means .1f.
UTC time formats compose %Y (year), %m (two-digit month), %d (two-digit
day), and %b (English abbreviated month) with literals, for example %b %Y,
%Y-%m, or %Y/%m/%d; use %% for a literal percent sign. Every time format
must contain at least one date directive, and unknown or dangling directives
are rejected. Numeric formats apply to quantitative scales, including log,
sqrt, pow, and symlog; time formats require a time scale. Discrete labels use
"auto" and may apply labelMap. The existing { decimals:
nonNegativeInteger } form remains available for numeric labels. Explicit
formats remain exact and may intentionally produce repeated display strings.
The selected coordinate ID is stored on each semantic axis. Canvas size and margin edits explicitly rematerialize positional scales and every connected axis component.
A temporal aggregate-bar scale keeps its inset range for bar centers, ticks, and labels. Its axis baseline alone spans the complete plot edge, matching the crossing grid geometry so a differently colored zero-grid line cannot remain visible as end caps. Reversed scales reverse the stored baseline endpoints without changing that complete visible span.
The trace preserves its decomposition:
createAxes
├─ createXAxis (when selected)
└─ createYAxis (when selected)
For a Polar coordinate, the same aggregate becomes:
createAxes
├─ createThetaAxis
└─ createRadialAxis
createThetaAxis() creates the outer circular baseline, outward ticks,
perimeter labels, and an inferred title. createRadialAxis() creates one
center-to-edge baseline; its angle defaults to 90 degrees (right). Both
support ticksAndLabels: { count?, values?, ticks?, labels? } and title style.
Use line: false, ticksAndLabels: false, or title: false to omit components.
The radial title defaults to position: "inside" at the baseline midpoint.
Use title: { position: "outside" } to place it beyond the radial endpoint;
offset is measured from the midpoint normal when inside and from the endpoint
when outside.
For a Parallel coordinate, createAxes() delegates to public createParallelAxes().
Each encoded field gets a baseline, ticks, labels, and a title. Use
createParallelAxis({ field }) to create one missing field axis and
editParallelAxis({ field, ... }) to edit its components. These actions are Full-only.
The following fragment assumes program has a Parallel dimension named
Miles_per_Gallon with existing axes:
Contextual fragment. Use an ES module with the imports, data, and prepared resource state described in this section. Caller-provided receivers:
program. Resolve these names from setup in this fragment or section; alternatives branch from the same base.
const styled = program.editParallelAxis({
  field: "Miles_per_Gallon",
  line: { color: "#7c3aed", lineWidth: 3 },
  title: { text: "Fuel economy", fontWeight: 700 }
});
const restored = styled
  .editParallelAxis({ field: "Miles_per_Gallon", ticks: false })
  .createParallelAxis({
    field: "Miles_per_Gallon", line: false, labels: false, title: false,
    ticks: { length: 10 }
  });
field is required and must match an encoded dimension. target uses the stored
axis owner or the unique encoded Parallel line. A different owner is an error.
Create requires missing components: omitted components get defaults, false
skips them, and all-disabled creation is invalid. Edit requires existing components:
objects patch, false removes, and omissions preserve. To remove a field’s entire
axis, use removeParallelAxis({ field }); use removeParallelAxes() for all axes.
Removing the final component also clears the empty owner while preserving marks and scales.
Ticks and labels accept independent count or exact values, or share them through
ticksAndLabels. Do not combine the grouped and independent forms. Count is
quantitative-only; ordinal values must be domain members. Count and values are
mutually exclusive. Group members accept styles, not nested false.
Counts, value arrays, and each rendered collection are limited to 10,000 items.
Values must be distinct and inside the scale domain; an empty values array retains
an empty component. Label format follows axis components.
Defaults preserve the original Parallel appearance: line width 1.25, tick length 8,
automatic count 5, labels 9 pixels left at size 11, and titles 20 pixels above at size
13 and weight 600. Titles accept text, offset, color and font styles; labels
accept offset, format and font styles. Parallel axes do not accept Cartesian
positions, radial angles or title rotation, and do not fit the Canvas automatically.
Field styles and explicit titles survive resizing, scale edits and dimension
reordering. Removed fields lose their recipes. An owner created by createParallelAxes
also creates defaults for newly encoded fields; one started by createParallelAxis
keeps new fields hidden. Explicitly removed field axes stay hidden while their field
remains encoded. Recreate missing components through createParallelAxis.
For individual lines, ticks, labels, and titles, see Advanced axis components.