Published-release documentation · release compatibility
Polar Lines and Radar Tutorial
Polar line marks use the same encodeTheta and encodeR actions as Polar
points. The line stays open by default; closed: true turns each grouped series
into a radar path.
Open Polar trends
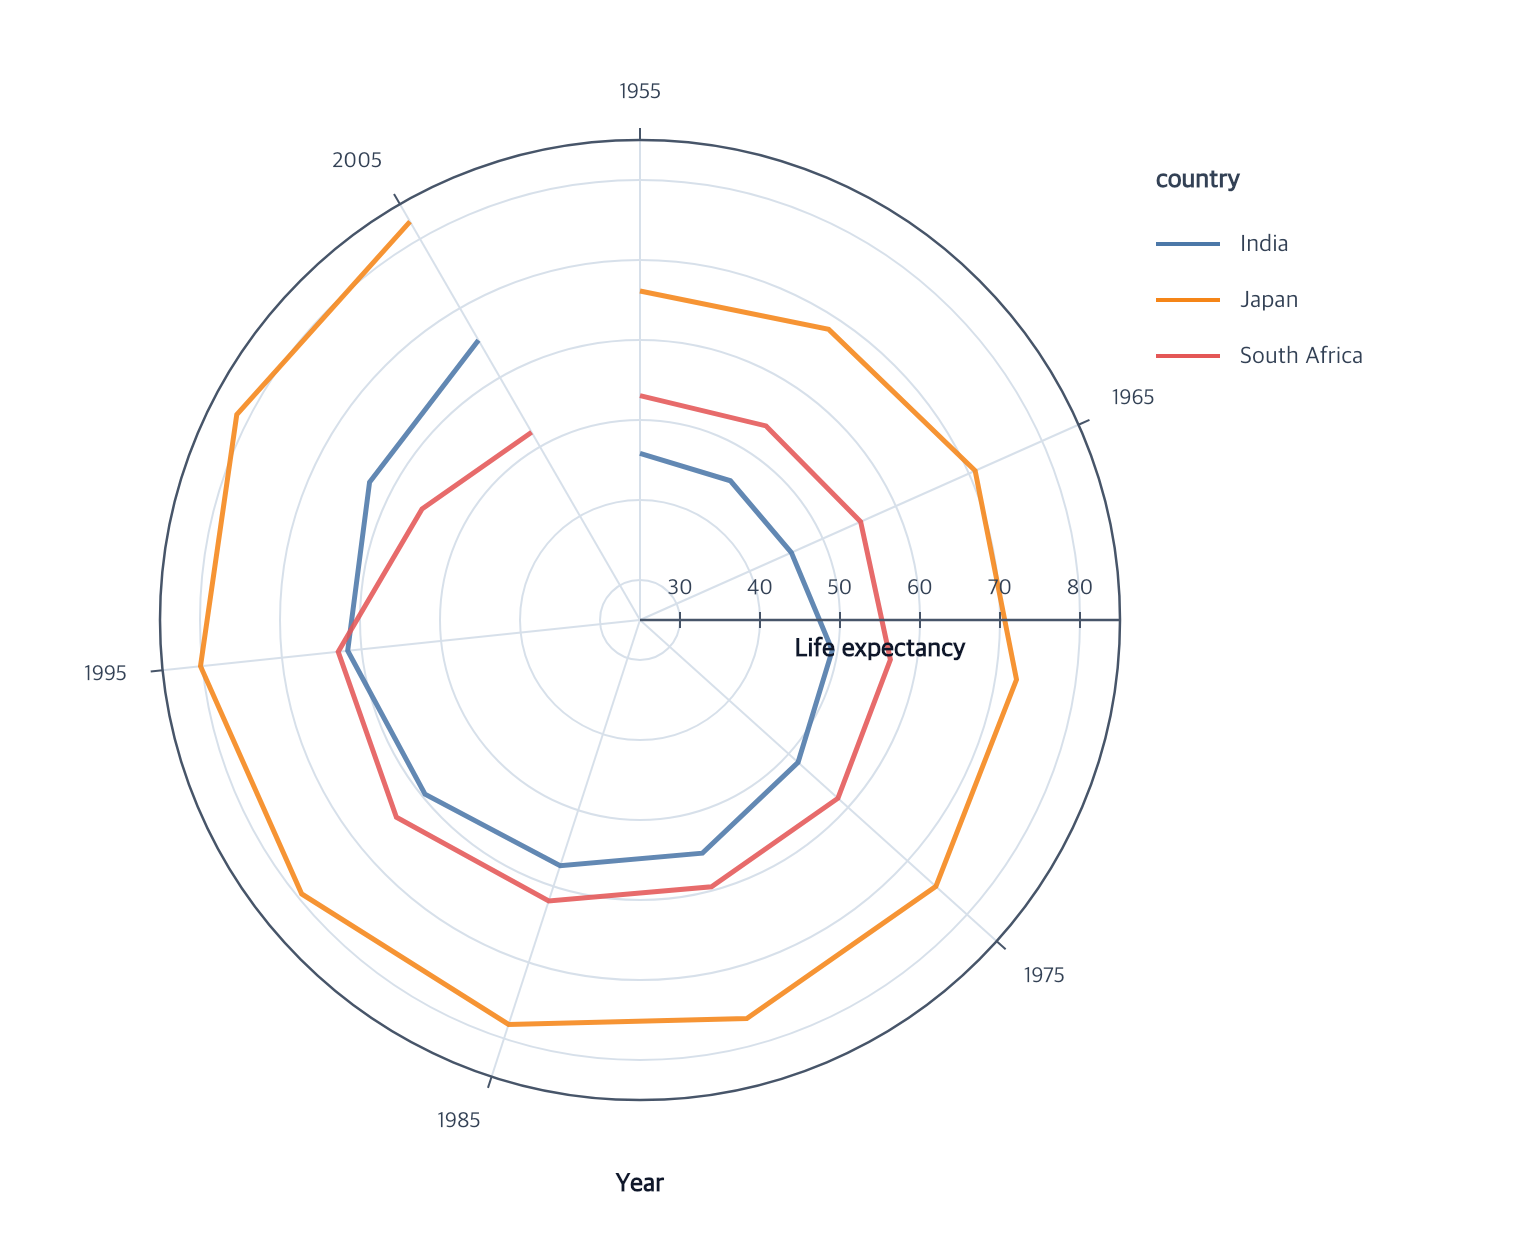
This chart orders years around a partial circle and maps life expectancy to radial distance.
Start with the Vite project from Getting Started, then place the tutorial dataset in Vite’s public directory:
mkdir -p public
curl --fail --location https://raw.githubusercontent.com/ggaction/ggaction/6422776b0a379c8c89809f41b434f366fbc1f143/data/gapminder.json --output public/gapminder.json
Complete program
import { chart, render } from "ggaction";

const response = await fetch("/gapminder.json");
if (!response.ok) throw new Error(`Failed to load gapminder data: ${response.status}`);
const gapminder = await response.json();
const countries = ["India", "Japan", "South Africa"];
const rows = gapminder.filter(row =>
  countries.includes(row.country) &&
  row.year >= 1955 && row.year <= 2005 &&
  Number.isFinite(row.life_expect)
);

const program = chart()
  .createCanvas({
    width: 760,
    height: 620,
    margin: { top: 70, right: 190, bottom: 70, left: 70 }
  })
  .createData({ values: rows })
  .createLineMark({ strokeWidth: 2.5, opacity: 0.88 })
  .encodeTheta({
    field: "year",
    scale: { domain: [1955, 2005], range: [0, 330] }
  })
  .encodeR({
    field: "life_expect",
    scale: { domain: [25, 85], zero: false }
  })
  .encodeGroup({ field: "country" })
  .encodeColor({ field: "country", palette: "tableau10" })
  .createGuides({
    axes: {
      theta: { title: { text: "Year" } },
      radius: { title: { text: "Life expectancy" } }
    },
    legend: { position: "right" }
  });

render(program, document.querySelector("canvas").getContext("2d"));
The theta and radius actions are order-independent. With only one of them, the program retains the semantic assignment but does not create a path. Grouping creates one path per country; color, dash, legends, filtering, selection, and highlighting all operate on those final series.
Closed radar paths
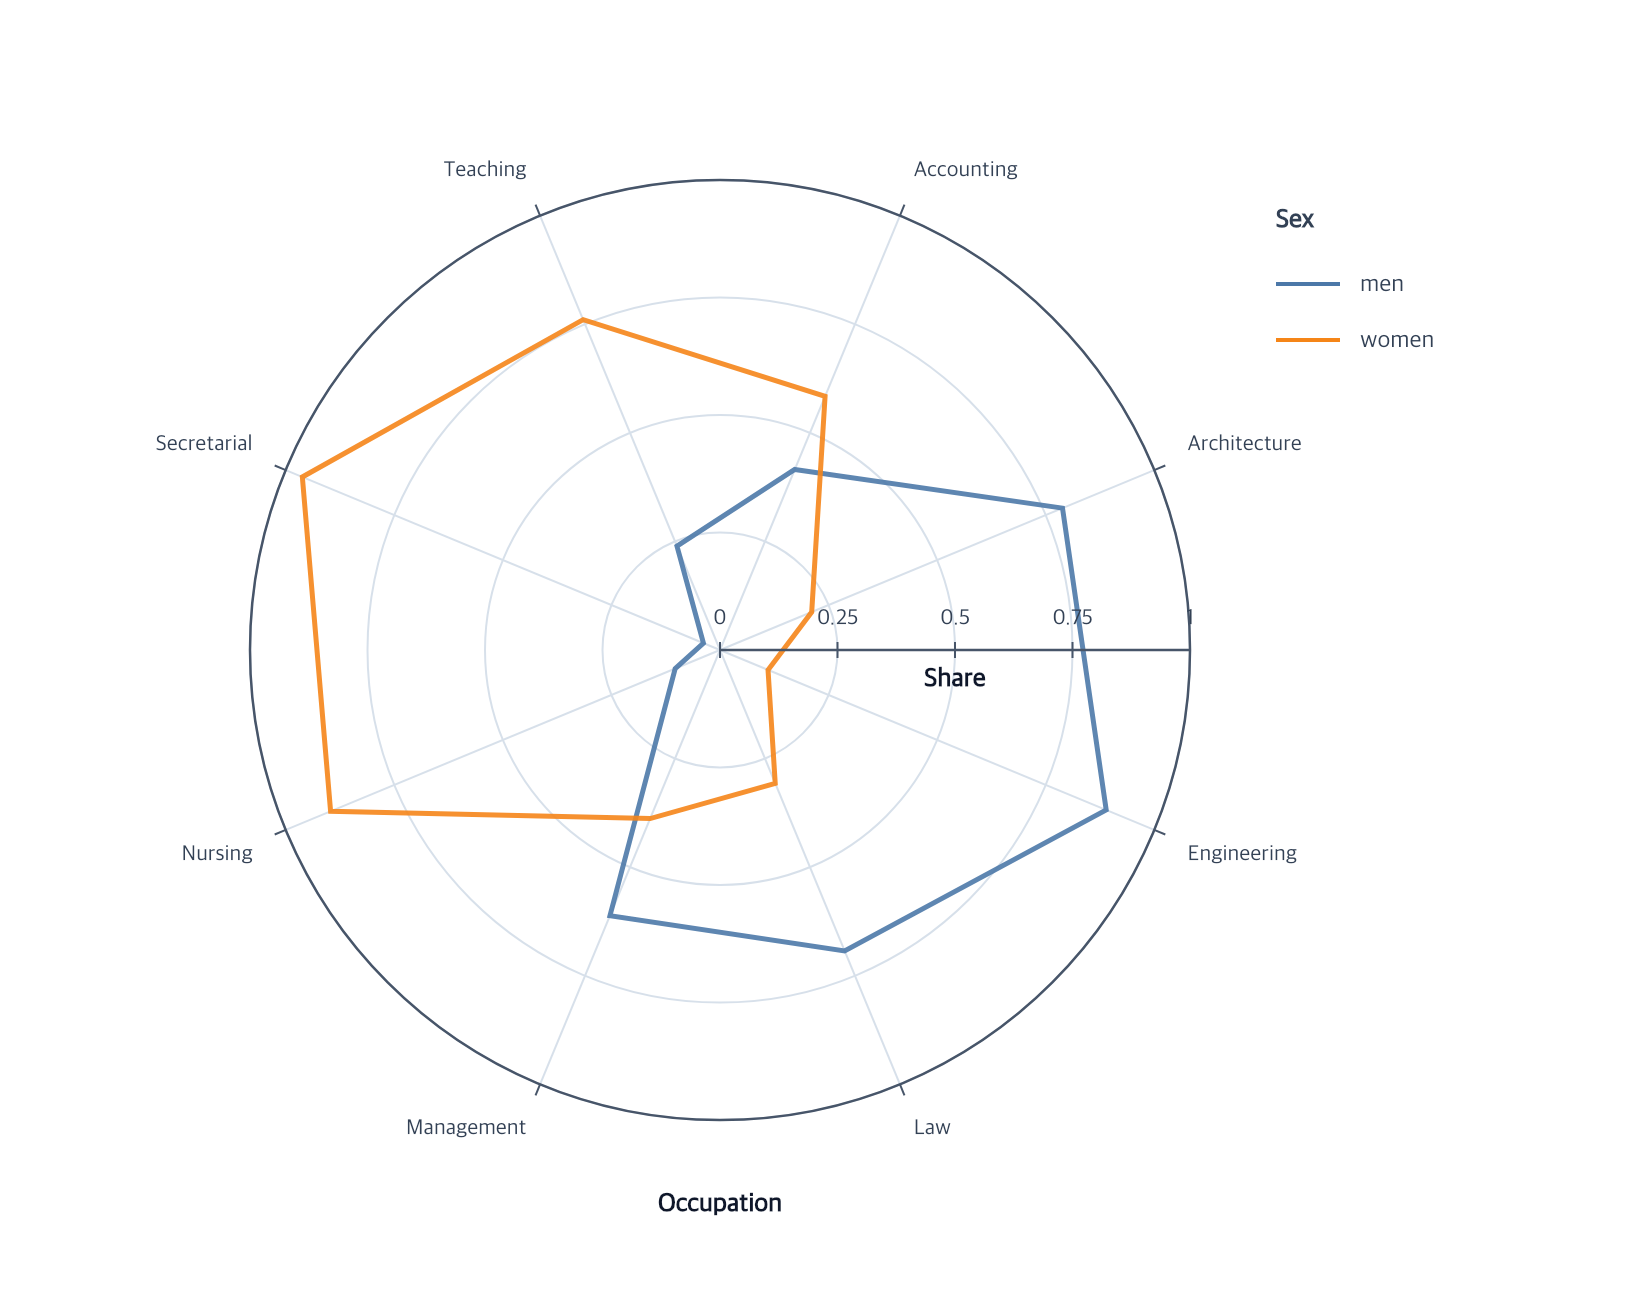
The radar chart uses nominal theta categories and normalized radial values:
const radar = chart()
  .createCanvas({
    width: 820,
    height: 650,
    margin: { top: 90, right: 190, bottom: 90, left: 90 }
  })
  .createData({ values: radarRows })
  .createLineMark({ closed: true, strokeWidth: 2.5, opacity: 0.9 })
  .encodeTheta({
    field: "role",
    fieldType: "nominal",
    scale: { domain: roleOrder }
  })
  .encodeR({ field: "share", scale: { domain: [0, 1], zero: true } })
  .encodeGroup({ field: "sex" })
  .encodeColor({ field: "sex", palette: "tableau10" })
  .createGuides({
    axes: {
      theta: { title: { text: "Occupation" } },
      radius: { title: { text: "Share" } }
    },
    legend: { position: "right", title: "Sex" }
  });
closed: true appends one backend-neutral Z command to each series. It does
not duplicate the first row. You can switch later with
editLineMark({ closed: false }). Polar lines currently support linear
interpolation only; Cartesian lines retain the complete curve vocabulary.
Related
Polar points · Line and area marks · Position encodings · Polar guides
Documentation provenance
293 actions · sha256:e755591a2e5f5e2b494867583876e28020a478c5220b77bdc6ad469a6224891d