Published-release documentation · release compatibility
Horizon Chart Tutorial
Complete Horizon facade
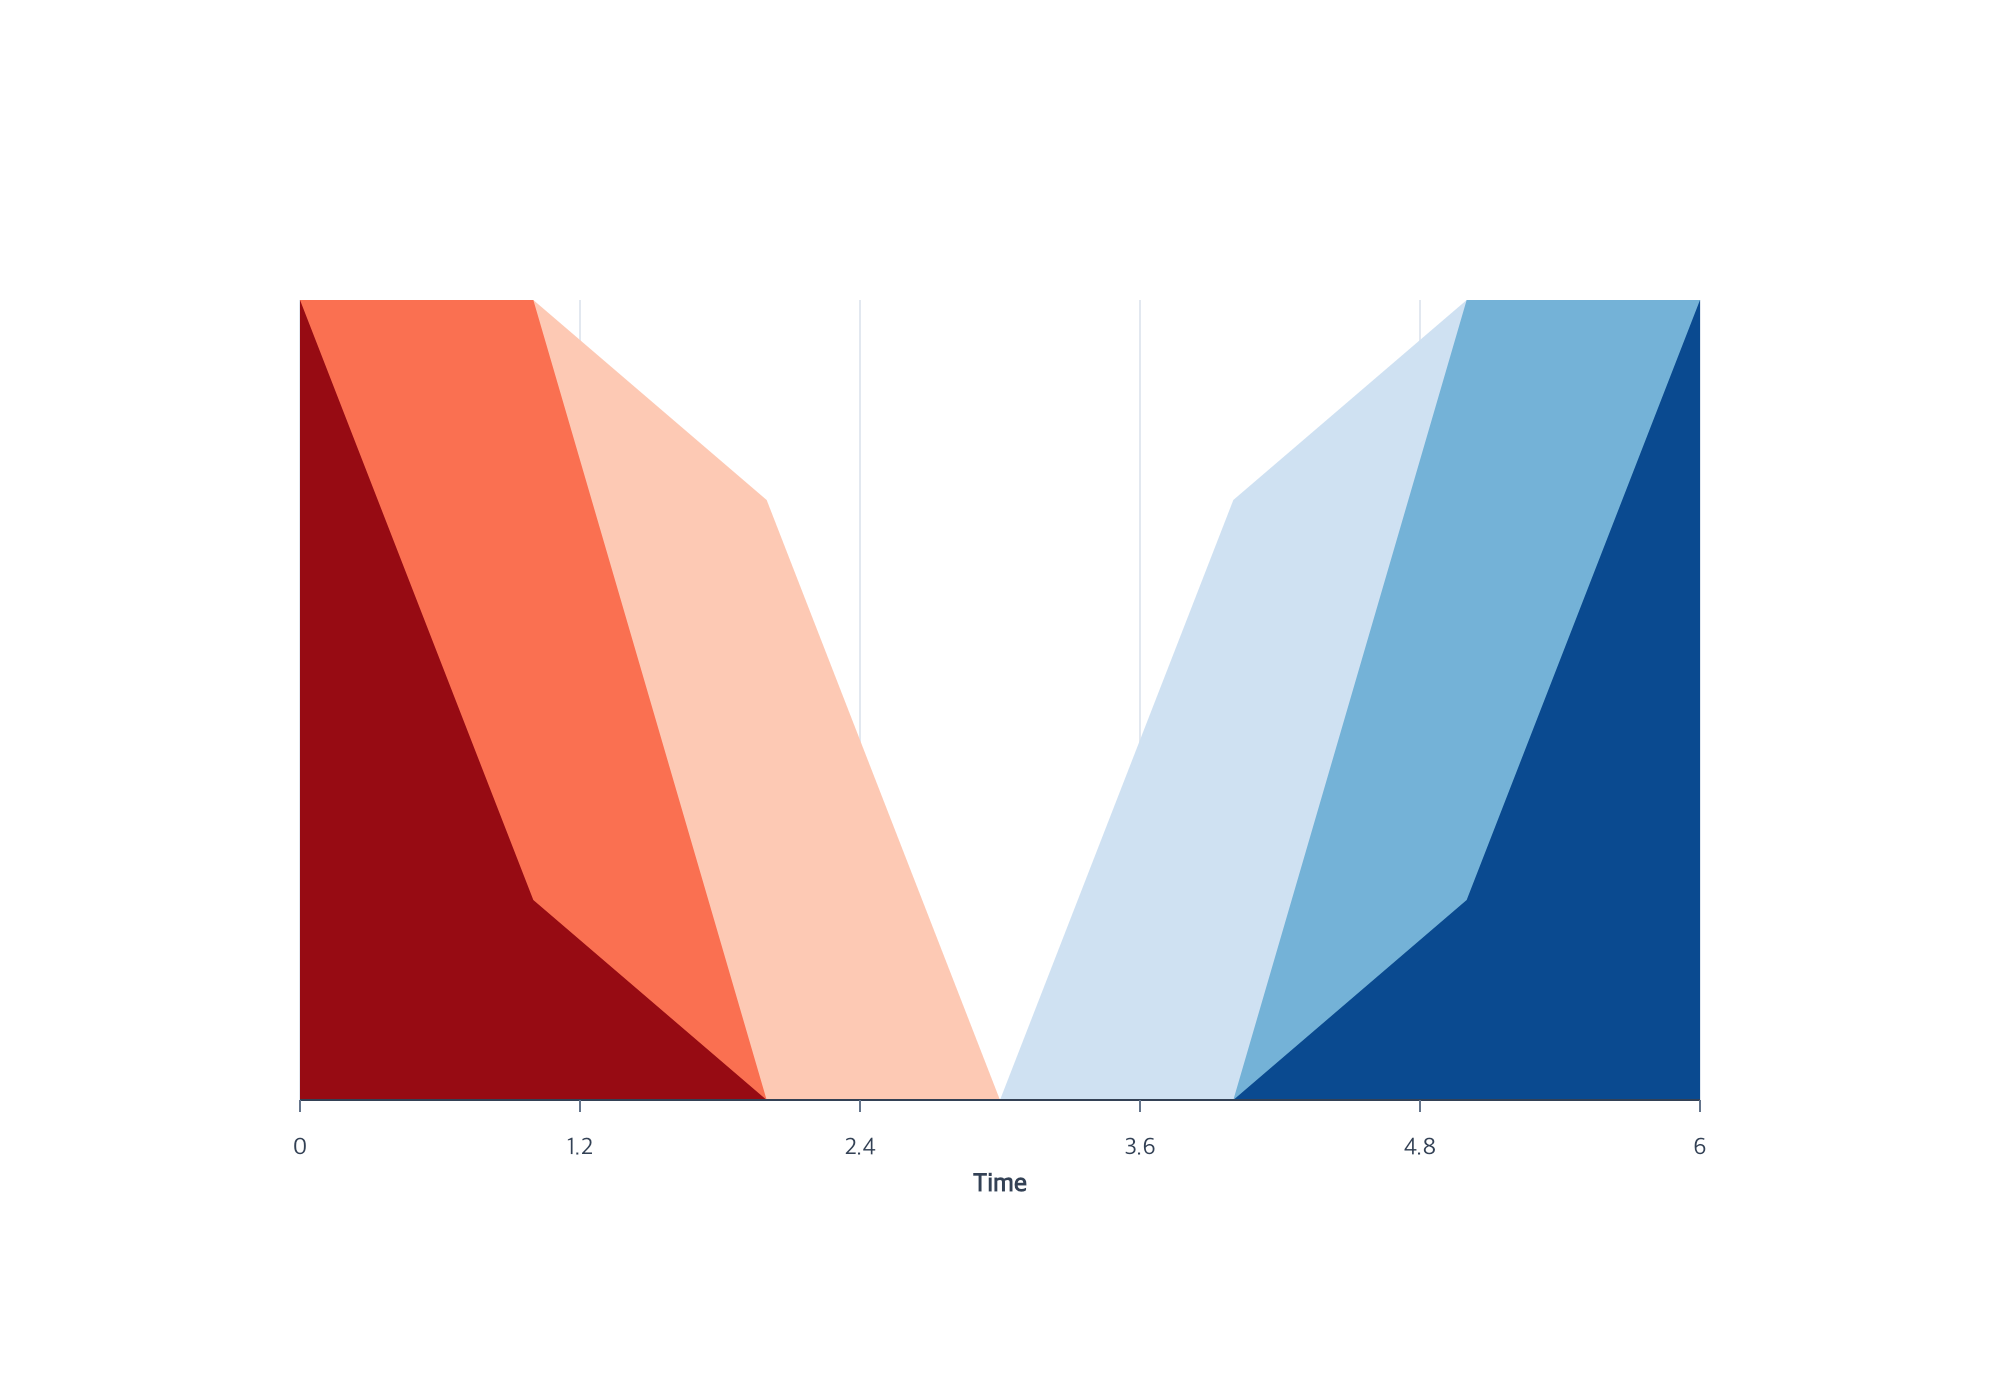
Use createHorizonPlot to author signed bands and the original x axis in one action:
import { chart } from "ggaction";

const program = chart()
  .createCanvas({ width: 1000, height: 700, margin: 150 })
  .createData({ id: "source", values: [
    { time: 0, value: -4 }, { time: 1, value: -3 }, { time: 2, value: -1 },
    { time: 3, value: 0 }, { time: 4, value: 1 }, { time: 5, value: 3 }, { time: 6, value: 4 }
  ] })
  .createHorizonPlot({ id: "horizon", x: "time", y: "value" });
X and y are explicit source roles. The defaults use three bands on either side of zero, an automatic
shared extent, blue for positive values, and red for negative values. Temporal x values accept the
existing temporalUnit option. The folded y scale is [0, 1]; the facade shows only the original x
axis and vertical grid. It does not infer an original-amplitude y axis or a legend from internal band keys.
Use editHorizon for bands, baseline, palette, or source revisions and editAreaMark for opacity,
stroke, and curve. An explicit area.opacity is applied after the encoding’s opaque default.
All-baseline input correctly produces no area paths while retaining the original x domain.
The runnable example includes signed, temporal, and baseline/style variants. The program below exposes the same lower owners on real data.
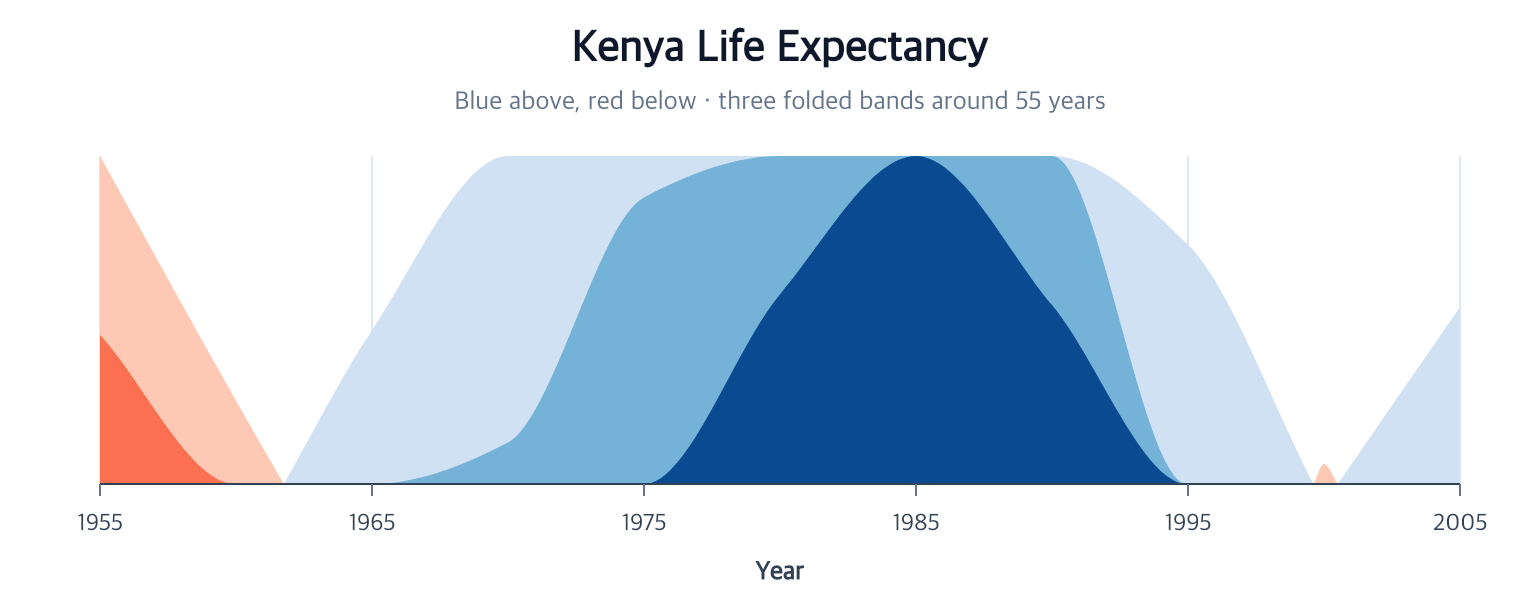
This chart folds Kenya’s life expectancy above and below a 55-year baseline
into three compact bands. The source rows stay immutable. encodeHorizon
creates one derived dataset and ordinary closed area paths, so Browser Canvas
and the SVG, PNG, and PDF outputs use the same backend-neutral graphics.
The repository contains a runnable browser example and its complete program.
Complete program
import { chart, render } from "ggaction";

const response = await fetch("/gapminder.json");
if (!response.ok) throw new Error(`Failed to load data: ${response.status}`);
const gapminder = await response.json();

const program = chart()
  .createCanvas({
    width: 760,
    height: 300,
    margin: { top: 78, right: 30, bottom: 58, left: 50 }
  })
  .createData({ values: gapminder })
  .filterData({ id: "kenya", field: "country", oneOf: ["Kenya"] })
  .createAreaMark({ curve: "monotone" })
  .encodeHorizon({
    x: "year",
    y: "life_expect",
    bands: 3,
    baseline: 55,
    palette: { positive: "blues", negative: "reds" }
  })
  .createGuides({ axes: { y: false } })
  .createTitle({
    text: "Kenya Life Expectancy",
    subtitle: "Blue above, red below · three folded bands around 55 years"
  });

render(program, document.querySelector("#chart").getContext("2d"));
What the atomic encoding owns
| Decision | Result |
|---|---|
baseline: 55 |
Values are represented as signed deviations from 55 |
bands: 3 |
Each sign is divided into three equal-amplitude folds |
extent: "auto" |
The largest absolute deviation defines the shared band height |
missing: "break" |
Missing y values split, rather than bridge, a path |
overflow: "clip" |
An explicit smaller extent clips excess amplitude |
The folded y scale is always [0, 1]. Because its ticks would describe folded
amplitude rather than the original life-expectancy values, Horizon guide policy
creates only the original x axis and grid and no automatic legend.
Revise without mutation
const revised = program.editHorizon({
  bands: 4,
  baseline: 58,
  palette: { positive: "teals" }
});
The revision keeps the source dataset and scale IDs, creates a new namespaced
derived dataset, rebinds the same area layer, and removes the old revision only
when no layer still references it. The earlier program remains unchanged.
Key action trace
program
├─ createAreaMark
├─ encodeHorizon
│  ├─ createHorizonData
│  │  └─ materializeHorizonData
│  ├─ rebindLayerData
│  ├─ encodeX
│  ├─ encodeY
│  ├─ encodeGroup
│  ├─ encodeY2
│  └─ encodeColor
├─ createGuides
└─ createTitle
Continue with Encodings, Area marks, and Faceting.
Documentation provenance
293 actions · sha256:e755591a2e5f5e2b494867583876e28020a478c5220b77bdc6ad469a6224891d