Published-release documentation · 281 actions; release compatibility · contract 5520b0fa9525
Compare weighted distributions
Compare three different summaries of the same weighted observations without treating their vertical units as interchangeable.
Prerequisites
Use the Getting Started browser module setup, install the full
ggaction entry, and provide <canvas id="chart"></canvas>. This complete example
includes its data and imports. These APIs require ggaction 0.0.15 or later;
check the documentation version for release compatibility.
Decision sequence: histogram, density, and ECDF facades → weighted transforms.
Complete program
import { chart, hconcat } from "ggaction";
import { render } from "ggaction";

export function createWeightedDistributionsWorkflow() {
  const base = chart()
    .createCanvas({ width: 360, height: 300, margin: 65 })
    .createData({ id: "observations", values: [
      { value: 1, weight: 1 }, { value: 2, weight: 3 }, { value: 4, weight: 2 }
    ] });
  const histogram = base.createHistogram({ field: "value", binBoundaries: [0, 2, 3, 5],
    weight: { field: "weight", kind: "frequency" } })
    .createTitle({ text: "Histogram: mass 1, 3, 2" });
  const density = base.createDensityPlot({ field: "value", bandwidth: 0.5,
    extent: [-1, 6], steps: 80, normalization: "unit",
    weight: { field: "weight", kind: "frequency" } })
    .createTitle({ text: "KDE: density per value unit" });
  const ecdf = base.createECDFPlot({ field: "value", weight: "weight" })
    .editXAxisTitle({ text: "Value" })
    .editYAxisTitle({ text: "Cumulative probability" })
    .createTitle({ text: "ECDF: cumulative probability" });
  return hconcat({ programs: [histogram, density, ecdf], gap: 20 });
}

const program = createWeightedDistributionsWorkflow();
render(program, document.querySelector("#chart").getContext("2d"));
Expected result
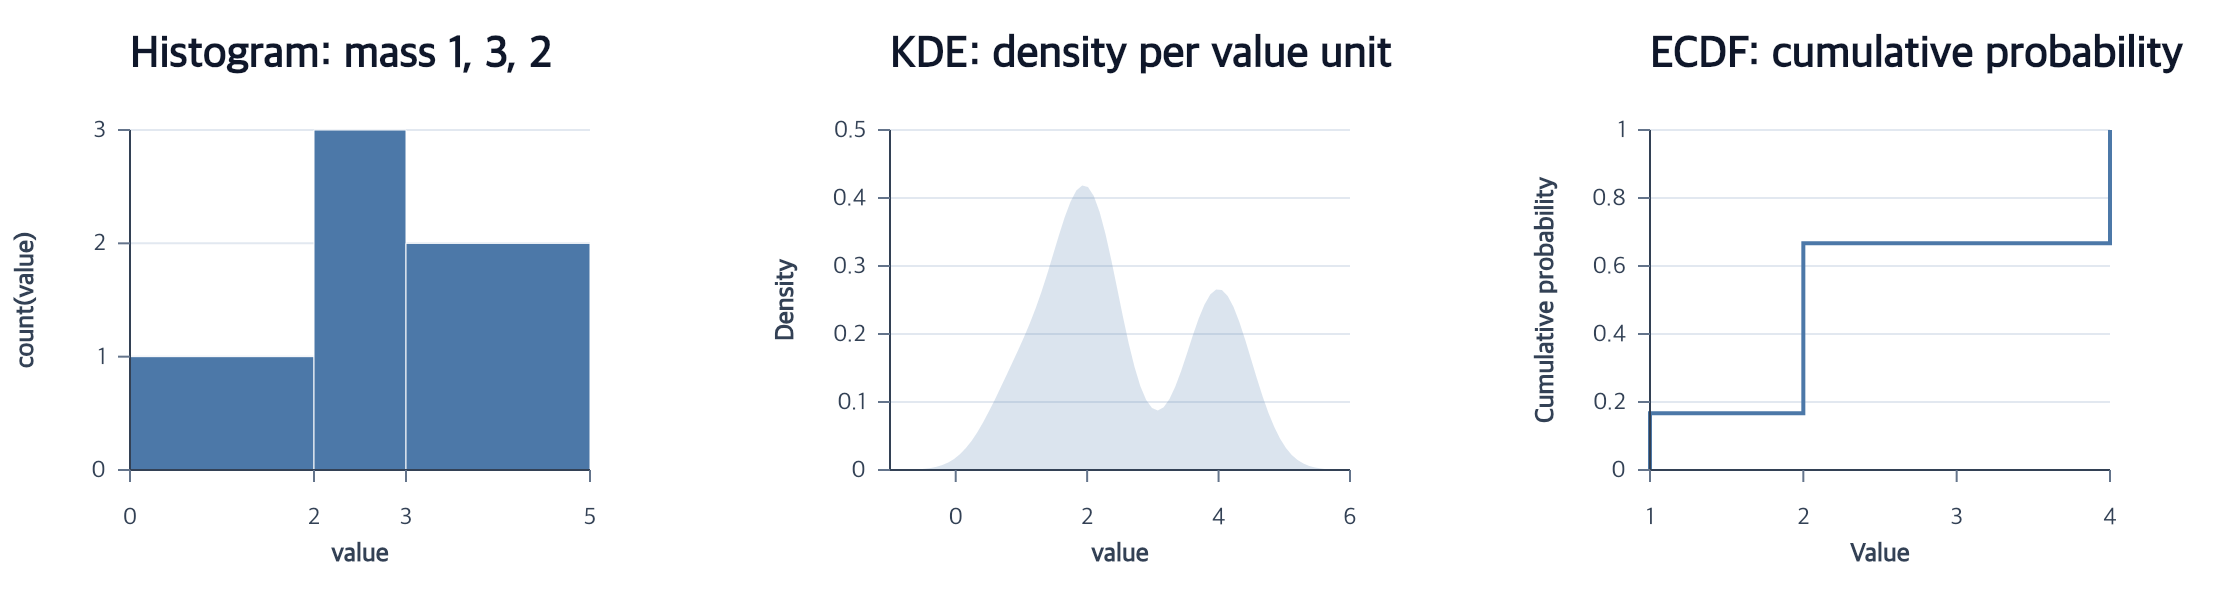
Weights [1,3,2] have total mass 6. Histogram intervals [0,2), [2,3), and [3,5] contain mass [1,3,2]. ECDF probabilities at values [1,2,4] are [1/6,4/6,1]. KDE shows a continuous density in inverse value units, evaluated on a finite grid.
Boundaries and failure behavior
Histogram and KDE use { field, kind: "frequency" }; ECDF takes the weight field name directly. These are different contracts. Frequency weights must be non-negative safe integers; zero weights do not contribute mass. KDE normalization: "unit" describes the full kernel density; the sampled finite extent need not integrate to exactly one. Enlarging the extent displays more tails; it does not change the total input weight.
Related
Authoring conventions · Data policies · Complete action reference