Published-release documentation · release compatibility
Parallel Coordinates Recipe
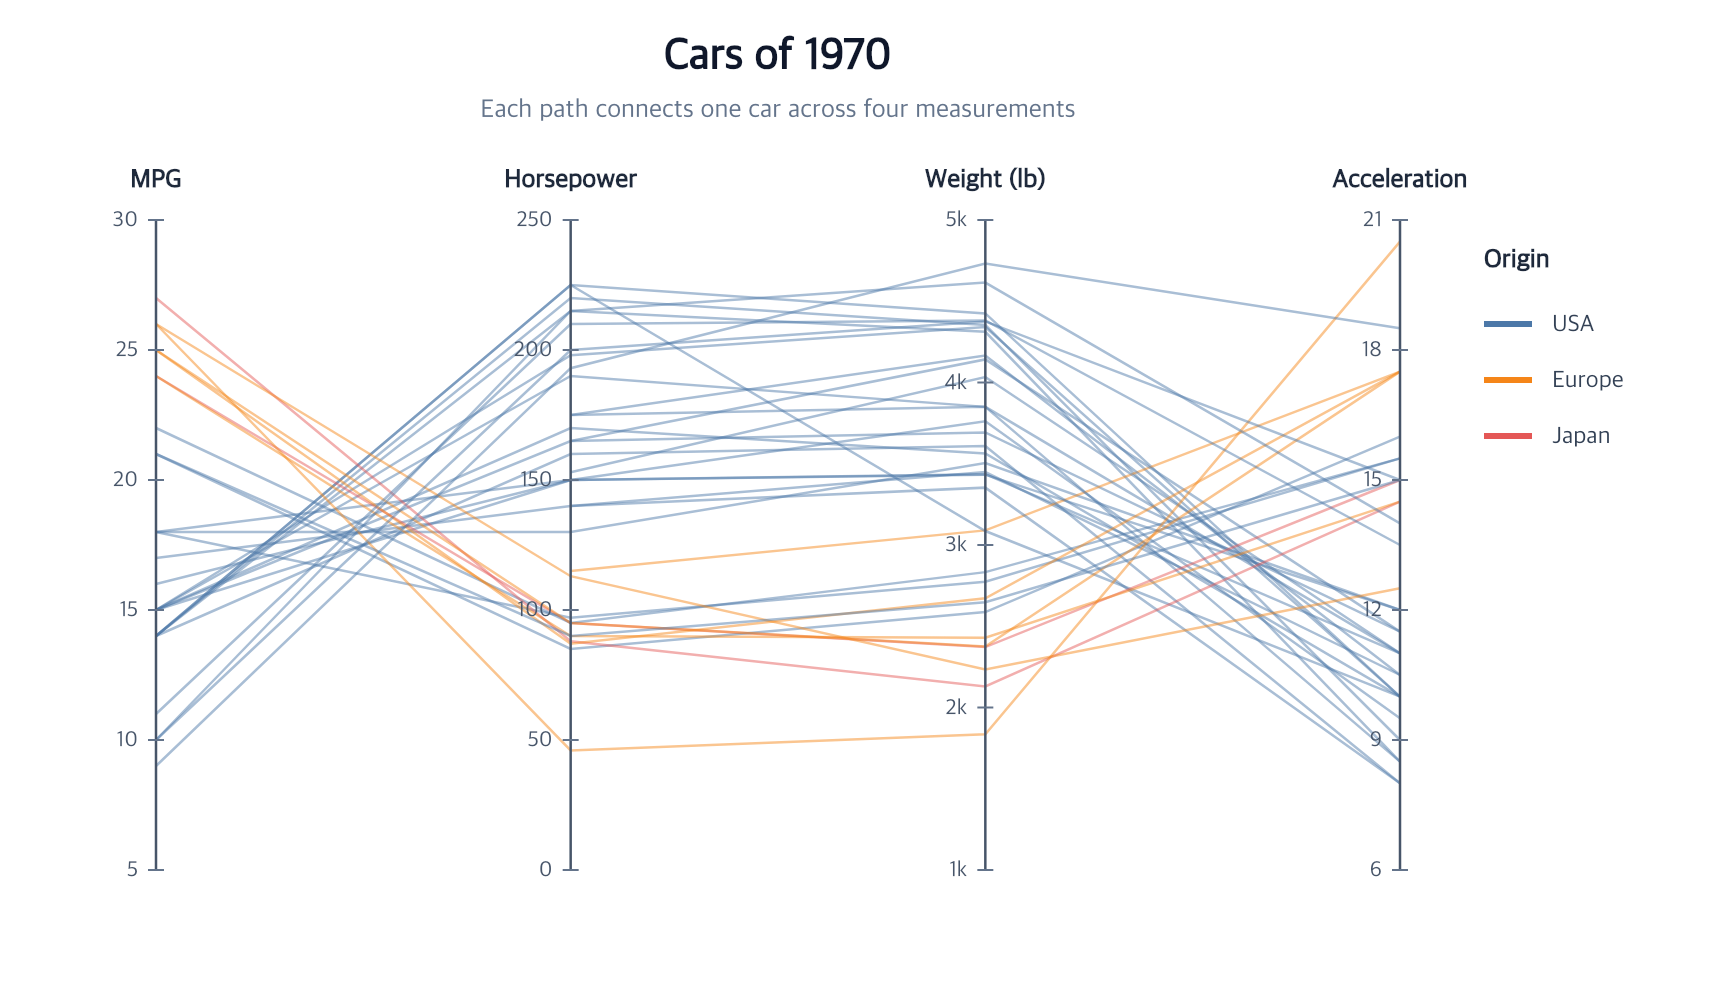
Minimal flow
Runnable: install ggaction and provide the named data array as plain row objects.
import { chart } from "ggaction";

const program = chart()
  .createCanvas({ margin: { top: 80, right: 140, bottom: 60, left: 70 } })
  .createData({ values: cars })
  .createParallelCoordinates({
    dimensions: [
      "Miles_per_Gallon",
      "Horsepower",
      "Weight_in_lbs",
      "Acceleration"
    ],
    color: "Origin"
  });
cars is an array of plain row objects. Every eligible row becomes one open
path across the ordered dimensions.
You must decide
- At least two unique dimension fields in axis order
- An optional unique row key
- Whether missing values break a path, drop the row, or raise an error
The library infers
- One Parallel coordinate and one local scale per dimension
- Quantitative or ordinal dimension types from unambiguous values
- Dimension axes and an applicable categorical legend
Continue
Parallel Coordinates API · Series encodings
Documentation provenance
293 actions · sha256:e755591a2e5f5e2b494867583876e28020a478c5220b77bdc6ad469a6224891d