Published-release documentation · release compatibility
Path Ordering Recipe
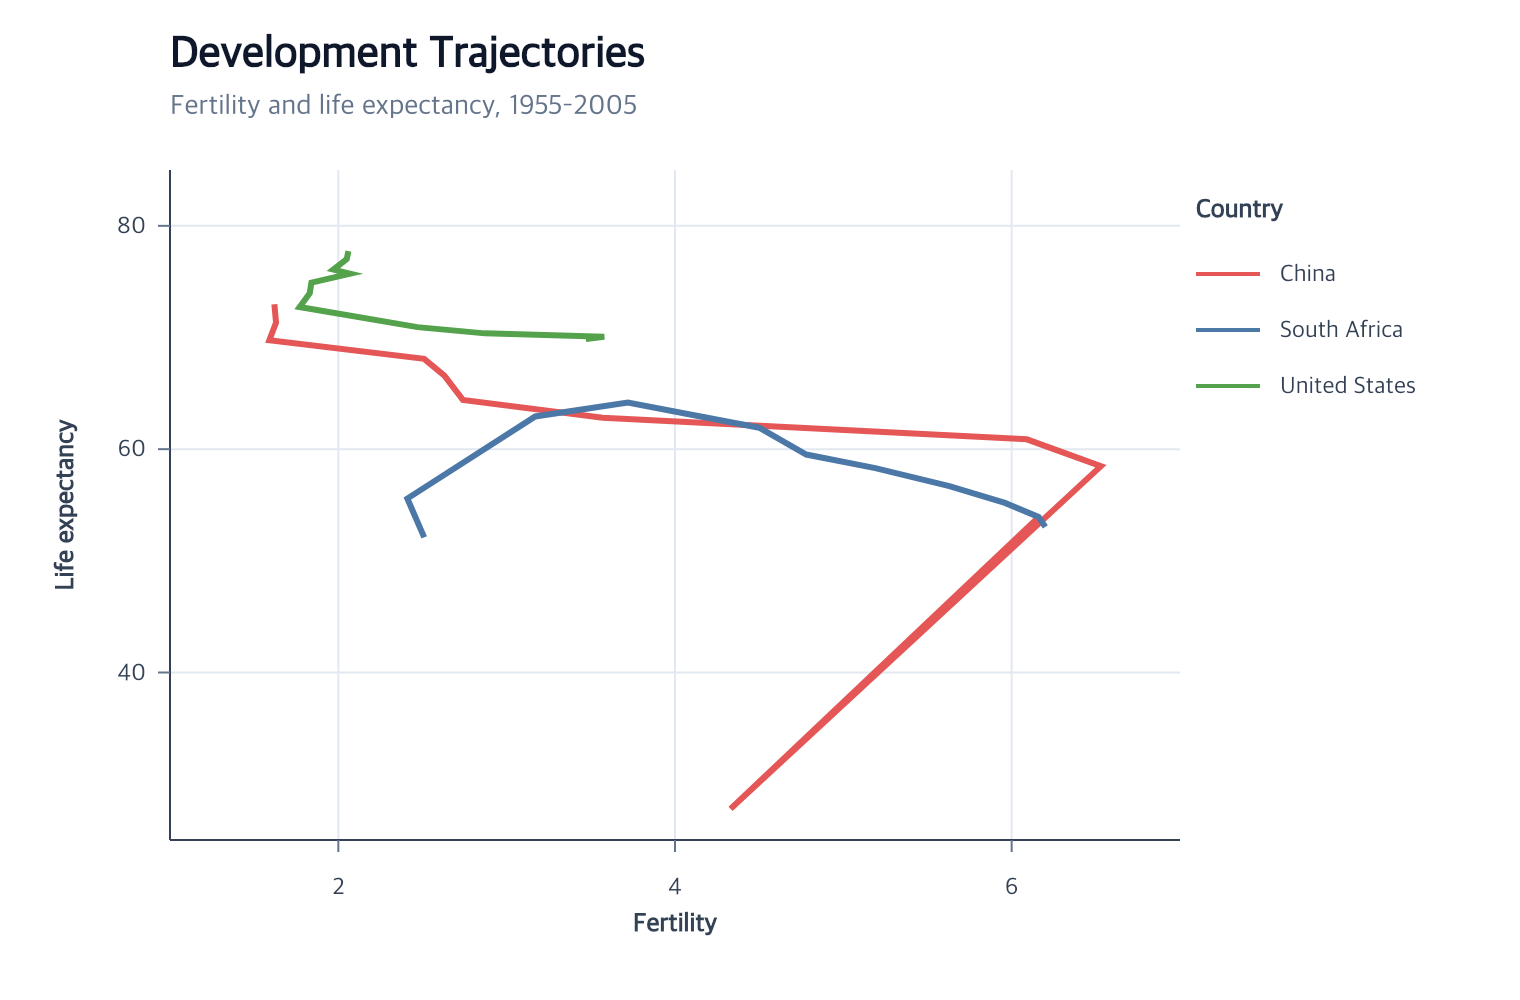
Minimal flow
Runnable: install ggaction and provide the named data array as plain row objects.
import { chart } from "ggaction";

const program = chart()
  .createCanvas({ margin: { top: 60, right: 180, bottom: 70, left: 70 } })
  .createData({ values: observations })
  .createLineMark()
  .encodeX({ field: "fertility" })
  .encodeY({ field: "life_expect" })
  .encodeColor({ field: "country" })
  .encodePathOrder({ field: "year", order: "ascending" })
  .createGuides();
observations is an array of plain row objects. Source rows may be shuffled;
the order field controls vertices independently inside each color/group series.
Each row has finite fertility, life_expect, and year, plus a non-empty
country. Provide several years per country. The explicit right margin is
for the country legend; longer names may require a wider margin.
You must decide
- The quantitative order field
- Ascending or descending order
- A color or group field when rows form multiple paths
The library infers
- The current compatible Cartesian line
- Stable source order as the tie breaker
- No extra scale or guide for the topology-only field
Use removePathOrder() to return to the line’s automatic topology.
Continue
Series Encodings · Line-chart recipe
Documentation provenance
293 actions · sha256:e755591a2e5f5e2b494867583876e28020a478c5220b77bdc6ad469a6224891d