Published-release documentation · release compatibility
Parallel Coordinates
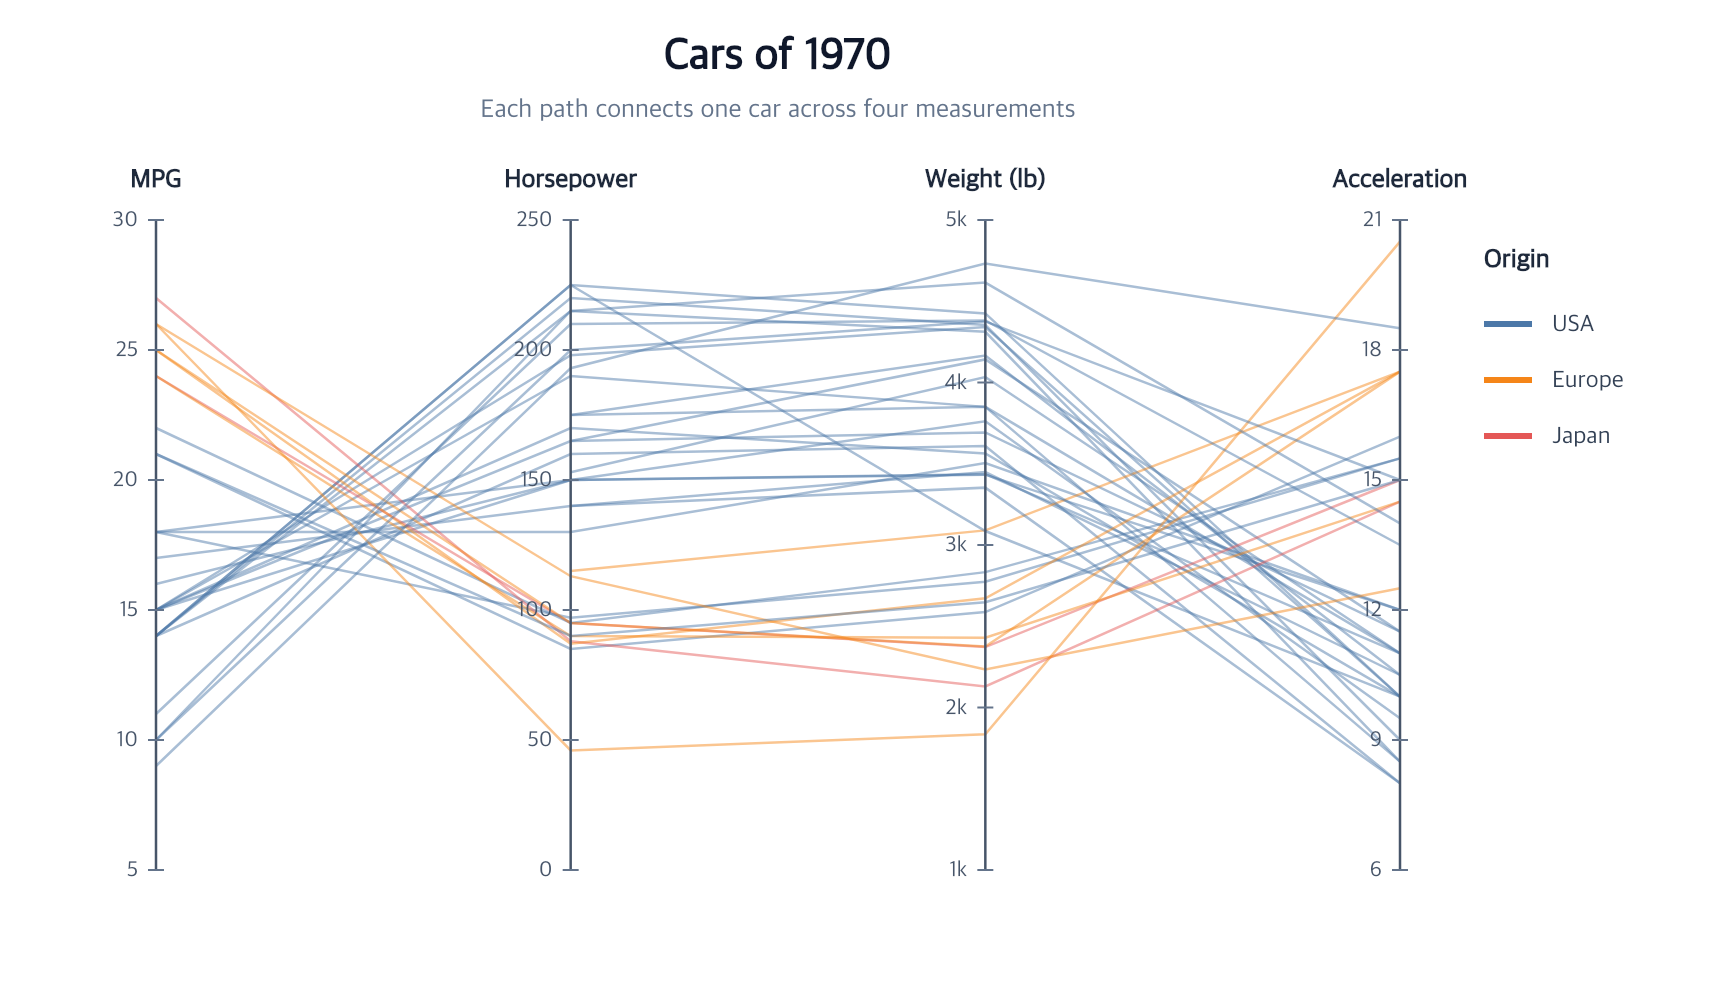
Use Parallel coordinates when each row should remain visible while several measurements are compared. Every eligible source row becomes one selectable open path. Every dimension owns a local scale and ordinary line/text axis.
Complete chart action
createParallelCoordinates({
  id?, data?, coordinate?, dimensions, key?, missing?,
  color?, strokeDash?, line?, guides?
}): ChartProgram
Only dimensions is required after a Canvas and an unambiguous dataset exist.
Contextual fragment. Use an ES module with the imports, data, and prepared resource state described in this section. Resolve these names from setup in this fragment or section; alternatives branch from the same base.
import { chart } from "ggaction";

const program = chart()
  .createCanvas({
    width: 860,
    height: 500,
    margin: { top: 110, right: 160, bottom: 65, left: 78 }
  })
  .createData({ values: cars })
  .filterData({
    id: "cars1970",
    field: "Year",
    oneOf: ["1970-01-01"]
  })
  .createParallelCoordinates({
    dimensions: [
      { field: "Miles_per_Gallon", title: "MPG", scale: { nice: true, zero: false } },
      { field: "Horsepower", scale: { nice: true, zero: false } },
      { field: "Weight_in_lbs", title: "Weight (lb)", scale: { nice: true, zero: false } },
      { field: "Acceleration", scale: { nice: true, zero: false } }
    ],
    key: "Name",
    color: {
      field: "Origin",
      fieldType: "nominal",
      scale: { palette: "tableau10" }
    },
    line: { strokeWidth: 1.25, opacity: 0.48 }
  });
The stable mark ID is parallelCoordinates; the coordinate ID is parallel.
Pass explicit IDs only when those roles are already occupied or several
compatible resources make inference ambiguous.
Dimensions
A dimension is a field string or an object:
type ParallelDimension = string | {
  field: string;
  fieldType?: "quantitative" | "ordinal";
  title?: string;
  scale?: Omit<ScaleOptions, "id">;
};
- At least two unique fields are required, and array order is axis order.
- Finite numeric values infer
quantitative; consistent strings inferordinal. Declare numeric categories asordinalexplicitly. titledefaults to the field name.- Scale IDs are namespaced from the mark and dimension position. Supply scale
behavior such as
type,domain,range,nice,zero, orreverse, not anotherid.
Row identity and missing values
key names a dataset field whose values must be present and unique. It is
optional: omission uses stable source-row lineage and never guesses a field.
missing |
Result |
|---|---|
"break" |
Default. Keep the row item and draw each valid multi-point fragment. |
"drop-row" |
Remove any row with an invalid dimension value. |
"error" |
Reject the action before changing the program. |
Advanced encoding
Use the atomic encoding after creating a line mark when the wrapped steps need to remain individually controllable:
Contextual fragment. Use an ES module with the imports, data, and prepared resource state described in this section. Resource selectors used here:
target: "profiles". Resolve these names from setup in this fragment or section; alternatives branch from the same base.
const advanced = chart()
  .createCanvas()
  .createData({ values })
  .createLineMark({ id: "profiles" })
  .encodeParallelCoordinates({
    target: "profiles",
    dimensions: ["first", "second", "third"]
  })
  .createGuides();
encodeParallelCoordinates replaces the complete ordered assignment
atomically. It cannot mix with x/y or theta/radius position encodings on the
same layer.
Reordering, adding, or removing dimensions also refreshes existing axis titles,
ticks, labels, and positions in the same action. Axes omitted with
guides: false stay absent. Axes owned by another independent Parallel layer
keep their own dimension assignment.
Edit one dimension scale
Use editParallelScale when the dimension field should stay in place and only
its scale definition should change. Both selectors are explicit: target is
the Parallel line layer and dimension is the exact stored field name.
Contextual fragment. Use an ES module with the imports, data, and prepared resource state described in this section. Caller-provided receivers:
program. Resource selectors used here:target: "parallelLines". Resolve these names from setup in this fragment or section; alternatives branch from the same base.
const revised = program.editParallelScale({
  target: "parallelLines",
  dimension: "Horsepower",
  domain: [0, 300],
  reverse: true
});
The action resolves the dimension’s nested scale and applies the same atomic
validation as editScale. It refreshes every consumer of a shared scale and
the matching paths and dimension axes. Reordering dimensions does not change
field selection. Titles, display labels, and numeric positions are not valid
dimension selectors. Quantitative and ordinal dimensions retain their
respective continuous or point-scale option vocabularies, and an empty patch
is an error.
Appearance, guides, and revisions
colorandstrokeDashreuse the line-series encoding vocabulary.lineaccepts open linear-line appearance:stroke,strokeWidth, andopacity. Curved and closed paths are rejected.- Omitted guides create dimension axes and any applicable legend. Use
guides: falseto omit all guides. editCanvas,editParallelScale, data revisions, andfilterMarksrematerialize paths, axes, and legends together.selectMarks,highlightMarks, andfilterMarksoperate at source-row grain. Text is not attached automatically because a path has no unique text anchor.
Limitations
Temporal dimensions, curved paths, path bundling, interactive brushing,
drag-to-reorder axes, outer shared Parallel axes, and automatic scale sharing
across unrelated composed child programs are not implemented. facet and
facetGrid repeat a Parallel chart by source fields with shared or independent
per-dimension domains. repeatCharts({ channel: { parallelDimension: field },
fields }) replaces exactly one stored dimension role.
Edit a dimension axis
Use editParallelAxis({ field, line?, ticks?, labels?, ticksAndLabels?, title? })
to style or remove existing field components. For example, on an existing
Parallel program, program.editParallelAxis({ field: "Horsepower", title: { text: "Engine power" } })
preserves the other dimensions. Create missing components with createParallelAxis,
remove a field with removeParallelAxis, or remove the complete guide with
removeParallelAxes. See Parallel axis lifecycle for exact options,
defaults, restoration and dimension-reordering behavior.
Related
Basic Charts · Coordinates · Series encodings · Selection and Highlighting
Documentation provenance
293 actions · sha256:e755591a2e5f5e2b494867583876e28020a478c5220b77bdc6ad469a6224891d