Published-release documentation · 281 actions; release compatibility · contract 5520b0fa9525
Edit scales and refresh guides
Change an existing positional mapping and keep its visible ticks aligned with the rematerialized marks.
Prerequisites
Use the Getting Started browser module setup, install the full
ggaction entry, and provide <canvas id="chart"></canvas>. This complete example
includes its data and imports. These APIs require ggaction 0.0.15 or later;
check the documentation version for release compatibility.
Decision sequence: scatterplot → scale editors and axis editors.
Complete program
import { chart, hconcat } from "ggaction";
import { render } from "ggaction";

export function createScaleGuidesWorkflow() {
  const before = chart()
    .createCanvas({ width: 440, height: 320, margin: 75 })
    .createData({ values: [{ x: 1, y: 2 }, { x: 10, y: 6 }, { x: 100, y: 4 }] })
    .createScatterPlot({ id: "points", x: { field: "x", scale: { domain: [1, 100], nice: false } }, y: "y" });
  const after = before
    .editXScale({ target: "points", type: "log", domain: [1, 100], nice: false })
    .editXAxis({ ticksAndLabels: { values: [1, 10, 100], labels: { format: ".0f" } } });
  return hconcat({ programs: [
    before.createTitle({ text: "Linear position" }),
    after.createTitle({ text: "Log position, refreshed axis" })
  ], gap: 20 });
}

const program = createScaleGuidesWorkflow();
render(program, document.querySelector("#chart").getContext("2d"));
Expected result
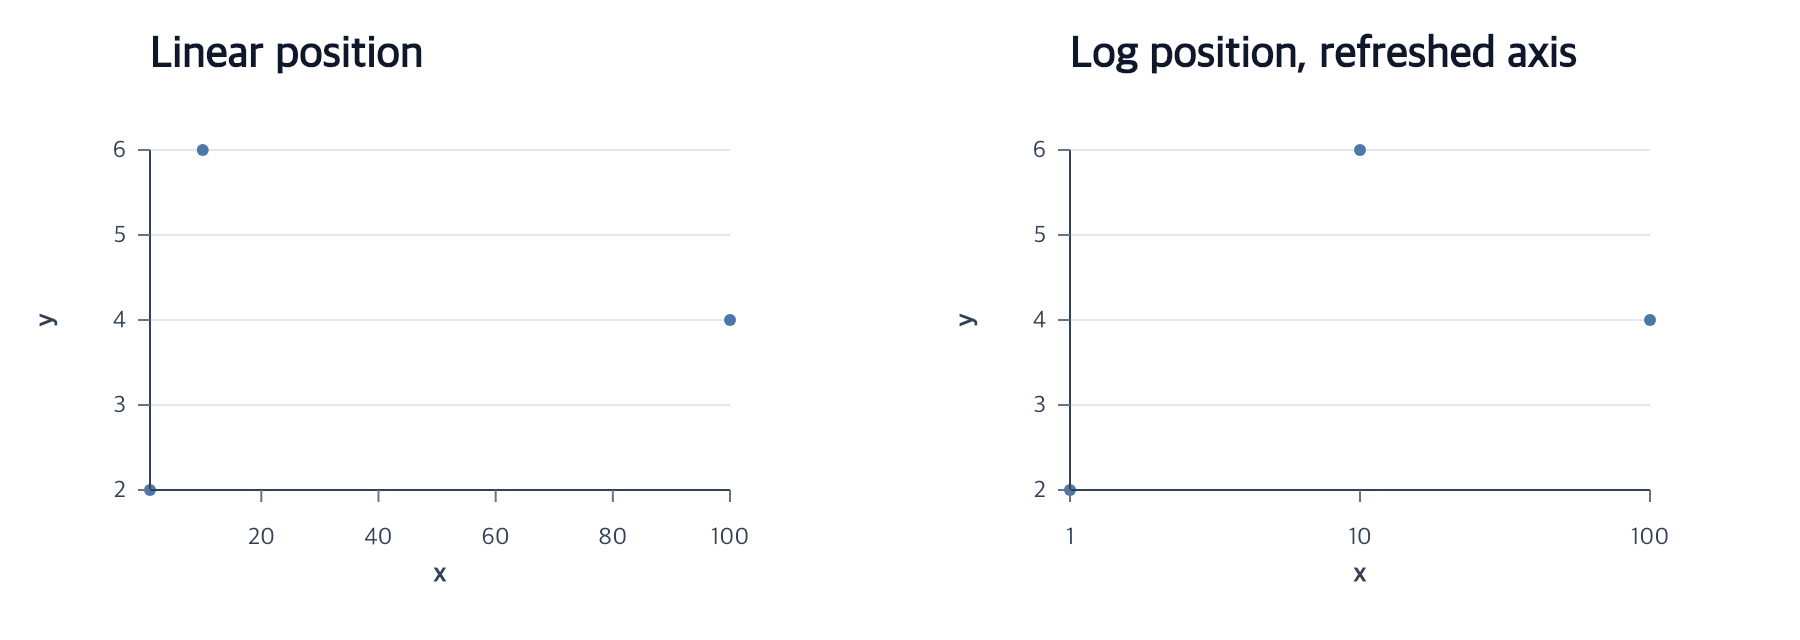
Linear x places 1, 10, and 100 at unequal gaps. Log x places them at equal gaps. The right panel labels exactly 1, 10, and 100 on the same final scale used by its points.
Boundaries and failure behavior
A log domain and every mapped value must be positive. editXScale refreshes existing consumers and guides; the following editXAxis chooses explicit ticks and formatting rather than creating a second axis. Supplying both count and values is invalid. Canvas margins must already hold the final guides.
Related
Authoring conventions · Data policies · Complete action reference