Published-release documentation · release compatibility
Line Chart Recipe
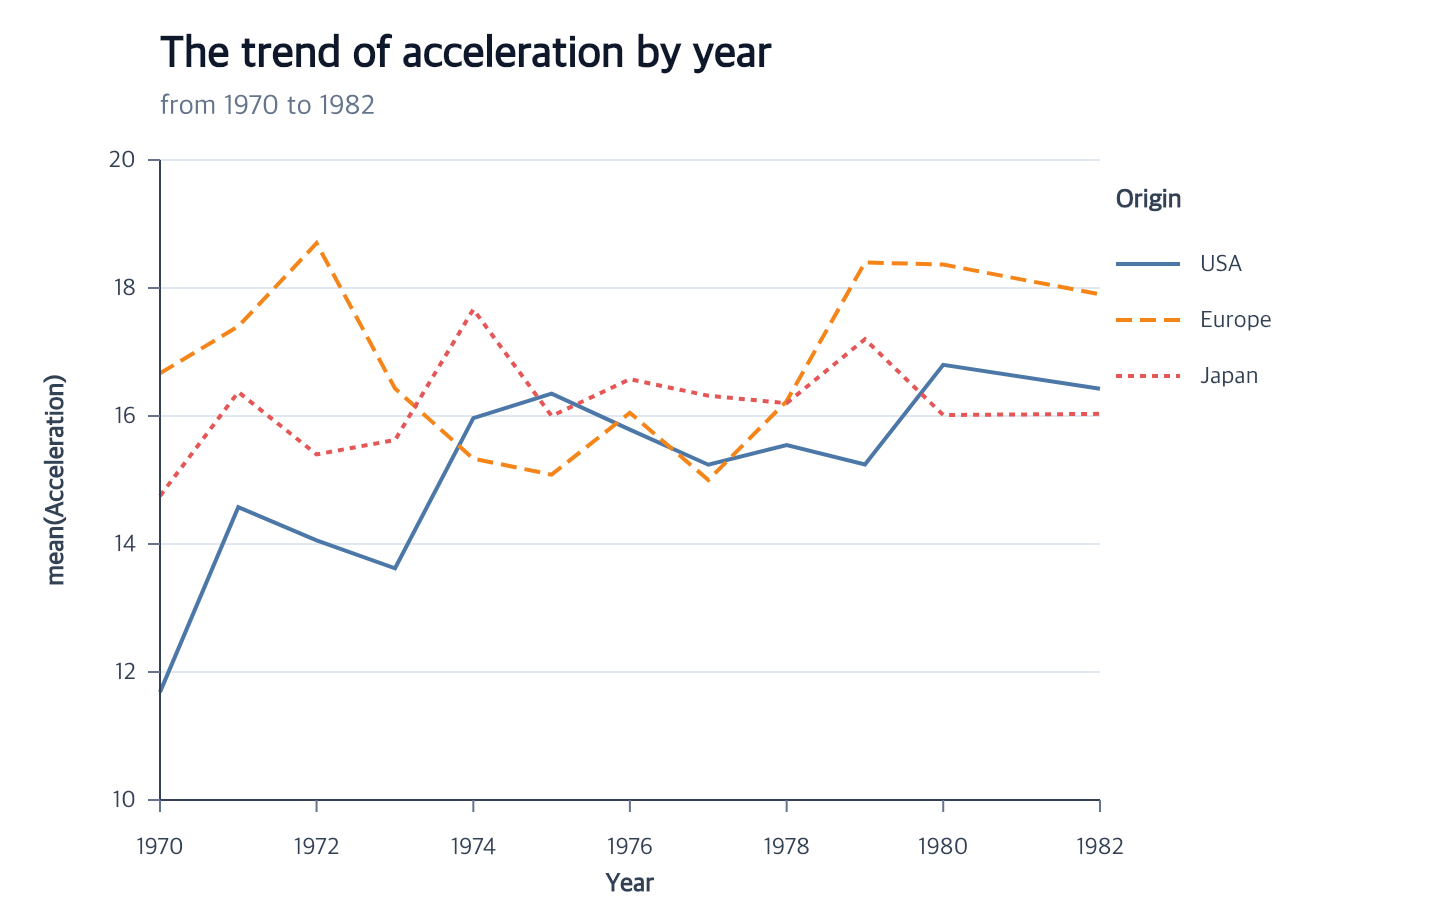
Minimal flow
Runnable: install ggaction and provide the named data array as plain row objects.
import { chart } from "ggaction";

const program = chart()
  .createCanvas({ margin: { right: 140 } })
  .createData({ values })
  .createLinePlot({
    x: { field: "date", fieldType: "temporal" },
    y: { field: "value", aggregate: "mean" }
  });
You must decide
- Temporal x field
- Quantitative y field
- Whether the line is one series or grouped by a nominal field
For multiple series, add color: "group", groupBy: "group", or
strokeDash: { field: "group" } to the facade call.
The library infers
- UTC time x and linear y scales
- Mean aggregation at each x/series group
- Sorted concrete
M/Lpath commands - Linear interpolation unless
line: { curve }selects another curve - Axes, horizontal grid, and a right-side categorical legend when applicable
Every materialized series needs at least two points. Reserve right margin for a
legend or pass createLegend({ position: "bottom", offset: 70 }) with enough
bottom margin for the x-axis title and legend. Adjust that explicit offset to
the authored axis labels and title.
Use line: { curve: "step" } during creation for midpoint steps, or edit an existing
line without changing its encodings:
const smooth = program.editLineMark({
  curve: "monotone",
  strokeWidth: 4
});
To overlay a trend on compatible aggregate bars, add the line after the bar
encodings. The line infers the shared fields, scales, and aggregate, so no
second encodeY call is needed:
const layered = chart().createCanvas()
  .createData({ values })
  .createBarMark({ id: "bars" })
  .encodeX({ field: "date", fieldType: "temporal" })
  .encodeY({ field: "value", aggregate: "mean" })
  .createLineMark({ id: "trend", strokeWidth: 3 });
The accepted curve vocabulary is linear, step, step-before, step-after,
basis, cardinal, monotone, and natural. The renderer receives only final
M/L/C commands and never interprets these names.
Continue
Line chart tutorial · Basic Charts · Temporal line positions · Series encodings
Documentation provenance
293 actions · sha256:e755591a2e5f5e2b494867583876e28020a478c5220b77bdc6ad469a6224891d