Published-release documentation · release compatibility
Histogram Recipe
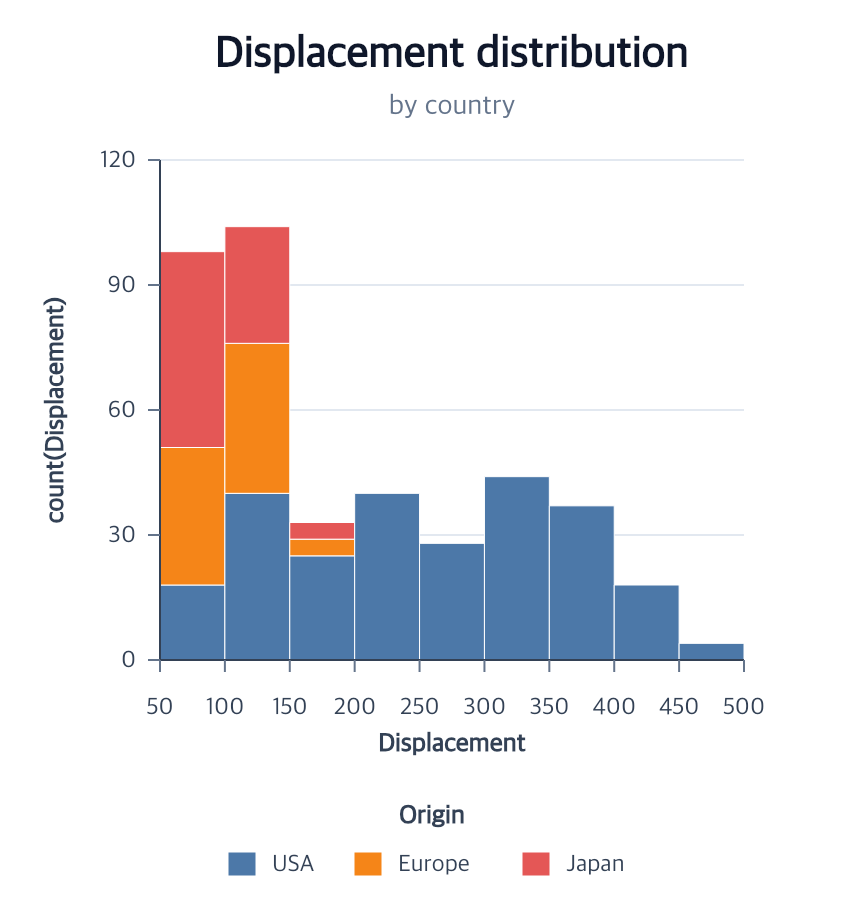
Minimal flow
Runnable: install ggaction and provide the named data array as plain row objects.
import { chart } from "ggaction";

const program = chart()
  .createCanvas({ margin: { right: 140 } })
  .createData({ values })
  .createHistogram({ field: "value" });
You must decide
- Quantitative field to bin
- Optional
maxBins - Optional nominal color field and series layout
Add color: { field: "group", layout: "stack" } to the createHistogram
options.
Choose fill, group, overlay, or diverging when their partition meaning
matches the chart.
The library infers
- Nice bin boundaries and binned x scale
- Count y encoding, zero stack, and y scale
- Concrete non-empty bin rectangles
- Bin-aligned axes, horizontal grid, and categorical legend when applicable
Legends default to the right. Pass
guides: { legend: { position: "bottom", layout: "legacy-bottom" } } for the horizontal layout used by
the public tutorial.
Continue
Histogram tutorial · Basic Charts · Histogram positions · Scale options
Documentation provenance
293 actions · sha256:e755591a2e5f5e2b494867583876e28020a478c5220b77bdc6ad469a6224891d