Published-release documentation · release compatibility
Axes
At a glance
| Action | Shortest call | Inference/defaults | Result |
|---|---|---|---|
createAxes |
createAxes() |
Stored coordinate family, position scales, titles | Complete x/y, theta/radius, or Parallel dimension axes |
editXAxis |
editXAxis({ ticks: false }) |
Existing x-axis components | Selected components edited or removed |
editYAxis |
editYAxis({ position: "right" }) |
Existing y-axis components | Retained components moved together |
removeXAxis / removeYAxis |
removeXAxis() |
Existing complete axis | Semantic, graphic, and stored axis state removed |
Cartesian axis lines, ticks, labels and titles must not overlap a chart title or legend on the same edge. This applies to creation, focused and whole-axis edits, and Canvas or scale updates, regardless of authoring order. Increase the margin or change offsets when space is insufficient; a failed action preserves the earlier program.
Automatic axis titles use the source field or aggregate. Statistical reference lines and bands reuse that title; their internal output columns do not introduce another measure name. Grouped summary outputs use their aggregate and source field, including after changing the source measure while retaining an output alias.
An omitted offset for a vertical Y-axis title reserves a quarter-em ink gap when its estimated text box is clamped to the Canvas edge. This applies at every font size when the extra reserve fits beside the actual axis labels. If it would introduce a label collision, placement keeps the existing Canvas-fit offset. Automatic margin fitting keeps space for the inferred ink reserve. Explicit offsets and preferred placement with sufficient margin stay exact.
Keep a title outside its labels
Cartesian axis titles accept offset: { from: "labels", gap: 8 }. The gap is a
finite non-negative distance in logical pixels outside the occupied label block.
It follows the same axis owner and physical side, including rotated labels and
independent facet scales. Declare the axis first, then refine its title:
Executable complete. Import chart from ggaction; all rows and both axes are declared in this complete program.
import { chart } from "ggaction";

const program = chart()
  .createCanvas({ width: 500, height: 360, margin: 90 })
  .createData({ values: [{ distance: 0, amount: 0 }, { distance: 1, amount: 120 }] })
  .createScatterPlot({ x: "distance", y: "amount" })
  .editYAxisTitle({ offset: { from: "labels", gap: 8 } });
The stored offset retains this intent. Label text, fonts, scales, data, Canvas,
theme and text metrics can change the resulting distance without replacing it
with a fixed number. Empty display labels do not contribute; at least one
nonempty label on the same side is required. Remove the title together with its
last labels, or switch its offset to a number. The existing collision and Canvas
checks still apply, including when overlap: "allow" is set.
Numeric offsets keep their signed distance from the axis frame; omitted offsets
keep their existing automatic defaults. An omitted edit preserves either mode.
The relative object accepts only from and gap. It is not a Polar/Parallel
title option, an axis frame offset, or a label offset.
Rotate labels outside the plot
Rotated Cartesian labels stay outside their selected plot edge in both fixed-size
and automatic-plot Canvases. offset measures the gap to the complete rotated
text bounds. Vertical X-axis labels are centered over their ticks; slanted labels
use an end anchor inferred from their rotation and axis side. Reserve enough
margin for the full label length and the axis title. Rotation does not enlarge a
fixed Canvas or change its margins.
Choose nearest-step linear ticks
Set rounding: "nearest" on Cartesian tick selection when automatic ticks should
choose the nearest 1–2–5 decade step. The default count density is 5: a 0–140
domain gets labels 0, 20, …, 140. Count is an approximate density, not an exact
number of ticks. Omission keeps the existing behavior; "ceiling" restores it.
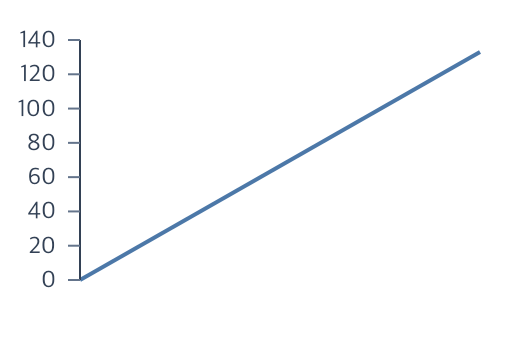
Contextual fragment. Use an ES module with the imports, data, and prepared resource state described in this section. Resolve these names from setup in this fragment or section; alternatives branch from the same base.
import { chart } from "ggaction";

const program = chart()
  .createCanvas({ plot: { width: 200, height: 120 }, margin: { left: 40, top: 20, right: 20, bottom: 30 } })
  .createData({ values: [{ x: 0, y: 0 }, { x: 1, y: 133 }] })
  .createLinePlot({
    x: { field: "x", scale: { domain: [0, 1] } },
    y: { field: "y", scale: { domain: [0, 140] } },
    guides: {
      axes: { x: false, y: { title: false, ticksAndLabels: { rounding: "nearest" } } },
      grid: false,
      legend: false
    }
  });
Complete axes, grouped ticks-and-labels, and focused Cartesian tick/label actions
accept the same option. It is restricted to count-mode linear axes. Explicit
values, temporal/transformed/discrete axes, and Polar/Parallel axes reject it.
When editing a values-mode axis, also provide count to select automatic ticks.
Once selected on ticks, count/rounding/value edits update existing labels and
inferred grids together. Label-only edits must agree with existing ticks. A
label-only axis does not supply a grid policy. Explicit grid count/values use
their existing independent policy; values: "auto" restores inference from
ticks. Named axes with conflicting policies need explicit grid selection.
Independent facets choose ticks from each actual child domain, and data/Canvas/
scale updates and saved programs preserve the policy.
Keep endpoint labels inside the axis span
Set Cartesian labels flush: true to keep unrotated text bounds inside the mapped scale span. This moves text inward only when its bounds cross an endpoint, without changing tick positions, text, font sizes or the outward gap. It works on X and Y axes, retains alongOffset, and moves wrapped lines together. The default is false. Rotated labels and text wider than the entire span are rejected.
Flush preserves the existing overlap policy. When adjacent labels intentionally overlap, request overlap: "allow"; this does not disable Canvas or title collision checks. Specify required flush geometry at complete-axis creation so the initial axis also fits. An independently explicit title.overlap: "allow" permits that title to intersect its own labels; see intentional title-label overlap.
Color individual tick labels
Use Cartesian labels colorMap: [{ value, color }] for per-value colors. Lookup uses raw typed tick values, independently of labelMap display text. Missing entries use the existing global color; [] stores an empty map and "auto" removes it. Continuous/time keys must be finite numbers or Unix milliseconds; categorical keys preserve their types. Duplicate keys, extra entry fields and empty colors are rejected. Wrapped lines share their tick color. Complete, whole-axis, grouped and focused label actions use the same policy, and tick/Canvas/scale changes preserve it. Polar and Parallel axes do not accept this option.
Override displayed tick text
Numeric labels accept format: "," for integer grouping (1234 becomes 1,234) or
format: ",.2f" for grouping with two decimal places. The existing precision range is
0–12. Grouped percent and scientific formats are unsupported. Temporal labels accept
format: "%a" for UTC weekday names such as Mon. Formatting changes displayed text;
it preserves raw values, scale domains and tick positions.
Cartesian label labelMap works with categorical values, numeric ticks and time ticks. Provide typed { value, label } entries. Continuous keys must be finite numbers; time keys use Unix milliseconds. Missing entries retain the normal formatter, and "auto" clears the map. Scale domains, tick positions and raw data are preserved. Use focused labels, nested ticks-and-labels or whole-axis editors to update the same policy.
Numeric axes also accept format: "ticks": infer fixed decimal places from each
axis’s settled tick spacing, retaining 0.00 at a 0.05 step and integer labels
at a 100 step. Independent facets resolve their own precision. Omitted/auto
output is unchanged; time and discrete scales reject this numeric option.
See numeric label formats for
precision limits and replay behavior.
Shift ticks and labels along an axis
Cartesian ticks and labels accept alongOffset, a signed finite displacement in logical pixels. Positive values move X-axis items right and Y-axis items down, including top/right axes and reversed scales. It defaults to zero and leaves the scale and axis baseline unchanged. Tick and label offsets are independent absolute values: set both when both should move. The existing label offset remains the outward gap from the plot edge. Complete axes, whole-axis editors and focused editors accept the same options; Canvas and scale updates preserve them. Polar and Parallel axes do not accept this option.
Independent Cartesian axes
Use createYAxis({ id: "share", position: "right" }) to establish another axis,
then editYAxisTitle({ target: "share", text: "Share" }) to refine it. See
Independent named Cartesian axes
for side occupancy, selection, arrays and independent scales.
Standalone Cartesian axes
An axis does not need an invisible mark or dataset. Supply an existing Cartesian coordinate and a scale with an explicit domain:
Contextual fragment. Use an ES module with the imports, data, and prepared resource state described in this section. Resolve these names from setup in this fragment or section; alternatives branch from the same base.
import { chart } from "ggaction";

const ruler = chart().createCanvas({ margin: 80 })
  .createCoordinate({ id: "frame", type: "cartesian" })
  .createScale({ id: "amount", type: "linear", domain: [0, 100] })
  .createXAxis({ coordinate: "frame", scale: "amount" });
The title defaults to the scale ID. Set title: false to omit it or use
title: { text: "Amount" }. Both resource IDs are required for standalone
creation; an automatic domain needs data consumers. Scale edits, Canvas resize,
coordinate frame aspect changes, and serialization preserve the binding.
Polar component creation
Create a missing Polar axis component without rebuilding the other components.
These actions are available from ggaction.
| Component | Theta action | Radial action |
|---|---|---|
| Baseline | createThetaAxisLine |
createRadialAxisLine |
| Tick marks | createThetaAxisTicks |
createRadialAxisTicks |
| Tick text | createThetaAxisLabels |
createRadialAxisLabels |
| Title | createThetaAxisTitle |
createRadialAxisTitle |
Contextual fragment. Use an ES module with the imports, data, and prepared resource state described in this section. Resolve these names from setup in this fragment or section; alternatives branch from the same base.
import { chart } from "ggaction";

const program = chart()
  .createCanvas({ width: 480, height: 480, margin: 80 })
  .createData({ values: [
    { direction: 0, distance: 2 },
    { direction: 120, distance: 4 },
    { direction: 240, distance: 6 }
  ] })
  .createPointMark()
  .encodeTheta({ field: "direction", scale: { domain: [0, 360] } })
  .encodeR({ field: "distance", scale: { zero: true } })
  .createThetaAxis({ title: false })
  .createThetaAxisTitle({ text: "Direction" })
  .editThetaAxisTitle({ fontWeight: 600 })
  .createRadialAxisLine({ angle: 45 })
  .createRadialAxisTicks({ values: [0, 3, 6] })
  .createRadialAxisLabels({ values: [0, 3, 6] })
  .createRadialAxisTitle({ text: "Distance" });
All eight actions accept optional scale and coordinate IDs. Existing axis
bindings take precedence over inference; otherwise exactly one compatible Polar
encoding must identify the resources. Use the matching focused editor to change
an existing component. Duplicate creation fails. After removeThetaAxis() or
removeRadialAxis(), the same create actions can rebuild selected components.
Tick and label creation accepts either count or exact data-space values.
Other style options match the corresponding focused editor below. Radial
creation also accepts angle in degrees: the first component establishes it
(default 90), and later components share it. Change the angle with
editRadialAxis({ angle }); conflicting component angles are rejected. Theta
components do not accept angle. Only radial titles accept
position: "inside" | "outside".
Omitted title text follows the encoded field or its explicit title. Component styles and bindings survive Canvas, scale, and compatible encoding edits.
Omit, remove, and restore components
All four complete axis creators accept false for line, ticksAndLabels,
and title. Omission or {} creates the component with inferred defaults.
At least one component must remain enabled. To disable an entire axis, use
the outer createAxes({ x: false, ... }) selection.
The corresponding complete editors accept false for line, ticks,
labels, ticksAndLabels, and title to remove existing components.
An object edits an existing component; an omitted option preserves it.
Restore a missing component with its focused create action.
ticksAndLabels: false removes both existing components. If only one remains,
remove it with ticks: false or labels: false. Do not combine the group with
individual tick/label options. The group’s nested ticks and labels still
accept style objects, not false.
Removing the last component cleans up the axis state and preserves grids,
marks, and scales. Removed components stay absent after Canvas or scale edits.
editRadialAxis({ angle }) requires an existing axis component.
When a chart facade reuses guides, a component declared false must be absent.
If it already exists, remove it explicitly before requesting that declaration.
Theta creation rejects angle, which was previously ignored; angle belongs
to radial axes.
createAxes(options?)
See Complete Axes and Labels for creation, display mapping, formatting, wrapping, Polar/Parallel decisions, and examples.
Editing a complete axis
Use editXAxis() or editYAxis() when several components of one existing
axis should change together:
Contextual fragment. Use an ES module with the imports, data, and prepared resource state described in this section. Resolve these names from setup in this fragment or section; alternatives branch from the same base.
program
  .editXAxis({
    line: false,
    ticksAndLabels: {
      count: 6,
      ticks: { length: 7 },
      labels: { color: "#475569", fontSize: 11 }
    },
    title: { text: "Engine displacement" }
  })
  .editYAxis({ position: "right" });
The complete edit facade does not create an axis or change its scale and
coordinate binding. Each component accepts its existing edit object or false;
false removes that component’s stored materialization config and concrete
graphic together; title removal also clears its semantic text. ticksAndLabels:
false removes both components and cannot be combined with standalone ticks
or labels. Omitted components remain unchanged unless position is present,
which moves every retained component on that axis.
Removing the last component also clears the empty complete-axis semantic and
stored config. Recreate one component with its ordinary create*AxisLine,
create*AxisTicksAndLabels, or create*AxisTitle action, or recreate the full
axis with createXAxis()/createYAxis(). Later Canvas and scale edits do not
restore removed components.
Use editThetaAxis() for grouped theta component edits. Use
editRadialAxis({ angle: 180 }) to move the radial line, ticks, labels, and
title together. Focused editThetaAxisLine/Ticks/Labels/Title and matching
editRadialAxis* actions change one visible component without raw graphic IDs.
editRadialAxisTitle({ position: "inside" | "outside" }) switches only the
radial title placement while preserving its text and style.
Removing an axis
removeXAxis(), removeYAxis(), removeThetaAxis(), and
removeRadialAxis() remove the complete axis: line, ticks,
labels, title, semantic guide state, and stored materialization settings. Marks,
scales, coordinates, and the opposite axis remain.
Contextual fragment. Use an ES module with the imports, data, and prepared resource state described in this section. Caller-provided receivers:
program. Resolve these names from setup in this fragment or section; alternatives branch from the same base.
const withoutXAxis = program.removeXAxis();
const selected = program.removeYAxis({ scale: "y", coordinate: "main" });
Optional selectors must match the existing resource. A missing or mismatched axis throws before anything changes.
| Option | Meaning |
|---|---|
position |
x: "bottom"/"top"; y: "left"/"right" |
line |
false or { color?, lineWidth? } |
ticks |
false or { count?, values?, length?, color?, lineWidth?, alongOffset? } |
labels |
false or { count?, values?, offset?, format?, color?, fontSize?, fontFamily?, fontWeight?, rotation?, maxWidth?, wrap?, lineHeight?, overlap?, alongOffset?, labelMap?, flush?, colorMap? } |
ticksAndLabels |
false or { count?, values?, ticks?, labels? } |
title |
false or { text?, at?, offset?, rotation?, color?, fontSize?, fontFamily?, fontWeight? } |
Axis label and title weights follow the shared Canvas font-weight policy.
Use either ticksAndLabels or the independent ticks/labels options in one
call. The action validates the entire request before editing any component, so
an invalid later component cannot leave a partial result.
Edit several existing axes
Contextual fragment. Use an ES module with the imports, data, and prepared resource state described in this section. Caller-provided receivers:
program. Resolve these names from setup in this fragment or section; alternatives branch from the same base.
// Fragment: program already contains x and y axes.
program.editAxes({
  x: { labels: { fontSize: 11 } },
  y: { ticksAndLabels: { count: 4, labels: { fontSize: 11 } } }
});
editAxes groups existing channel editors in one atomic call. Omitted axes are preserved; it never creates an absent axis. See the action reference for the complete signature.
Errors and limitations
Ambiguous scale or coordinate candidates require explicit IDs. Each channel has one semantic axis, so parallel duplicate axes cannot be created.
Related
Guides · Grids · Advanced axis components
An explicit Cartesian labelMap entry with label: "" hides only that displayed label. Tick marks, stored tick values and scale domains stay unchanged. Empty labels remain suppressed after Canvas/scale replay; clear the map with "auto" to restore the normal formatter.
Documentation provenance
293 actions · sha256:e755591a2e5f5e2b494867583876e28020a478c5220b77bdc6ad469a6224891d