Published-release documentation · 281 actions; release compatibility · contract 5520b0fa9525
Area and Series Layout
An area measures the space between a value and a baseline, or between two explicit bounds. Start with a complete chart, then edit its endpoints, grouping, placement, and appearance separately.
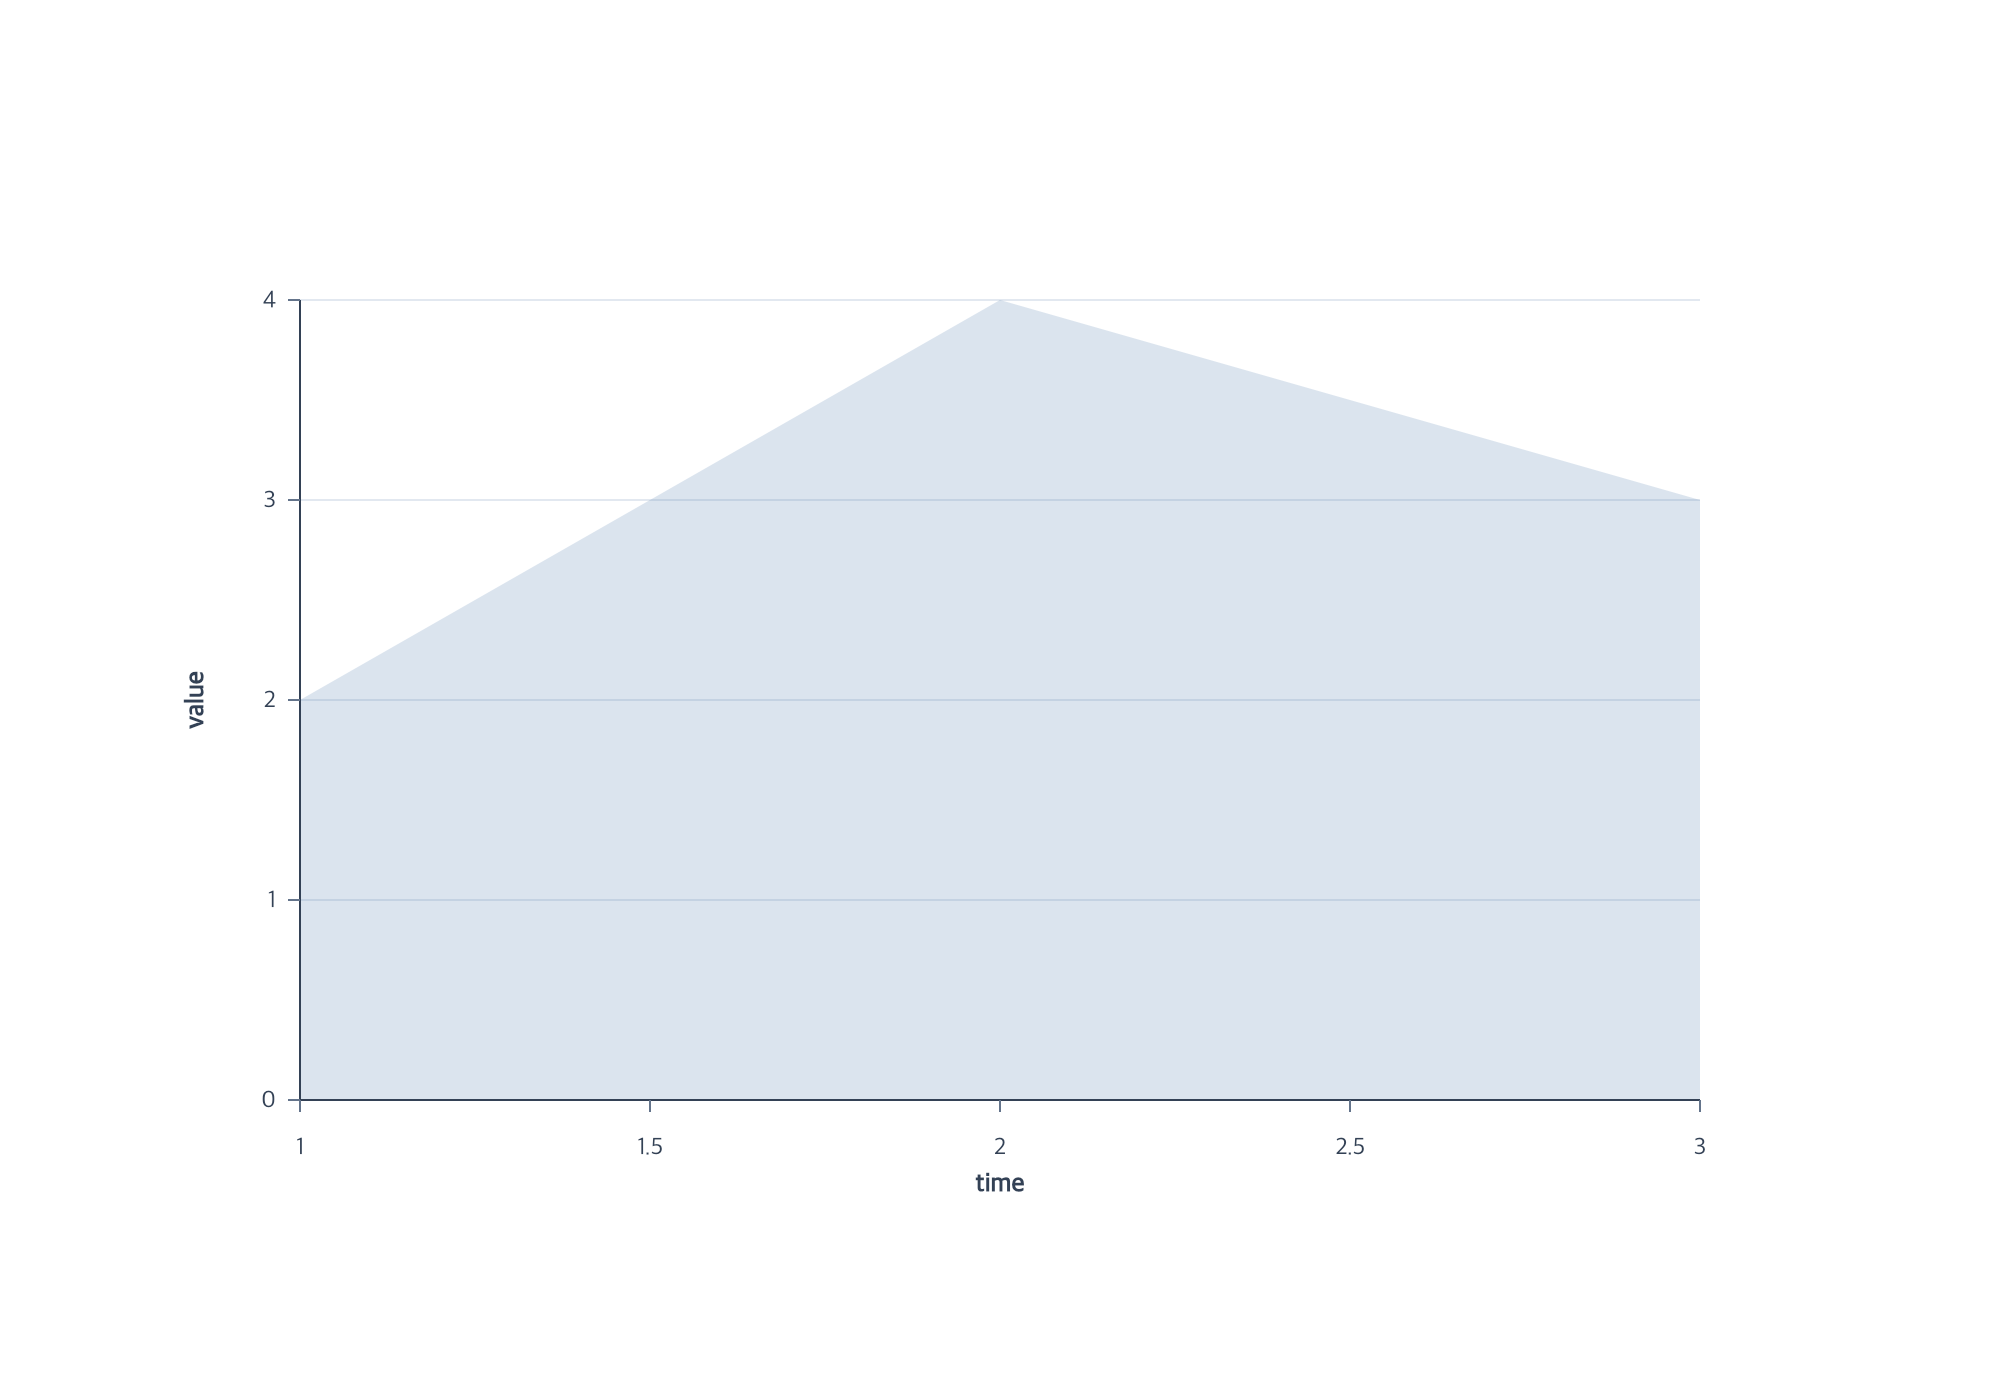
Start with a zero baseline
import { chart, render } from 'ggaction';
const program = chart()
  .createCanvas({ width: 1000, height: 700, margin: 150 })
  .createData({ id: 'data', values: [
    { time: 1, value: 2, low: 1, high: 3 },
    { time: 2, value: 4, low: 2, high: 6 },
    { time: 3, value: 3, low: 1, high: 5 }
  ] })
  .createAreaPlot({ id: 'm', x: 'time', y: 'value' });
render(program, document.querySelector('#chart').getContext('2d'));
The value stays on y; y2 stores a constant zero. Both endpoints contribute to the automatic domain. The default opacity is 0.2. The canonical executable example uses the same action flow and includes independent variants for the remaining cases.
Choose bounds and orientation
Given a prepared program with low, high, time, and value fields, these are alternative creation calls:
// Fragments: each starts from a prepared Canvas and dataset.
base.createAreaPlot({ x: 'time', y: { lower: 'low', upper: 'high' } });
base.createAreaPlot({ x: 'time', y: 'value', baseline: 1 });
base.createAreaPlot({ x: { field: 'value', scale: { type: 'log' } },
  y: 'time', valueChannel: 'x', baseline: 1 });
Lower and upper identify the two path boundaries; crossing values are preserved. A logarithmic value
scale needs a positive baseline. Edit an existing baseline with encodeY2({datum:1}), or replace both
bounds atomically with encodeYRange.
Separate series identity, placement, and color
// Fragment: rows have aligned time samples, nonnegative value, series, and region fields.
const stacked = base.createAreaPlot({ x: 'time', y: 'value', groupBy: 'series',
  layout: 'stack', color: 'region' });
const shares = stacked.layoutSeries({ mode: 'fill' });
const overlay = shares.layoutSeries({ mode: 'overlay' });
groupBy determines which observations form a series. layoutSeries determines where that series is
placed. Color may use another field when its value is constant within each series. Fill normalizes each
position to one; diverging accumulates positive and negative values separately; center places the total
symmetrically around zero. Stack, fill and center require nonnegative values. Series use source appearance
order, independently of color-domain or legend order.
Bar charts use the same separation. After createBarPlot, assign encodeGroup({field:'series'}) and
layoutSeries({mode:'group'}) or layoutSeries({mode:'stack'}). Color is optional. Group → stack → group
rebuilds the offsets from the current group. Removing color preserves the grouped or stacked geometry.
Keep gaps explicit
Use missing:'break' for null or undefined measure endpoints. The chart closes separate segments on either
side of a gap, retaining only segments with at least two valid samples. Accumulated series break together
at a missing position. Missing rows are not created, and misaligned group grids are errors. Invalid independent
positions, NaN and infinity remain errors.
For the exact options and limits, see createAreaPlot
and layoutSeries.