Published-release documentation · release compatibility
Regression Scatterplot Tutorial
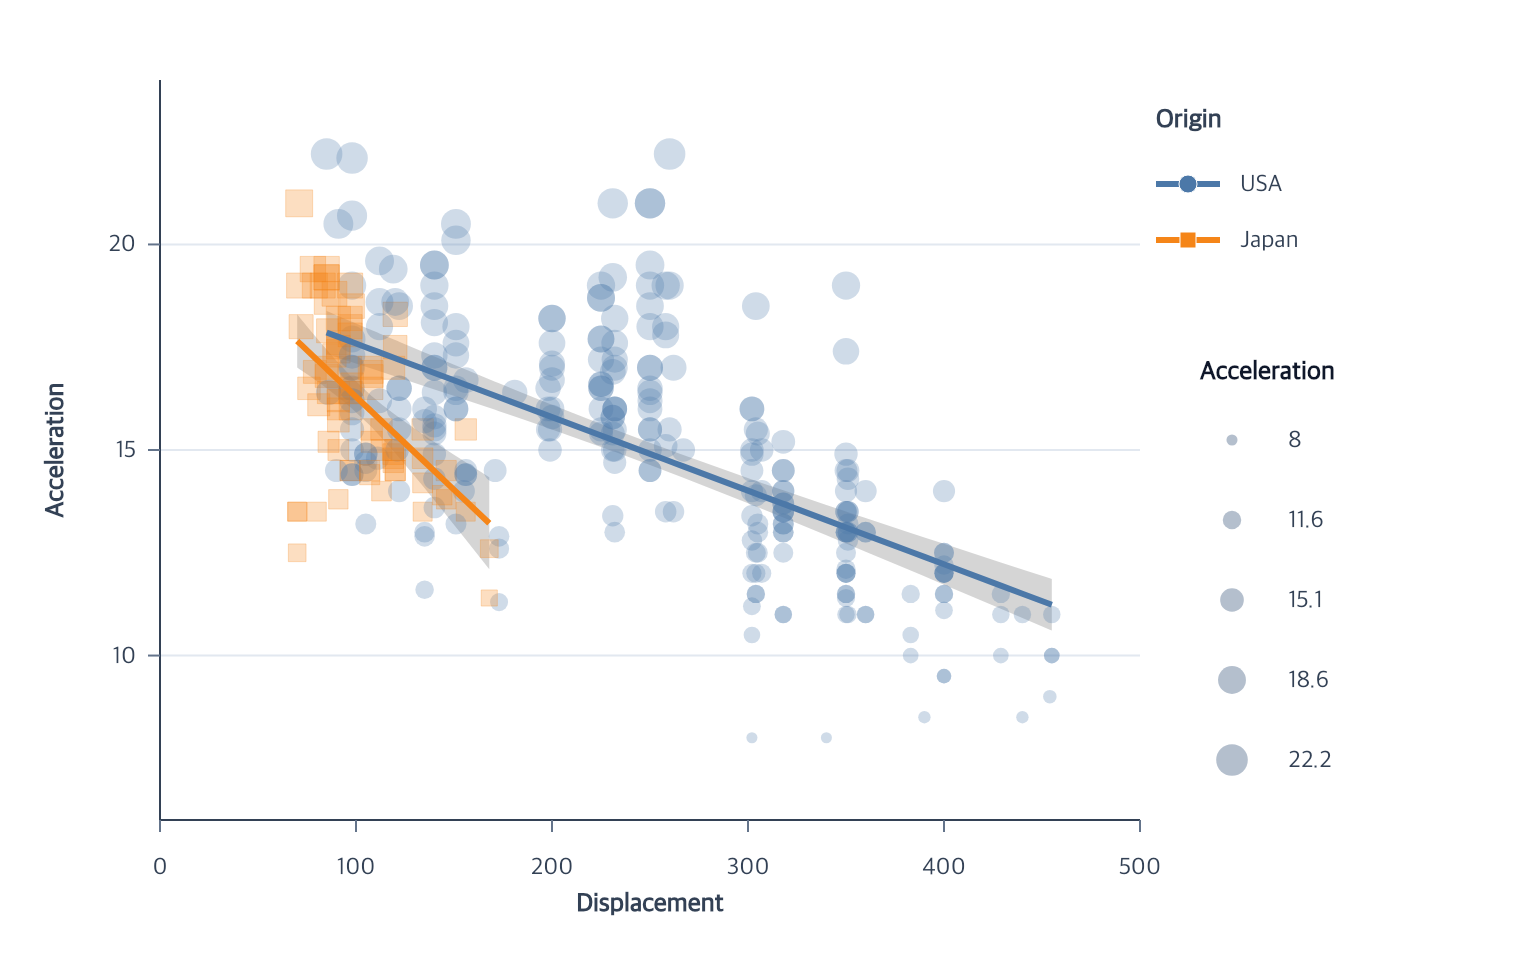
This tutorial filters the cars dataset to Japan and the USA, maps point size to Acceleration and point color/shape to Origin, then adds one linear fit and 95% mean-response confidence band per Origin. The complete module uses the public npm package. The repository also contains a runnable browser example and its complete program.
Start with the Vite project from Getting Started, then place the tutorial dataset in Vite’s public directory:
mkdir -p public
curl --fail --location https://raw.githubusercontent.com/ggaction/ggaction/6422776b0a379c8c89809f41b434f366fbc1f143/data/cars.json --output public/cars.json
Complete program
import { chart, render } from "ggaction";

const response = await fetch("/cars.json");
if (!response.ok) throw new Error(`Failed to load cars: ${response.status}`);
const cars = await response.json();

const program = chart()
  .createCanvas({
    width: 760,
    height: 480,
    margin: { top: 40, right: 190, bottom: 70, left: 80 }
  })
  .createData({ id: "cars", values: cars })
  .createPointMark({ id: "points" })
  .encodeX({
    field: "Displacement",
    scale: { nice: true, zero: false }
  })
  .encodeY({
    field: "Acceleration",
    scale: { nice: true, zero: false }
  })
  .encodeColor({
    field: "Origin",
    scale: { palette: "tableau10" }
  })
  .encodeSize({ field: "Acceleration" })
  .encodeShape({ field: "Origin" })
  .encodeOpacity({ value: 0.27 })
  .filterMarks({
    field: "Origin",
    op: "oneOf",
    values: ["Japan", "USA"]
  })
  .createRegression({
    confidence: 0.95,
    band: { color: "#111111", opacity: 0.18 },
    line: { strokeWidth: 3 }
  })
  .createGuides();

render(program, document.querySelector("#chart").getContext("2d"));
What the actions establish
| Stage | Semantic result | Graphical result |
|---|---|---|
filterMarks |
A namespaced immutable dataset derived from cars; points is rebound |
Point scales and geometry are rematerialized |
| point encodings | Shared x/y, color, size, and shape scales | Typed circles and squares with fixed opacity |
createRegression |
Grouped linear predictions and three linked layers | Two filled bands and two stroked paths |
createGuides |
Shared axes, grid, Origin legend, and size legend | One guide set for all compatible layers |
The shortest createRegression() call infers its target from the current point
mark, x/y from its quantitative encodings, and grouping from the unique nominal
field shared by color and shape. It fails when those choices are ambiguous.
The default interval describes uncertainty around the fitted mean response.
Use interval: "prediction" for individual observations, or select polynomial
and LOESS fits through the same action.
Key action trace
High-level actions retain their wrapped children, so the regression remains inspectable without exposing its internal IDs in the user program.
program
├─ createPointMark
├─ encodeSize
├─ encodeShape
├─ filterMarks
│  ├─ createDerivedData
│  ├─ materializeMarkFilteredData
│  ├─ editSemantic(points.data)
│  ├─ rematerializeScale
│  └─ rematerializePointMark
├─ createRegression
│  ├─ createRegressionData
│  ├─ createRegressionBand
│  │  └─ createErrorBand
│  └─ createRegressionLine
└─ createGuides
   ├─ createAxes
   ├─ createGrid
   └─ createLegend
Run and continue
- Serve the repository root and open
examples/cars-regression-scatterplot/. - Read the regression API for inference and options.
- Use Appearance encodings to customize point size, shape, and opacity.
- Export the same immutable program with PNG rendering.
Documentation provenance
293 actions · sha256:e755591a2e5f5e2b494867583876e28020a478c5220b77bdc6ad469a6224891d