Published-release documentation · release compatibility
Regression Scatterplot Recipe
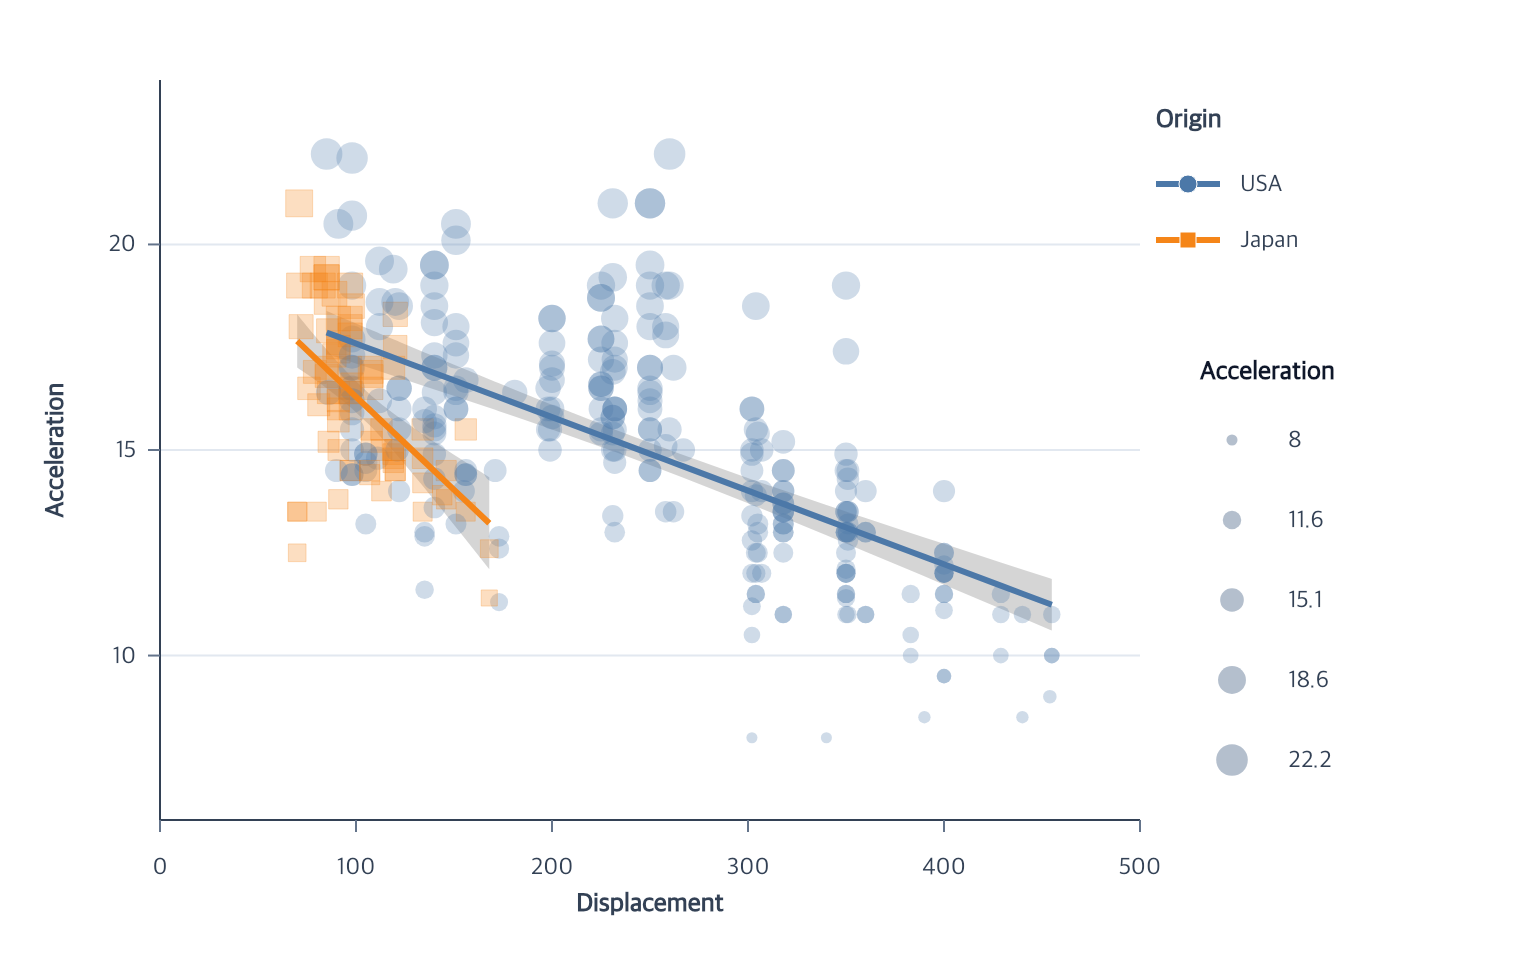
Use this pattern to layer grouped linear fits and mean-response confidence bands over a point chart.
Minimal flow
Runnable: install ggaction and provide the named data array as plain row objects.
import { chart } from "ggaction";

const program = chart()
  .createCanvas({
    width: 760,
    height: 480,
    margin: { top: 40, right: 190, bottom: 70, left: 80 }
  })
  .createData({ values: cars })
  .createPointMark()
  .encodeX({ field: "Displacement", scale: { nice: true, zero: false } })
  .encodeY({ field: "Acceleration", scale: { nice: true, zero: false } })
  .encodeColor({ field: "Origin", scale: { palette: "tableau10" } })
  .encodeSize({ field: "Acceleration" })
  .encodeShape({ field: "Origin" })
  .encodeOpacity({ value: 0.27 })
  .filterMarks({
    field: "Origin",
    op: "oneOf",
    values: ["Japan", "USA"]
  })
  .createRegression()
  .createGuides();
You must decide
- Point x and y fields
- Optional nominal color or shape grouping field
- Optional source filter
The library infers
- The current eligible point layer
- Quantitative x/y fields and their shared coordinate and scales
- One grouping field when color and shape agree
- Immutable OLS rows, one 95% mean-response confidence band, and one line per group
- Shared axes, grid, categorical legend, and quantitative size legend
Pass target, x, y, or groupBy only when inference is ambiguous.
Continue
Regression scatterplot tutorial · Regression API · Appearance encodings
Documentation provenance
293 actions · sha256:e755591a2e5f5e2b494867583876e28020a478c5220b77bdc6ad469a6224891d