Published-release documentation · release compatibility
Bar Marks
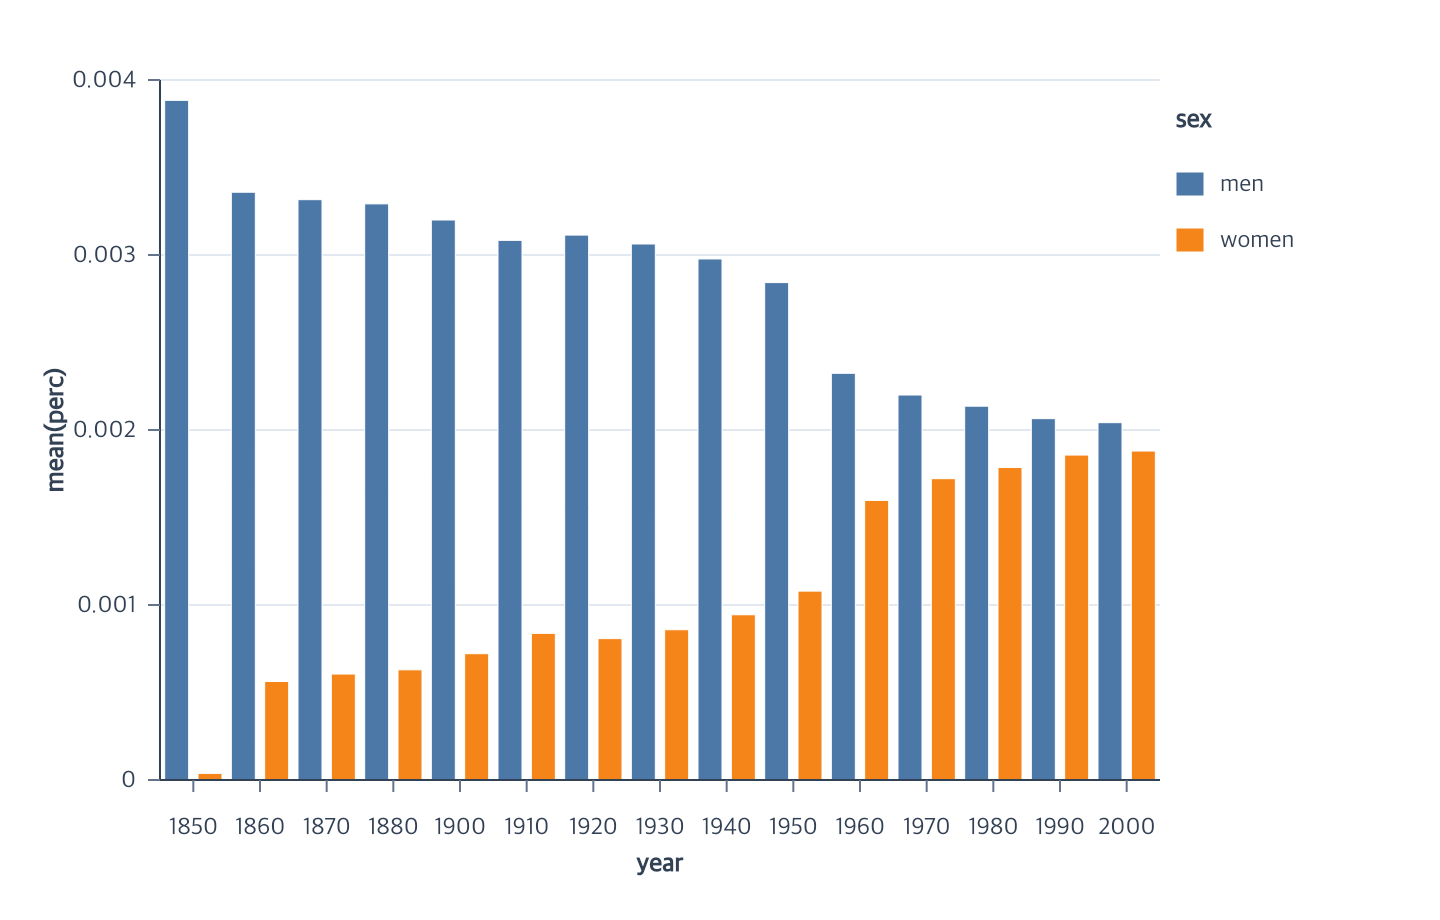
Bar marks represent binned counts, aggregate categories, grouped or stacked partitions, and observed quantitative intervals.
For raw numeric centers, create the mark with orientation: "vertical" or
"horizontal", then encode two quantitative positions. Every row remains a
separate bar, including repeated centers. Numeric bars extend from zero to the
measure, or use a range on the measure channel. Width defaults to 5 pixels;
encodeBarWidth({ pixels: 20 }) sets a fixed width before or after positions.
Numeric bars support overlay layout and reject band widths and aggregation.
The createBarPlot facade infers vertical orientation for two raw numeric fields.
createBarMark({ id?, data?, missing?, fill?, opacity?, stroke?, strokeWidth?, cornerRadius?, cornerRadiusTopLeft?, cornerRadiusTopRight?, cornerRadiusBottomRight?, cornerRadiusBottomLeft?, lineCap?, lineJoin?, miterLimit? } = {})
This heading shows common options. For the full callable contract and all branches, see createBarMark and the exact declarations.
Executable complete. Import chart from ggaction and supply the cars, rows, intervalRows, or values fixture described by this section. Each chain owns its Canvas.
const program = chart().createCanvas()
  .createData({ values: cars })
  .createBarMark({ opacity: 0.78, stroke: "#0f172a", strokeWidth: 1.25 })
  .encodeHistogram({ field: "Displacement" });
The first ID is "bar" and data defaults to current data. Creation starts with
an empty rect collection because binning, aggregation, stacking, grouping, and
width determine the final rectangle count and geometry.
Creation-time fill, opacity, stroke, strokeWidth, cornerRadius, lineCap,
lineJoin, and miterLimit use the same
validation and persistent materialization config as editBarMark. Constant
fill conflicts with a later field-driven color encoding.
A positive cornerRadius rounds all four corners of every final bar and is
clamped independently to half that bar’s smaller side. Stacked and grouped
segments keep their own radius calculation. Set it to 0 to restore square
rectangles. Stroke cap/join details and the requested radius survive Canvas,
encoding, theme, highlight, legend, and facet replay.
For an aggregate bar, combine an ordinal position and quantitative aggregate.
Complete aggregate and ranged bars immediately use the default 0.72 band
width; call encodeBarWidth only to override it:
Contextual fragment. Use an ES module with the imports, data, and prepared resource state described in this section. Resolve these names from setup in this fragment or section; alternatives branch from the same base.
program
  .encodeX({ field: "year", fieldType: "ordinal" })
  .encodeY({ field: "perc", aggregate: "mean" })
  .encodeBarWidth({ band: 0.72 });
encodeColor({ layout }) can arrange partitions with stack, fill, group,
overlay, or diverging. Group layout invokes encodeXOffset for vertical
bars or encodeYOffset for horizontal bars internally.
Observed interval bars combine one categorical or temporal axis with encodeYRange
or encodeXRange. Temporal centers preserve actual date gaps and share the
ordinary temporal-bar slot policy. Use encodeBarWidth({ pixels: 5 }) for a fixed
width, before or after assigning positions; otherwise the default band fraction
uses the smallest observed time gap. Both orientations support ISO dates and
explicit timestamp units.
editBarMark({ target?, blend?, fill?, opacity?, stroke?, strokeWidth?, cornerRadius?, cornerRadiusTopLeft?, cornerRadiusTopRight?, cornerRadiusBottomRight?, cornerRadiusBottomLeft?, lineCap?, lineJoin?, miterLimit? })
This heading shows common options. For the full callable contract and all branches, see editBarMark and the exact declarations.
Contextual fragment. Use an ES module with the imports, data, and prepared resource state described in this section. Caller-provided receivers:
program. Resolve these names from setup in this fragment or section; alternatives branch from the same base.
program.editBarMark({
  opacity: 0.8,
  stroke: "#111827",
  strokeWidth: 1.5
});
fill accepts a solid color string or the existing FillPaint linear gradient:
{ type: "linear-gradient", from: { x: 0, y: 1 }, to: { x: 0, y: 0 },
stops: [{ offset: 0, color: "red" }, { offset: 1, color: "blue" }] }
.
Endpoints use normalized item-local coordinates; ordered stops must have offsets
from zero to one. This works in creation, bar.fill facade options, and edits,
including rounded bars and later resizing.
The current or only bar is inferred when target is omitted. Constant fill
conflicts with field-driven color, while opacity and outline remain editable.
Geometry and semantic aggregation are unchanged and appearance is reapplied
after Canvas or scale rematerialization.
See Mark Style for the closed cap/join values, defaults, and high-level pass-through rules.
Independent corners
cornerRadiusTopLeft, cornerRadiusTopRight, cornerRadiusBottomRight, and
cornerRadiusBottomLeft override cornerRadius for their visual corners.
Each value is a finite non-negative logical-pixel radius, clamped independently
to half the smaller item side. An explicit zero keeps that corner square.
Omitted corners use the global radius or zero. Edits retain unspecified
overrides, so resetting the global radius alone does not clear them.
Blend with underlying content
After creating a bar chart, call program.editBarMark({ blend: "difference" }).
Each bar combines its fill and outline first, then applies its opacity and
composites that source once over the existing plot, grid, and earlier marks.
Bars retain their drawing order. The RGB operation is the absolute difference
between the source and backdrop colors. This changes paint, never data or sizes.
Use blend: "normal" to return to ordinary source-over painting. Omission preserves
the current mode. This refinement belongs to the Full bar editor; creation,
facade appearance objects, and other mark families do not accept it.
SVG, browser Canvas, PNG, and PDF support the same concrete effect. PDF rasterizes only the opted-in bar source; other content remains vector. Isolated sources obey the renderer allocation limits.
Related
Histogram positions · Ordinal bars · Series encodings
Documentation provenance
293 actions · sha256:e755591a2e5f5e2b494867583876e28020a478c5220b77bdc6ad469a6224891d