Published-release documentation · release compatibility
Gradient Plots
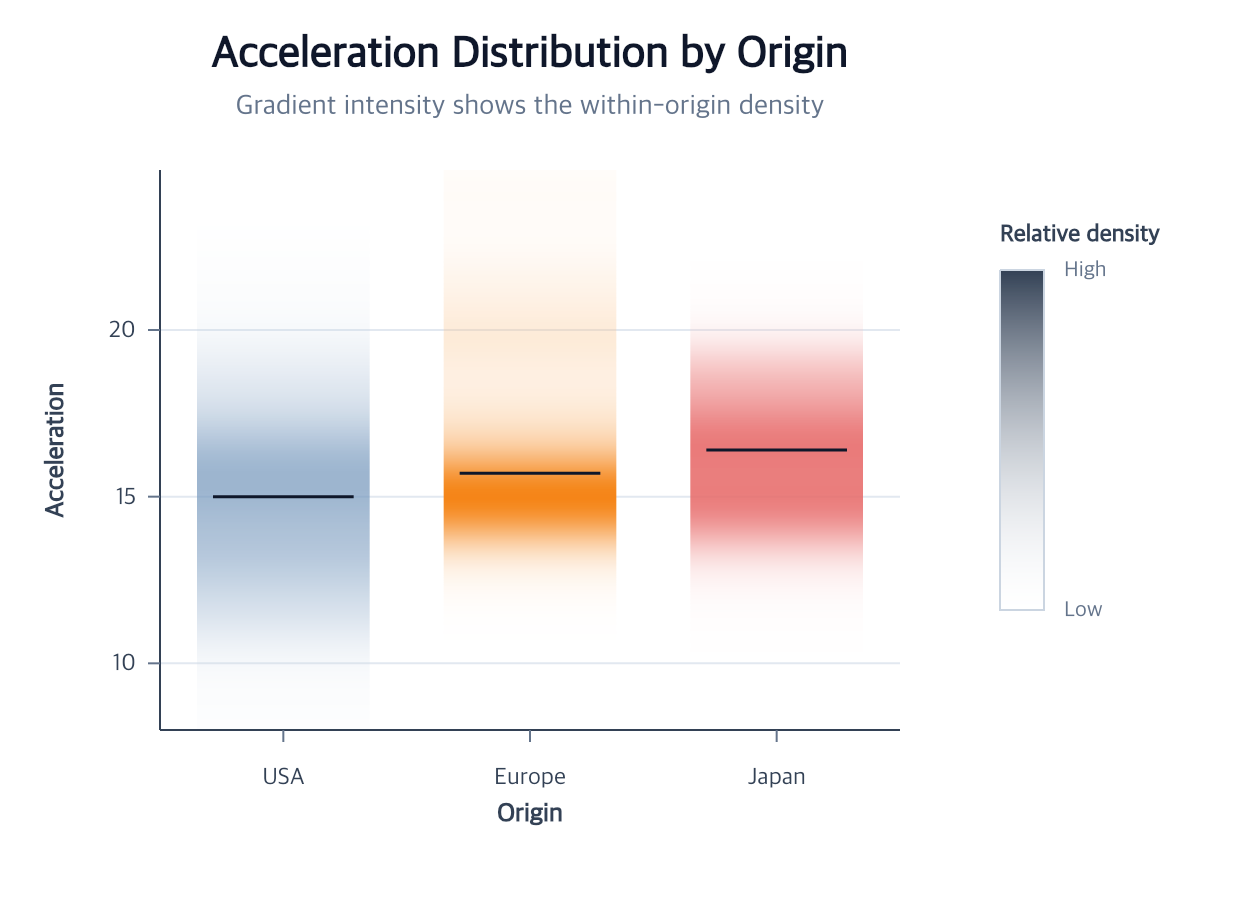
createGradientPlot compares a quantitative distribution across categories.
Each category becomes one density-filled strip plus an optional center rule.
The action uses the same categorical/quantitative x and y roles as
createBoxPlot, so orientation follows the fields rather than a separate flag.
Create a gradient plot
Contextual fragment. Use an ES module with the imports, data, and prepared resource state described in this section. Resolve these names from setup in this fragment or section; alternatives branch from the same base.
import { chart } from "ggaction";

const program = chart()
  .createCanvas({
    width: 620,
    height: 460,
    margin: { top: 85, right: 170, bottom: 95, left: 80 }
  })
  .createData({ values: cars })
  .createGradientPlot({
    x: { field: "Origin", fieldType: "nominal" },
    y: { field: "Acceleration" }
  });
The shortest complete call infers Cartesian scales and creates applicable axes, grid lines, a median center rule, and a right-side relative-density legend. Axis titles retain the original source fields even though the action materializes an internal sampled profile dataset.
Use a categorical color encoding when each category should keep its own hue:
Contextual fragment. Use an ES module with the imports, data, and prepared resource state described in this section. Caller-provided receivers:
program. Resource selectors used here:target: "gradientPlot". Resolve these names from setup in this fragment or section; alternatives branch from the same base.
const colored = program.encodeColor({
  target: "gradientPlot",
  field: "Origin",
  fieldType: "nominal",
  scale: { palette: "tableau10" }
});
Density still controls lightness and opacity inside each strip. A fixed
encodeColor({ target: "gradientPlot", value: "#e45756" }) uses one hue for
all strips while preserving the density gradient. A field color uses the
actual value in each profile row; category, center, and observation count
are available at this grain. Unrelated raw columns cannot assign several
colors to one strip.
gradient.palette controls density colors when no fixed or field color owns
the hue. gradient.opacity controls the within-strip opacity range in every
mode. encodeOpacity, encodeStroke, encodeStrokeWidth, and editRectMark
apply to the strip itself and survive scale, Canvas, density, and facet
replay. Enable an outline with encodeStroke before changing its width.
Rounded corners use the same editRectMark options as other rect marks.
The neutral density legend is independent of the color channel. A later
createGuides({ legend: { target: "gradientPlot", channels: ["color"] } })
can display a hue legend alongside it. The density legend moves beyond
right-side channel legends to keep their labels separate.
Options and defaults
Contextual fragment. Use an ES module with the imports, data, and prepared resource state described in this section. Resolve these names from setup in this fragment or section; alternatives branch from the same base.
createGradientPlot({
  id?, target?, data?, x?, y?, coordinate?, color?,
  density?: { bandwidth?, extent?, steps?, kernel?, normalization? },
  width?: { band? },
  gradient?: { palette?, opacity? },
  center?: false | { type?, stroke?, strokeWidth?, lineCap?, lineJoin?, miterLimit? },
  guides?: false | { axes?, grid?, legend? }
} = {})
densitydefaults to Gaussian, automatic bandwidth and extent,64steps, and unit normalization.stepsis limited to 10,000; all category profiles together are limited to 10,000 generated rows and the shared density work budget.width.banddefaults to0.7of the category band.gradientdefaults toblueswith opacity[0, 1].coloraccepts a field name, a field/scale encoding, or{ value }. It is equivalent to a laterencodeColoron the strips, including after deferred positions complete. Color controls hue; density retains lightness and opacity. The density legend remains separate. This option does not create subgroup profiles or add unrelated source fields to the profile data.centerdefaults to a median rule with a1.5logical-pixel dark stroke;falseremoves the complete optional component. Its cap/join/miter values follow the shared Mark Style contract; it does not acceptcornerRadius.guides: falseomits all guide resources. Nestedfalsevalues omit only that component.
Positions can be supplied in the create call, inferred from one compatible
encoded layer, or completed afterward with encodeX and encodeY. An omitted
choice is accepted only when one source or target is unambiguous.
Edit and compose
Contextual fragment. Use an ES module with the imports, data, and prepared resource state described in this section. Caller-provided receivers:
colored. Resolve these names from setup in this fragment or section; alternatives branch from the same base.
const edited = colored.editGradientPlot({
  density: { bandwidth: 0.8 },
  width: { band: 0.55 },
  center: { type: "mean", stroke: "#111827" }
});
The same owner can revise its raw source or complete positional roles:
Contextual fragment. Use an ES module with the imports, data, and prepared resource state described in this section. Caller-provided receivers:
edited. Resource selectors used here:data: "observations". Resolve these names from setup in this fragment or section; alternatives branch from the same base.
const horizontal = edited.editGradientPlot({
  data: "observations",
  x: { field: "value", fieldType: "quantitative" },
  y: { field: "group", fieldType: "nominal" }
});
Omitted data, x, and y retain current provenance. Exactly one resulting
role must be categorical and the other quantitative. A role swap preserves the
strip and center IDs, creates an immutable profile revision, moves axes and the
continuous grid, rebuilds structured paints and the density legend, and
replays compatible highlights. An incompatible stored selector or shared-scale
handoff rejects the complete edit.
Density or center-statistic changes create a new immutable profile revision. Width, palette, opacity, and center appearance retain the current profile. Canvas and scale edits rematerialize strips, paint direction, center rules, attached text, and guides.
selectMarks and highlightMarks operate at one category-strip grain. An
opacity or offset highlight preserves the structured density paint; an
explicit fill replaces it. filterMarks intentionally rejects this
composite resource—filter the source with filterData before
createGradientPlot instead.
Cartesian facet replays the profile independently inside each cell. Shared
density legends are not currently supported; omit the facet legend or keep
legends outside the repeated chart.
Current limitations
Subgroup offsets, multiple overlaid profiles, independent per-category intensity domains, and shared facet density legends are not implemented.
Related
Box plots · Data filtering · Selection and highlighting · Statistical action reference
Documentation provenance
293 actions · sha256:e755591a2e5f5e2b494867583876e28020a478c5220b77bdc6ad469a6224891d