Published-release documentation · release compatibility
Rule Marks
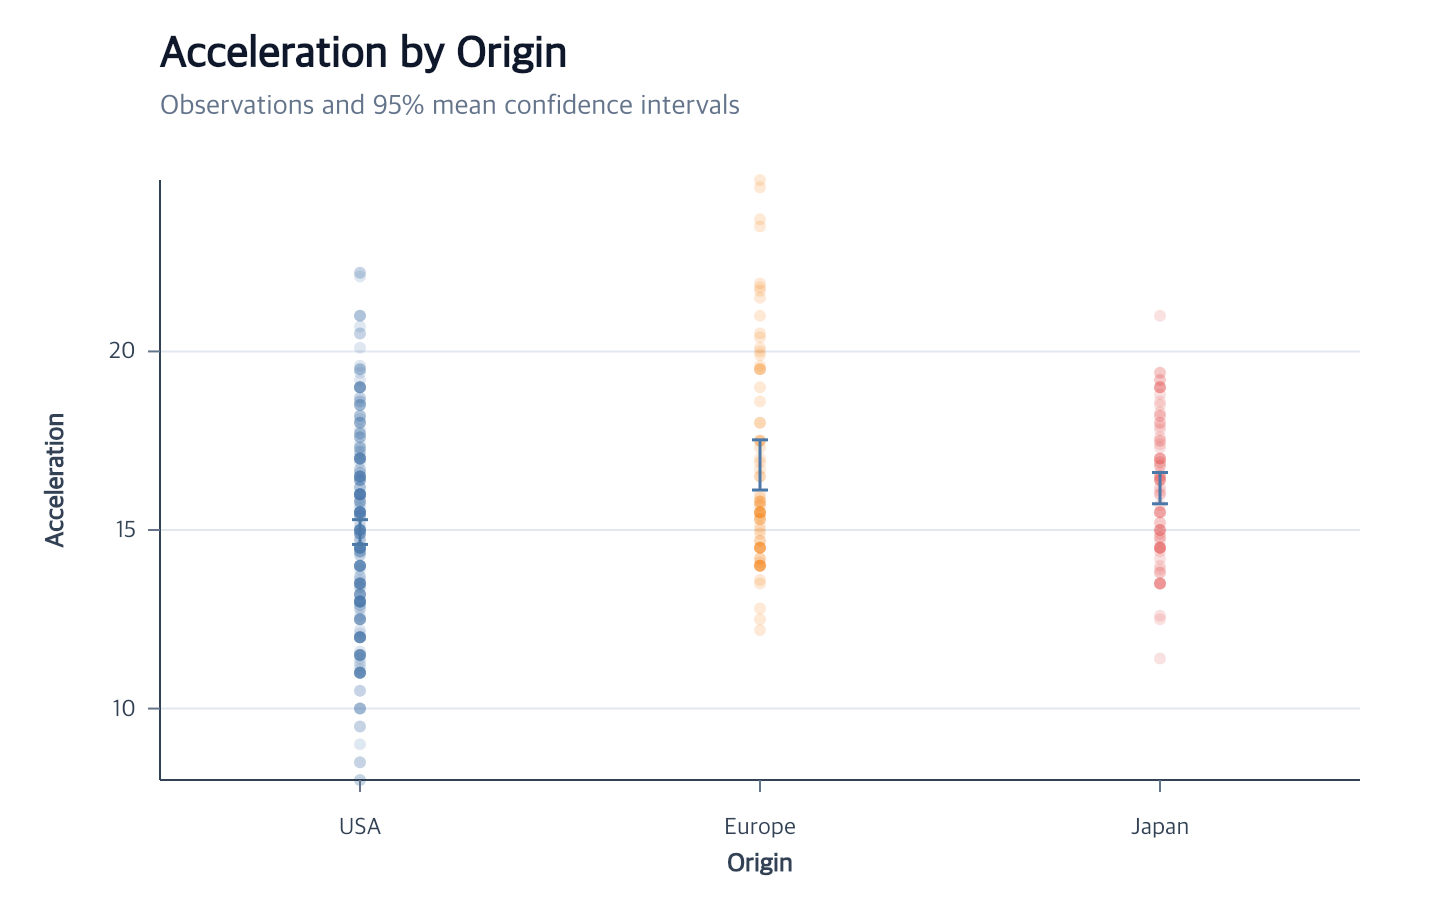
Rule marks represent reference lines and intervals. They use concrete line primitives without exposing a renderer-specific path format.
createRuleMark({ id?, data?, missing?, stroke?, strokeWidth?, strokeDash?, opacity?, lineCap?, lineJoin?, miterLimit? } = {})
This heading shows common options. For the full callable contract and all branches, see createRuleMark and the exact declarations.
Contextual fragment. Use an ES module with the imports, data, and prepared resource state described in this section. Resolve these names from setup in this fragment or section; alternatives branch from the same base.
import { chart } from "ggaction";

const threshold = chart()
  .createCanvas({ width: 480, height: 320, margin: 40 })
  .createData({ values: [{ limit: 25 }] })
  .createRuleMark()
  .encodeY({ field: "limit", fieldType: "quantitative" })
  .encodeStroke({ value: "#dc2626" })
  .encodeStrokeWidth({ value: 2 });
The first ID is "rule", data defaults to current data, and creation assigns no
position; the default appearance uses the theme mark color, width 2, a solid stroke, and opacity 1. A single x or y encoding creates a full plot-span rule. Add
encodeY2 for a bounded vertical interval, encodeX2 for a bounded horizontal
interval, or both secondary endpoints for a diagonal rule. Every endpoint may
use a field or constant datum.
When a rule is layered without explicit data, it may first inherit a
compatible source layer’s x/y positions. A constant datum endpoint takes
precedence over the inherited opposite position when no secondary endpoint
exists: datum y removes only inherited x and creates a horizontal full-span
rule, while datum x symmetrically creates a vertical full-span rule. Field
endpoints preserve the orthogonal inherited channel for interval construction.
Rules created with explicit data do not apply this provenance-based cleanup.
Rule creation and editRuleMark({ target?, stroke?, strokeWidth?, strokeDash?, opacity?, lineCap?, lineJoin?, miterLimit? })
accept constant styles. They validate all options before delegating requested
styles in the following order:
encodeStrokeencodeStrokeWidthencodeStrokeDashencodeOpacity
At least one style is required for editing. Scalar edits reject active field
encodings; use the corresponding encoder with { value } to replace them.
Styles persist while endpoints are incomplete and after Canvas resizing.
lineCap, lineJoin, and miterLimit use the shared closed vocabulary in
Mark Style
and apply to every final rule segment, including reference and error components.
encodeStrokeWidth({ field, scale? }) maps a non-negative quantitative field
to one concrete width per rule item. Use createLegend({ channels:
["strokeWidth"] }) for a sampled quantitative guide. Constant
encodeStrokeWidth({ value }) remains available and removes the field binding.
Every complete rule stores concrete x1, y1, x2, and y2 values. An
incomplete endpoint combination remains empty until another encoding completes
it. Canvas and scale changes recompute all endpoints.
Reference lines and bands
Use reference facades to add a constant threshold or interval to a chart. This example uses the scatterplot’s x scale for the band and y scale for the line:
Contextual fragment. Use an ES module with the imports, data, and prepared resource state described in this section. Resource selectors used here:
source: "referenceLine". Resolve these names from setup in this fragment or section; alternatives branch from the same base.
import { chart } from "ggaction";

const program = chart()
  .createCanvas({ width: 480, height: 320, margin: 40 })
  .createData({ values: [{ x: 0, y: 0 }, { x: 10, y: 10 }] })
  .createPointMark()
  .encodeX({ field: "x" })
  .encodeY({ field: "y" })
  .createReferenceBand({ x: [2, 6] })
  .createReferenceLine({ y: 5 })
  .createMarkLabels({ source: "referenceLine", value: "Target", dy: -8 });
Data values share the source scale and contribute to its automatic domain. Set an explicit scale domain if
the chart extent must stay fixed. For a position independent of the data range, use
createReferenceLine({ space: "plot", y: 0.5 }); this places a line halfway up the plot.
Plot y fractions increase from bottom to top. A plot band can use x: [0.2, 0.6] for 20%–60% of the width.
Both resize with the Canvas. Existing data is required, but may be empty for plot references.
Statistical references keep the same Rule and Rect editing surface while deriving their positions from a source mark:
Contextual fragment. Use an ES module with the imports, data, and prepared resource state described in this section. Resource selectors used here:
source: "observations". Resolve these names from setup in this fragment or section; alternatives branch from the same base.
const summarized = chart()
  .createCanvas({ width: 480, height: 320, margin: 40 })
  .createData({ values: [{ x: 0, y: 3 }, { x: 1, y: 8 }, { x: 2, y: 13 }] })
  .createPointMark({ id: "observations" })
  .encodeX({ field: "x", fieldType: "quantitative" })
  .encodeY({ field: "y", fieldType: "quantitative" })
  .createReferenceLine({
    id: "mean",
    source: "observations",
    axis: "y",
    statistic: { op: "mean" }
  })
  .createReferenceBand({
    id: "middle-half",
    source: "observations",
    axis: "y",
    statistics: [
      { op: "quantile", p: 0.25 },
      { op: "quantile", p: 0.75 }
    ]
  });
The default boundData population ignores filterMarks. Choose visibleItems to recompute after mark filtering.
On a distribution’s measurement axis, boundData uses the original observations recorded by its density,
ECDF, computed box-summary, or gradient transform. Summarized Dot, Lollipop, and Dumbbell endpoints likewise
resolve their original source measurement; a Dumbbell’s start and end retain their separate fields.
Repeated observations retain their frequency; density
samples and summary rows do not substitute for observations. Source groups remain available for groupBy.
Precomputed box summaries retain their supplied data because original observations are unavailable.
Horizon supports statistics only on a quantitative X axis, using original X observations rather than
the repeated folded-band samples. Its Y coordinate is a folded fraction, so a Y statistic is rejected;
temporal X is also outside the numeric statistical-reference contract.
Selections and highlights do not filter statistical populations. An omitted field follows the source axis after
re-encoding; an explicit field remains fixed. Statistical values use the source position scale but never expand its
automatic domain. Shared appearance scales do include the reference’s groups, including groups hidden by a mark
filter. They recompute for source-data, distribution-role revisions, encoding, scale, Canvas, and facet replay,
and are removed with their source.
Reference marks remain editable with ordinary mark, encoding, and scale actions. Refer to the reference-line contract and reference-band contract for binding, defaults, and removal behavior.
Statistical reference action
Use createStatisticalReference to choose a line or data interval through one action in the full API:
Contextual fragment. Use an ES module with the imports, data, and prepared resource state described in this section. Resource selectors used here:
source: "points". Resolve these names from setup in this fragment or section; alternatives branch from the same base.
import { chart } from "ggaction";

const source = chart()
  .createCanvas({ width: 600, height: 450, margin: 80 })
  .createData({ values: [0, 10, 20, 30, 40].map(value => ({ x: value, y: value * 2, group: value < 20 ? "A" : "B" })) })
  .createScatterPlot({ id: "points", x: "x", y: "y", guides: false });

const mean = source.createStatisticalReference({ source: "points", axis: "y" });
const groupedMean = source.createStatisticalReference({ source: "points", axis: "y", groupBy: "group" });
const middle95 = source.createStatisticalReference({
  source: "points", axis: "y",
  statistics: [{ op: "quantile", p: 0.025 }, { op: "quantile", p: 0.975 }]
});
The first branch creates a dark (#222222), 2.5-pixel solid mean line. Set statistic to mean, median, min, max,
or a quantile using the existing { op, p? } vocabulary. Supply an exact statistics pair instead for a gray
(#6b7280) band with opacity 0.18. Central 50% uses quantiles 0.25 and 0.75; central 95% uses 0.025 and 0.975.
These describe the data distribution, not a confidence interval. Never supply both statistic keys.
Use groupBy: "group" to compute one line or interval per observed source group on either axis.
The field need not be mapped to color or an axis. Group order follows the source rows.
When it matches the source Color field (without a color aggregate), each line defaults to that group’s
color using the same scale. Palette edits therefore update both the chart and the lines. Set stroke
explicitly to override this; ungrouped lines or a different grouping field keep the dark default.
The grouped output keeps its key in group; no group field names collide with statistical outputs.
For visibleItems, a visible mark must belong to one group. If an aggregated mark mixes group values, use boundData.
Filtering, re-encoding, facets and persistence keep the grouping; an omitted groupBy gives one overall result.
Both branches use ID statisticalReference by default. To add multiple references, give each an explicit id.
Line styles use the Rule options and band styles use Rect options. population and field retain the statistical
reference binding described above; literal coordinates belong to the separate literal reference actions.
The wrapper delegates to createReferenceLine or createReferenceBand, so native replay, editing and removal remain available.
Related
Appearance encodings · Error bars · Advanced axis components
Documentation provenance
293 actions · sha256:e755591a2e5f5e2b494867583876e28020a478c5220b77bdc6ad469a6224891d