Published-release documentation · release compatibility
Error Band Recipe
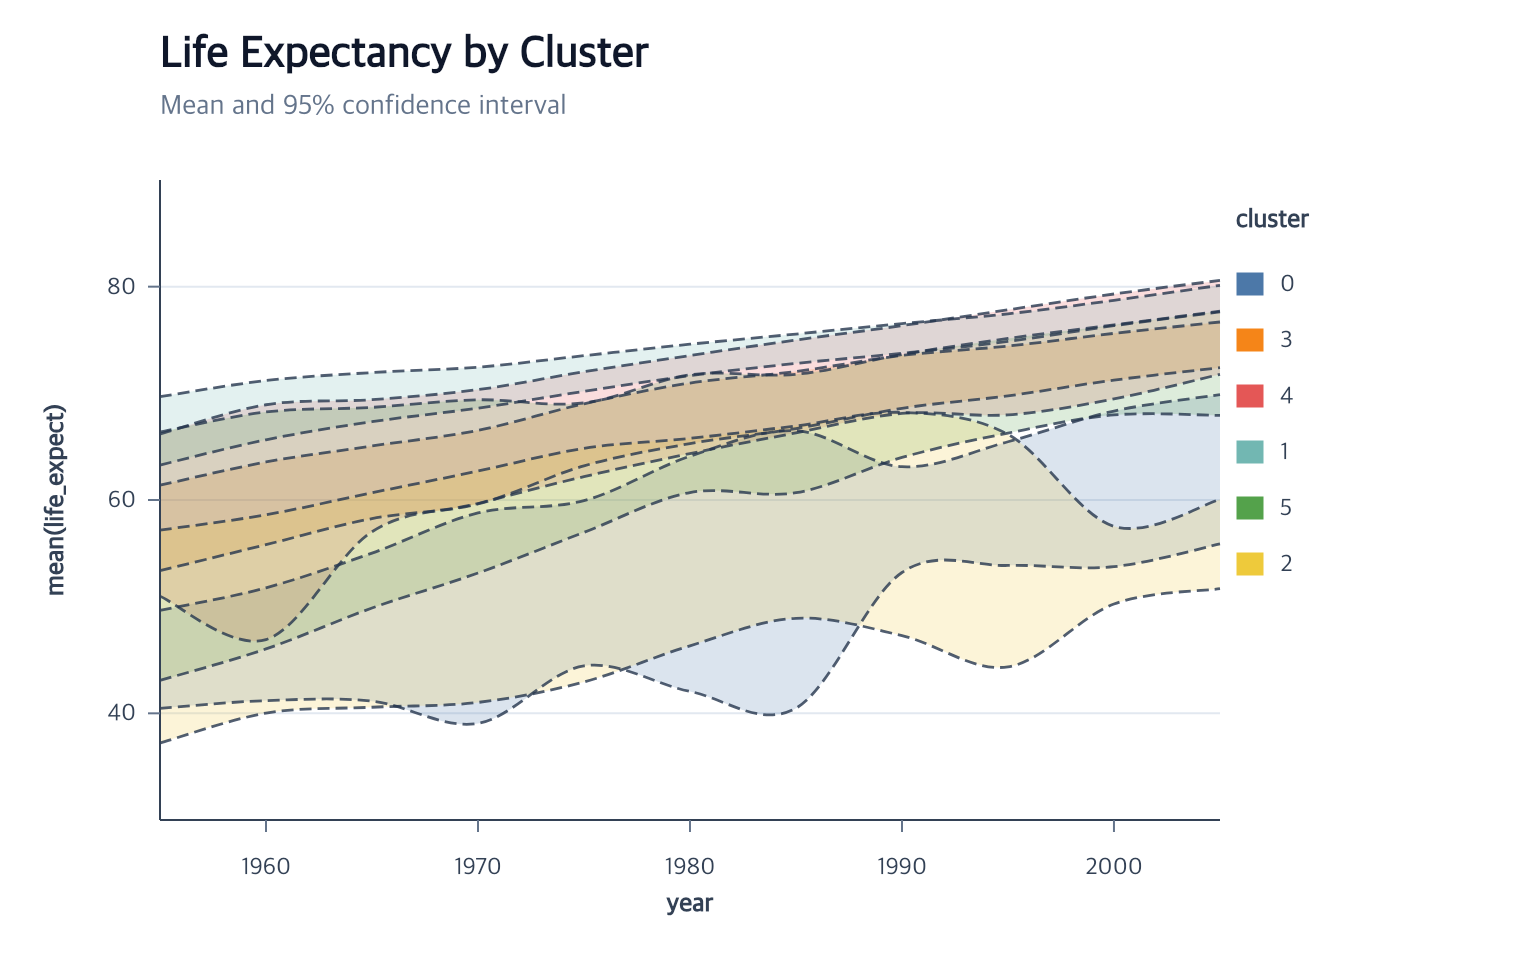
Minimal flow
Runnable: install ggaction and provide the named data array as plain row objects.
import { chart } from "ggaction";

const program = chart()
  .createCanvas({ margin: { top: 60, right: 180, bottom: 80, left: 70 } })
  .createData({ values })
  .createErrorBand({
    x: { field: "time", fieldType: "temporal" },
    y: { field: "value" },
    groupBy: "series"
  })
  .encodeColor({ target: "errorBand", field: "series" })
  .createGuides();
You must decide
values contains ISO date strings in time, finite numbers in value, and
non-empty series names. Supply at least two observations per time/series
cell for the default sample confidence interval, and several times per series
for a path. The right margin reserves space for short series names; larger
legend text needs more room.
- Quantitative or temporal independent-position field
- Quantitative interval field
- Optional grouping field
The library infers
- Current dataset and Cartesian coordinate
- Mean with a two-sided 95% Student-t confidence interval
- One immutable summary row per independent-position and group cell
- Vertical y/y2 or horizontal x/x2 area orientation
- Linear area paths, translucent fill, scales, axes, and applicable grid
When one compatible layer is already encoded, omitted data, coordinate, position fields, scales, and explicit grouping are reused when the interval axis is unambiguous.
Continue
Error-band tutorial · Error-band API
Documentation provenance
293 actions · sha256:e755591a2e5f5e2b494867583876e28020a478c5220b77bdc6ad469a6224891d