Published-release documentation · release compatibility
Box Plot Recipe
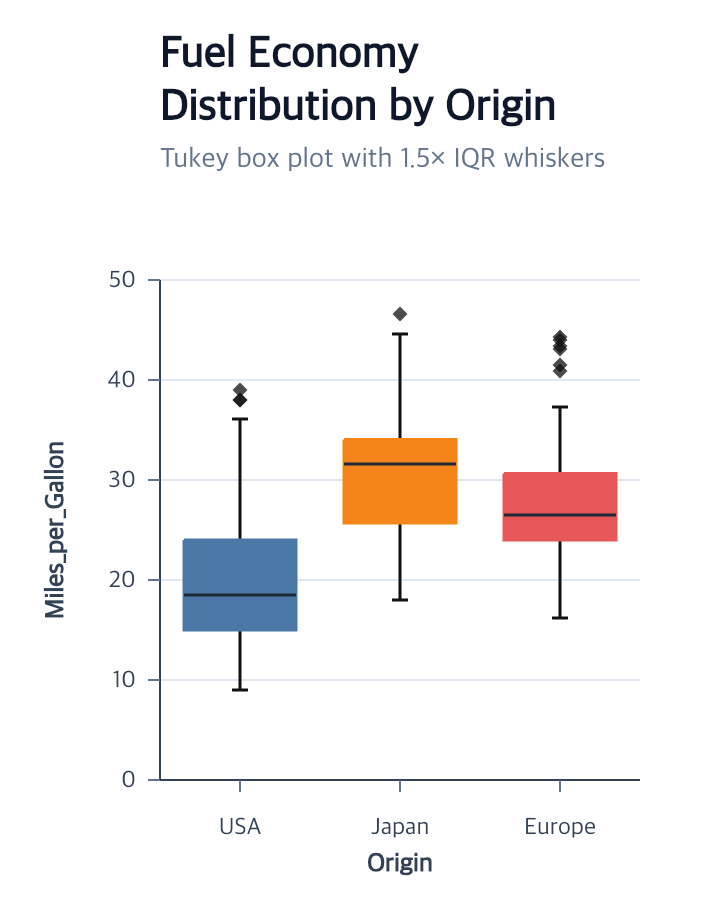
Minimal flow
Runnable: install ggaction and provide the named data array as plain row objects.
import { chart } from "ggaction";

const program = chart()
  .createCanvas()
  .createData({ values })
  .createBoxPlot({
    x: { field: "category", fieldType: "nominal" },
    y: { field: "value" },
    guides: { legend: false }
  });
You must decide
- One categorical field and one quantitative field
- Whether the categorical field belongs on x or y
The library infers
- The current dataset and Cartesian coordinate
- Vertical or horizontal orientation from the complete field pair
- Linearly interpolated quartiles: for
[1, 2, 3, 4], Q1/median/Q3 are1.75 / 2.5 / 3.25 - Tukey
1.5 × IQRfences, with whiskers at the most extreme observed values within the fences - A ranged-bar body, median rule, whiskers, caps, and optional outlier points
- Compatible scales, axes, and the perpendicular grid
Use whisker: { type: "minmax" } for observed minimum and maximum whiskers
without an outlier layer. Use editBoxPlot to revise statistics, width, or
component appearance through the stable box-plot owner.
Continue
Box-plot API · Bar marks · Error bars
Documentation provenance
293 actions · sha256:e755591a2e5f5e2b494867583876e28020a478c5220b77bdc6ad469a6224891d