Published-release documentation · release compatibility
Error Bands
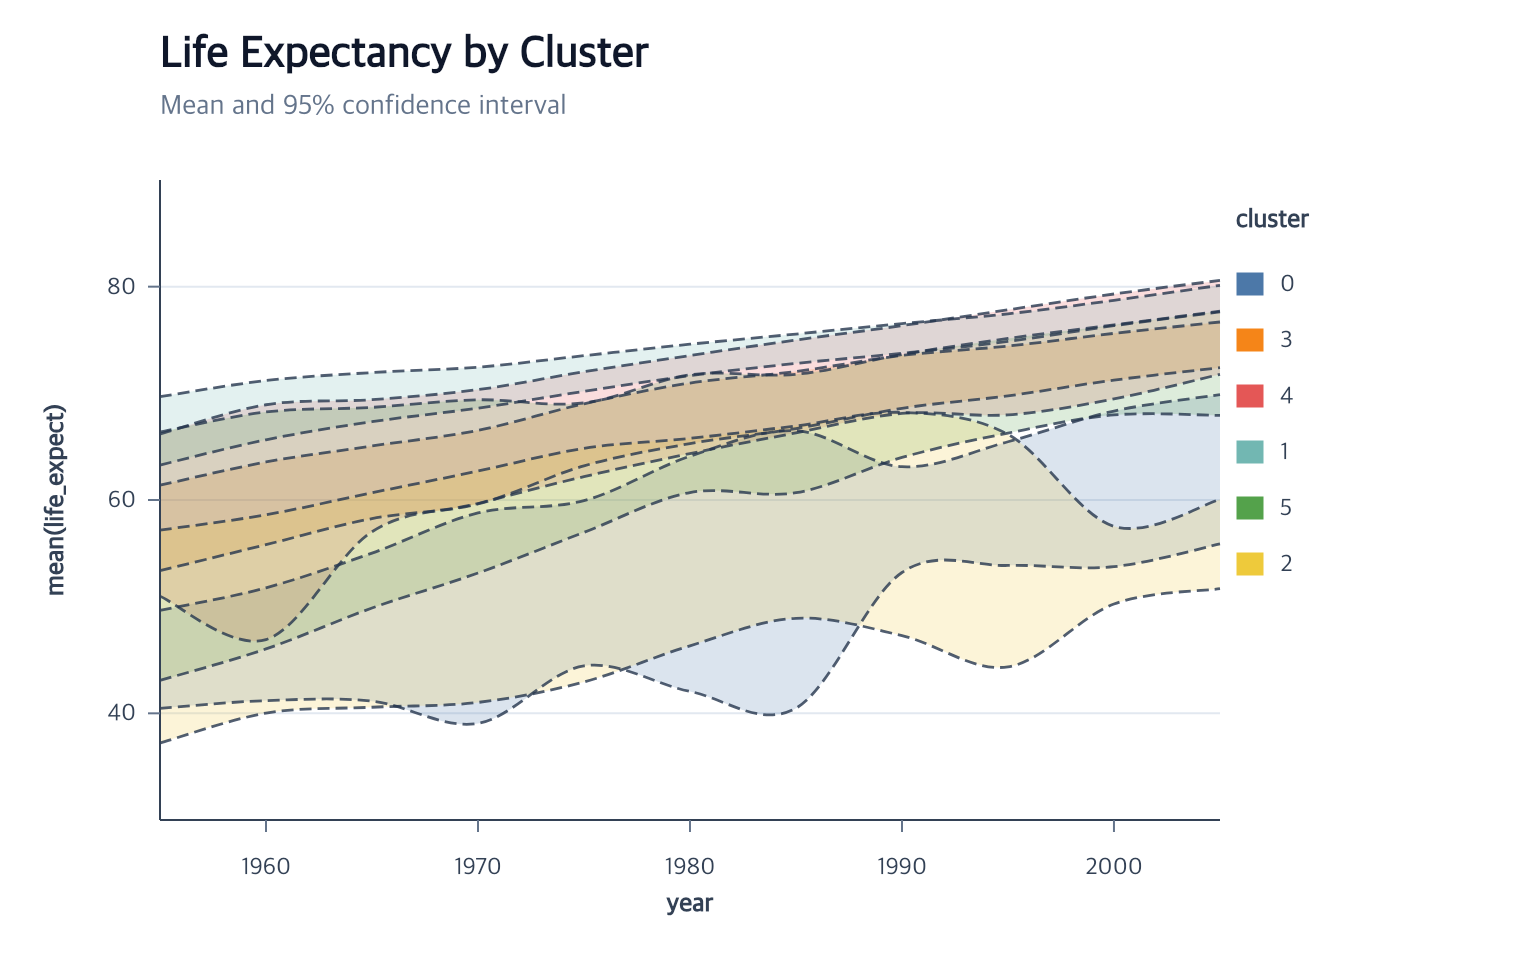
createErrorBand() creates a vertical or horizontal confidence or interval
ribbon as one ordinary area layer. It can derive grouped interval rows or
consume existing center/lower/upper fields.
At a glance
| Action | Shortest call | Result |
|---|---|---|
createErrorBand |
createErrorBand() after one eligible encoded layer |
One grouped interval dataset and ordinary area/boundary layers |
editErrorBand |
editErrorBand({ opacity: 0.35 }) |
Stable body and owned boundaries revised together |
editErrorBandBoundary |
editErrorBandBoundary({ strokeWidth: 2 }) |
Both owned boundaries created or edited |
createErrorBand(options?)
The following runnable fragment assumes gapminder is an in-memory array of
row objects loaded by the application.
Contextual fragment. Use an ES module with the imports, data, and prepared resource state described in this section. Resource selectors used here:
target: "errorBand". Resolve these names from setup in this fragment or section; alternatives branch from the same base.
import { chart } from "ggaction";

const program = chart()
  .createCanvas({
    width: 760,
    height: 480,
    margin: { top: 90, right: 150, bottom: 70, left: 80 }
  })
  .createData({ values: gapminder })
  .createErrorBand({
    x: { field: "year", fieldType: "temporal" },
    y: { field: "life_expect" },
    groupBy: "cluster"
  })
  .encodeColor({
    target: "errorBand",
    field: "cluster",
    scale: { palette: "tableau10" }
  })
  .createGuides();
createErrorBand({
  id?: string;
  target?: string;
  data?: string;
  x?: PositionChannel | StatisticalIntervalChannel | ExplicitIntervalChannel;
  y?: PositionChannel | StatisticalIntervalChannel | ExplicitIntervalChannel;
  groupBy?: string;
  coordinate?: string;
  fill?: string;
  opacity?: number;
  curve?: CurveInterpolation;
  lineCap?: "butt" | "round" | "square";
  lineJoin?: "miter" | "round" | "bevel";
  miterLimit?: number;
  boundaries?: false | {
    stroke?: string;
    strokeWidth?: number;
    strokeDash?: DashStyle | readonly number[];
    opacity?: number;
    curve?: CurveInterpolation;
    lineCap?: "butt" | "round" | "square";
    lineJoin?: "miter" | "round" | "bevel";
    miterLimit?: number;
  };
} = {})
The channel contracts are:
type PositionChannel = {
  field?: string;
  fieldType?: "quantitative" | "temporal";
  scale?: ScaleOptions;
};

type StatisticalIntervalChannel = {
  field?: string;
  center?: "mean" | "median";
  extent?: "stderr" | "stdev" | "ci" | "iqr";
  method?: "normal" | "student-t";
  level?: number;
  scale?: ScaleOptions;
};

type ExplicitIntervalChannel = {
  center: string;
  lower: string;
  upper: string;
  scale?: ScaleOptions;
};
Statistical mode defaults to a mean, two-sided 0.95 Student-t confidence
interval. The independent position field is always part of grouping;
groupBy adds one series field. Group and path order follow first appearance
in the source.
Explicit mode uses the current dataset directly. It retains the center field for the inferred axis title, while the closed area geometry uses lower and upper fields.
Exactly one channel must describe the interval. A vertical band stores y/y2; a horizontal band stores x/x2. Quantitative and temporal independent positions are both supported, including on optional lower and upper boundary lines. For example, a horizontal interval inferred from an existing Cars scatterplot can be authored as:
Contextual fragment. Use an ES module with the imports, data, and prepared resource state described in this section. Caller-provided receivers:
scatterplot. Resolve these names from setup in this fragment or section; alternatives branch from the same base.
scatterplot.createErrorBand({
  x: { field: "Displacement", center: "mean", extent: "ci" },
  y: { field: "Acceleration" },
  groupBy: "Origin",
  boundaries: { stroke: "#334155", strokeWidth: 1.5 }
});
Inference and ownership
If x or y is omitted, the action selects an encoded source by explicit
target, then the current eligible layer, then one unique eligible layer. It
reuses that layer’s data, coordinate, scales, and explicit group encoding.
Two quantitative source axes are ambiguous unless an interval option identifies
the interval axis.
When an explicit channel scale contains only an existing id, that stored
scale definition is reused exactly. Error-band defaults apply only when a new
scale must be created.
The first omitted ID is "errorBand"; statistical rows use
"errorBandIntervalData". A second band requires an explicit ID. The action
records one createErrorBand trace node with wrapped interval-data, area,
the matching atomic position-range action, and grouping children.
fill and opacity default to the area defaults. Field-driven fill remains an
explicit encodeColor call so color, grouping, and legend ownership stay
separate. The same grouped overlay-color composition applies to vertical y/y2
and horizontal x/x2 bands.
curve defaults to "linear" and accepts the shared eight-value line/area
curve vocabulary.
boundaries defaults to false. An object adds deterministic lower and upper
ordinary line layers after the filled band. Stroke, width, dash, and opacity
default to the shared mark color, 1, solid, and 1. Boundary paths inherit
the band curve unless boundaries.curve explicitly overrides it:
Contextual fragment. Use an ES module with the imports, data, and prepared resource state described in this section. Caller-provided receivers:
program. Resolve these names from setup in this fragment or section; alternatives branch from the same base.
program.createErrorBand({
  x: { field: "year", fieldType: "temporal" },
  y: { field: "life_expect" },
  groupBy: "cluster",
  curve: "cardinal",
  boundaries: {
    stroke: "#25364d",
    strokeWidth: 1.4,
    strokeDash: [6, 3],
    opacity: 0.8,
    curve: "step"
  }
});
Boundary layers remain ordinary line resources internally. Chart authors edit them through the owner-level action below rather than constructing generated layer IDs. The create action intentionally accepts one shared boundary recipe.
Editing the band
editErrorBand() changes the stable body appearance:
Contextual fragment. Use an ES module with the imports, data, and prepared resource state described in this section. Caller-provided receivers:
program. Resource selectors used here:target: "errorBand". Resolve these names from setup in this fragment or section; alternatives branch from the same base.
program.removeEncoding({ target: "errorBand", channel: "color" }).editErrorBand({
  x: { field: "year", fieldType: "temporal" },
  y: { field: "life_expect", center: "mean", extent: "ci" },
  groupBy: "cluster",
  statistics: { extent: "ci", level: 0.9 },
  fill: "#7dd3fc",
  opacity: 0.34,
  curve: "cardinal"
});
A constant fill conflicts with active color. Remove the color encoding first,
as above, to clear its legend consistently. Conversely, a band created or edited
with explicit fill rejects encodeColor until editErrorBand({ fill: false })
clears that override. This edit-only reset restores encoded color or the theme
default; it does not make the band transparent. Creation still requires a string
fill. statistics: { center?, extent?, method?, level? } creates one
immutable interval revision for statistical owners and rebinds the body and
enabled boundaries. Explicit interval owners reject that option.
Combined role/statistics edits use the same merge as statistics-only edits:
leaving confidence intervals discards inherited method and level.
Explicitly supplying either for another extent is an error.
data, x, and y replace the source and position/interval roles in the same
preflight. They may switch orientation or convert between statistical and
explicit { center, lower, upper } intervals while preserving body and boundary
IDs. groupBy replaces path grouping and groupBy: false removes it. Active
color, selection, and highlight dependencies must remain valid and are replayed
on the revised result.
Use boundaries: false on editErrorBand() to disable both boundaries; the
call is also valid when they are already absent. A boundary appearance object
creates or edits both owned lines:
Contextual fragment. Use an ES module with the imports, data, and prepared resource state described in this section. Caller-provided receivers:
program. Resolve these names from setup in this fragment or section; alternatives branch from the same base.
program.editErrorBand({
  boundaries: { stroke: "#334155", strokeWidth: 1.5 }
});
editErrorBandBoundary() edits or creates one or both owned boundaries:
Contextual fragment. Use an ES module with the imports, data, and prepared resource state described in this section. Caller-provided receivers:
program. Resolve these names from setup in this fragment or section; alternatives branch from the same base.
program.editErrorBandBoundary({
  boundary: "both",
  stroke: "#0369a1",
  strokeWidth: 2,
  strokeDash: [6, 3],
  opacity: 0.8,
  curve: "cardinal"
});
boundary accepts "both", "lower", or "upper" and defaults to
"both". If a selected boundary was not created initially, the action creates
it from the owner’s stored data, fields, coordinate, grouping, and scales.
Existing selected boundaries retain omitted style properties; an unselected
boundary remains untouched. Omit target only when one owner is unambiguous.
Documentation provenance
293 actions · sha256:e755591a2e5f5e2b494867583876e28020a478c5220b77bdc6ad469a6224891d