Published-release documentation · release compatibility
Scatterplot Recipe
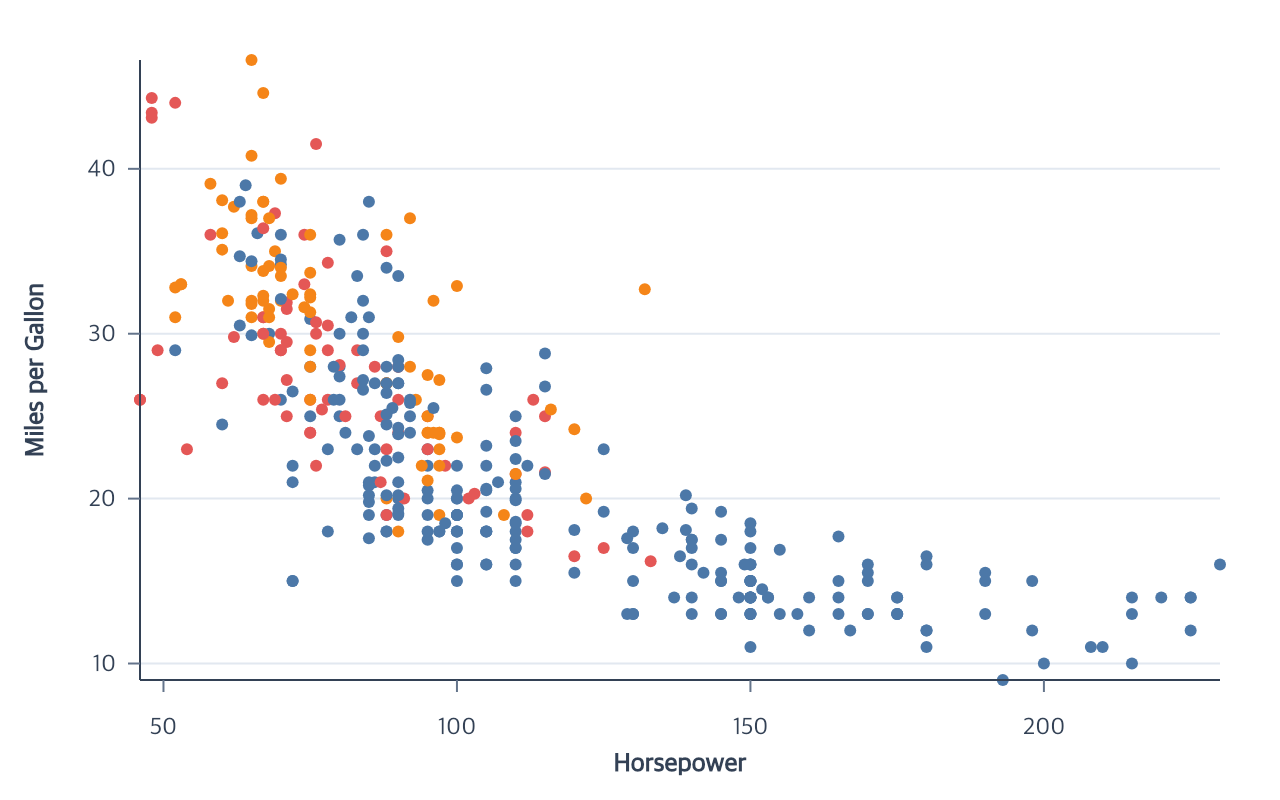
Minimal flow
Runnable: install ggaction and provide the named data array as plain row objects.
import { chart } from "ggaction";

const program = chart()
  .createCanvas()
  .createData({ values })
  .createScatterPlot({ x: "x", y: "y" });
You must decide
- Dataset values
- Quantitative x and y fields
Add color: "group", size: "amount", or shape: "category" to the same
call for field-driven appearance. The default point radius is 3.
The library infers
- Current dataset for the facade and current mark for later actions
- Stable internal role IDs for the first dataset and point mark
- Quantitative linear scales named
xandy - The
mainCartesian coordinate - Plot-bound ranges, axes, and horizontal grid
Point color, shape, and size legends are created when those encodings are
present. Multiple compatible marks or scales require explicit target or
scale IDs.
Continue
Scatterplot tutorial · Basic Charts · Quantitative positions · Constant appearance
Documentation provenance
293 actions · sha256:e755591a2e5f5e2b494867583876e28020a478c5220b77bdc6ad469a6224891d