Published-release documentation · release compatibility
Error Bar Chart Tutorial
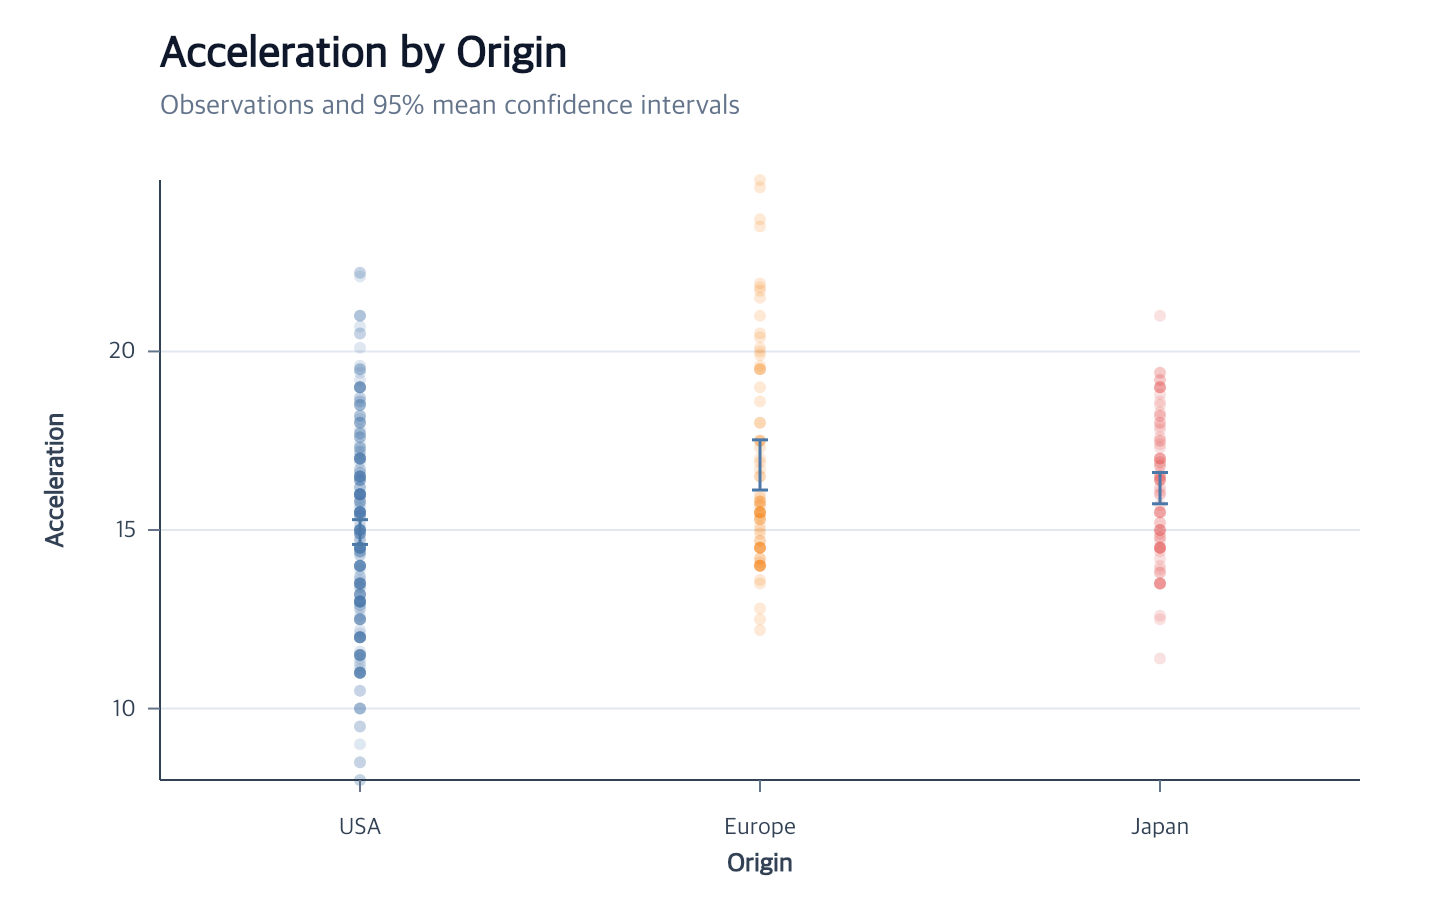
This chart keeps individual car observations visible while summarizing
acceleration by Origin. createErrorBar() infers the encoded point layer,
derives one mean and two-sided 95% Student-t confidence interval per group,
then creates concrete vertical rules and fixed-width caps. The source rows remain immutable.
The repository contains a
runnable browser example
and its complete program.
Start with the Vite project from Getting Started, then place the tutorial dataset in Vite’s public directory:
mkdir -p public
curl --fail --location https://raw.githubusercontent.com/ggaction/ggaction/6422776b0a379c8c89809f41b434f366fbc1f143/data/cars.json --output public/cars.json
Complete program
import { chart, render } from "ggaction";

const response = await fetch("/cars.json");
if (!response.ok) throw new Error(`Failed to load cars: ${response.status}`);
const cars = await response.json();

const program = chart()
  .createCanvas({
    width: 720,
    height: 460,
    margin: { top: 90, right: 40, bottom: 70, left: 80 }
  })
  .createData({ values: cars })
  .createPointMark()
  .encodeX({ field: "Origin", fieldType: "ordinal" })
  .encodeY({ field: "Acceleration" })
  .encodeColor({ field: "Origin" })
  .encodeRadius({ value: 3 })
  .encodeOpacity({ value: 0.18 })
  .createErrorBar()
  .createGuides()
  .createTitle({
    text: "Acceleration by Origin",
    subtitle: "Observations and 95% mean confidence intervals"
  });

render(program, document.querySelector("#chart").getContext("2d"));
What the actions establish
| Stage | Semantic result | Graphical result |
|---|---|---|
| Point encodings | One observation layer grouped by Origin | Translucent colored observations |
createErrorBar |
Immutable grouped interval rows and three rule layers | Main intervals and two 8px caps per Origin |
createGuides |
Ordinal x, quantitative y, axes, horizontal grid | Grid behind rules and axes above them |
createTitle |
Title and subtitle | Plot-aligned text above the chart |
The first dataset ID, error-bar ID, source, coordinate, grouping, statistic, and interval appearance are inferred from the encoded point layer.
Add intervals to an existing layer
If a compatible layer already has x and y encodings, the shortest call is
createErrorBar():
const overlay = chart()
  .createCanvas()
  .createData({ values: cars })
  .createPointMark()
  .encodeX({ field: "Origin", fieldType: "ordinal" })
  .encodeY({ field: "Acceleration" })
  .createErrorBar();
The interval reuses that layer’s data, coordinate, and position scales. This works by encoded-layer capability rather than by a point-specific rule.
Key action trace
program
├─ createErrorBar
│  ├─ createIntervalData
│  ├─ createRuleMark
│  ├─ encodeX / encodeY / encodeY2
│  ├─ appearance encodings
│  ├─ createErrorBarCap
│  └─ createErrorBarCap
├─ createGuides
└─ createTitle
Run and continue
- Serve the repository root and open
examples/cars-error-bar/. - Read the exact error-bar options.
- Use Data when interval rows are needed independently.
Documentation provenance
293 actions · sha256:e755591a2e5f5e2b494867583876e28020a478c5220b77bdc6ad469a6224891d