Published-release documentation · release compatibility
Gradient Plot Recipe
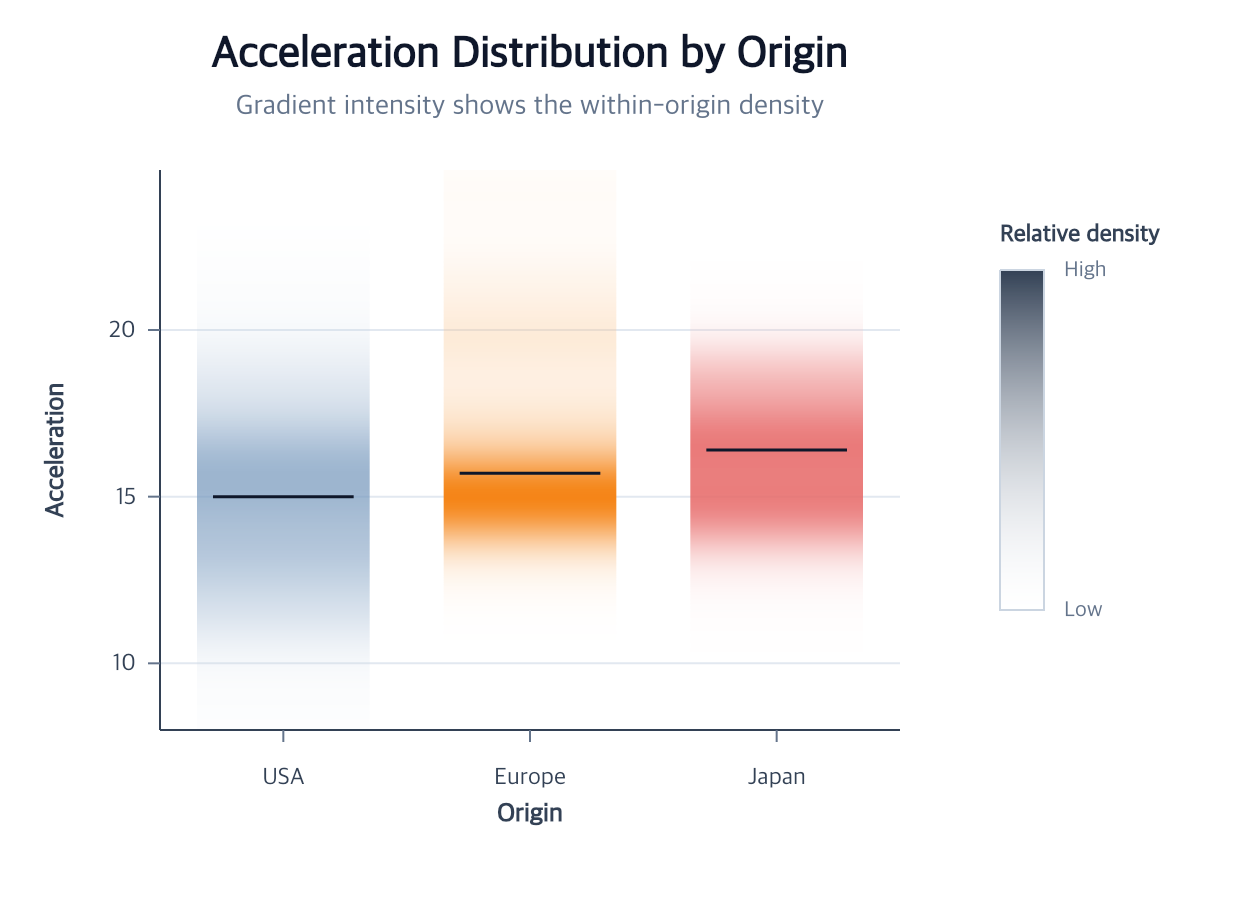
Minimal flow
Runnable: install ggaction and provide the named data array as plain row objects.
import { chart } from "ggaction";

const program = chart()
  .createCanvas({ margin: { top: 70, right: 150, bottom: 70, left: 70 } })
  .createData({ values: cars })
  .createGradientPlot({
    x: { field: "Origin", fieldType: "nominal" },
    y: { field: "Acceleration", fieldType: "quantitative" }
  })
  .encodeColor({ field: "Origin" });
cars contains plain rows with non-empty categorical Origin and finite
numeric Acceleration. Use axis option objects for this facade; the nominal
and quantitative roles determine the orientation. Provide several observations
per origin so each density profile describes a distribution.
You must decide
- The categorical and quantitative fields
- Whether the category belongs on x or y
- Whether category hue should supplement density intensity
The library infers
- A sampled Gaussian density profile for each category
- Band-relative strip width and a median center rule
- Cartesian axes, grid, and a relative-density legend
Use editGradientPlot to change bandwidth, sample count, strip width, paint,
or center statistic without rebuilding the program manually.
Continue
Gradient Plots API · Box-plot recipe · Violin-plot recipe
Documentation provenance
293 actions · sha256:e755591a2e5f5e2b494867583876e28020a478c5220b77bdc6ad469a6224891d