Published-release documentation · release compatibility
Rendering
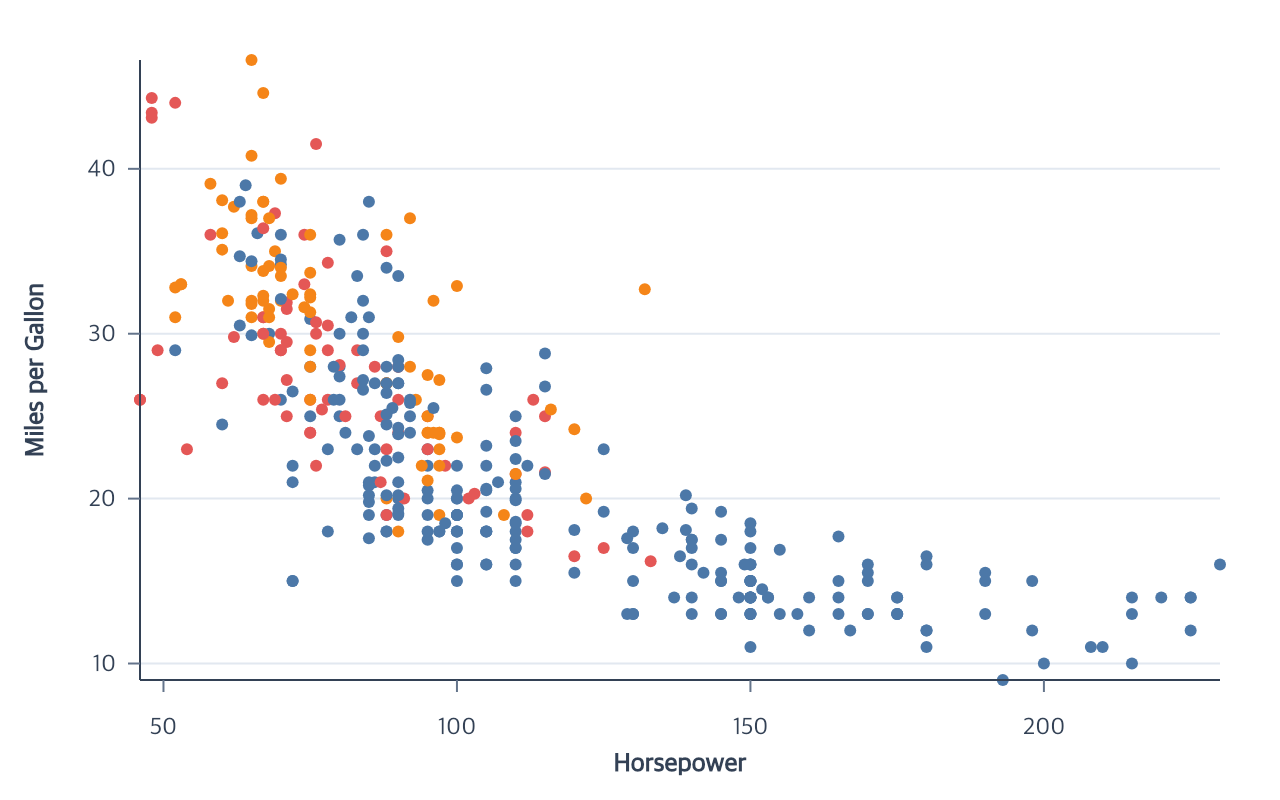
Render one fully materialized ChartProgram to Browser Canvas, a browser-safe
SVG string, a Node PNG file, or a single-page vector PDF. Choose the target
based on where the output runs and how it will be consumed.
Canvas and SVG need only npm install ggaction. For Node PNG and PDF, install
the optional native backend with npm install ggaction @napi-rs/canvas.
Importing the PNG/PDF entry works without the backend; calling it then reports
the required installation command. No dependency is installed automatically.
At a glance
| Target | Environment | Shortest call | Use when |
|---|---|---|---|
| Browser Canvas | Browser | render(program, context) |
Drawing into an existing interactive page |
| SVG | Browser or Node.js 20+ | renderToSVG(program) |
Embedding or saving scalable markup |
| Node PNG | Node.js 20+ | renderToPNG(program, { output }) |
Producing a raster file at an explicit pixel density |
| Node PDF | Node.js 20+ | renderToPDF(program, { output }) |
Producing a selectable, single-page vector document |
Rendering consumes a completed program’s graphicSpec. It does not read
datasets, semantic encodings, context, or trace to infer missing output.
First render
Run this ES module in a bundler-based browser page containing <canvas id="chart"></canvas>:
Executable complete. Use a browser ES module with a canvas element whose id is chart; all input rows are included.
import { chart, render } from "ggaction/basic";
const program = chart().createCanvas({ width: 480, height: 320 })
  .createData({ values: [{ x: 1, y: 2 }, { x: 2, y: 4 }] })
  .createScatterPlot({ x: "x", y: "y" });
render(program, document.querySelector("#chart").getContext("2d"));
The result has two points. The output adapters below consume this same completed program. Text measurement is an optional authoring step described after the output examples.
Automated environment checks
CI and release qualification exercise these environments against installed packages. The release jobs all consume the same candidate tarball.
| Environment | Checks |
|---|---|
| Ubuntu, Node.js 20, 22, and 24 | Package installation, public entries, declarations, and consumer workflows |
| macOS and Windows, Node.js 22 | Native PNG/PDF buffers and files, image dimensions, SVG, and snapshot round trips |
| Chromium, Firefox, and WebKit supplied by the pinned Playwright dependency | Canvas and SVG clipping, gradients, text alignment, resizing, DPR 1 and 2, accessible labels, and SVG downloads |
Browser checks use a shared representative graphic scene; they do not imply coverage of every browser release, operating system, font, or device. Native checks use the optional Canvas backend installed on each runner.
SVG, PNG, and PDF options must be plain objects (including objects with a null
prototype). Unknown option keys are rejected before output is written; for
example, use pixelRatio, not pixelratio, for PNG density.
Complete example program
Every rendering fragment below continues from this complete program:
Contextual fragment. Use an ES module with the imports, data, and prepared resource state described in this section. Resolve these names from setup in this fragment or section; alternatives branch from the same base.
import { chart } from "ggaction";

const observations = [
  { displacement: 97, acceleration: 14.5, origin: "Japan" },
  { displacement: 140, acceleration: 15.5, origin: "USA" },
  { displacement: 86, acceleration: 16.4, origin: "Japan" }
];

const program = chart()
  .createCanvas({
    width: 640,
    height: 400,
    margin: { top: 30, right: 130, bottom: 60, left: 70 }
  })
  .createData({ values: observations })
  .createScatterPlot({
    x: "displacement",
    y: "acceleration",
    color: "origin",
    shape: "origin"
  });
Browser Canvas
In a browser page containing <canvas id="chart"></canvas>, render with its 2D
context:
Contextual fragment. Use an ES module with the imports, data, and prepared resource state described in this section. Resolve these names from setup in this fragment or section; alternatives branch from the same base.
import { render } from "ggaction";

const context = document.querySelector("#chart").getContext("2d");
render(program, context);
The optional pixelRatio increases physical output density while retaining
logical chart coordinates. For an HTML Canvas, ggaction also preserves the
logical CSS width and height while enlarging the backing store:
Contextual fragment. Use an ES module with the imports, data, and prepared resource state described in this section. Resolve these names from setup in this fragment or section; alternatives branch from the same base.
render(program, context, { pixelRatio: 2 });
Raster backing dimensions are the logical dimension multiplied by
pixelRatio, rounded to the nearest whole pixel with a minimum of one pixel.
This leaves fractional logical dimensions unchanged in CSS and SVG output.
Canvas and PNG preflight the complete allocation before changing the backing
store: each physical side is limited to 32767 pixels and the complete image
to 16777216 pixels.
An explicit bar blend: "difference" also allocates one transparent glyph source
within its visible stroke bounds. It obeys the same per-surface limits, including
pixel ratio and nested clips, and is reused while painting individual bars.
Unsupported custom Canvas contexts fail before resizing or clearing the chart;
ordinary drawing does not require the extra surface/compositing capabilities.
SVG output
The browser-safe SVG entry returns a complete SVG document string without reading the DOM or filesystem. Assign it to a trusted application container or save the returned string with the file API available in your environment.
Contextual fragment. Use an ES module with the imports, data, and prepared resource state described in this section. Resolve these names from setup in this fragment or section; alternatives branch from the same base.
import { renderToSVG } from "ggaction/svg";

const svg = renderToSVG(program, {
  title: "Quarterly revenue",
  description: "Revenue by quarter",
  resourceNamespace: "quarterlyRevenue"
});
The root width, height, and viewBox use the program’s logical Canvas
dimensions. Optional title and description strings become escaped
<title> and <desc> children. Repeated calls with the same program and
options return the same string. Resource IDs use a deterministic hash of
graphicSpec by default. When multiple copies of the same chart will coexist
in one HTML document, give each call a distinct resourceNamespace so their
gradient and clipping IDs cannot collide. It must start with an ASCII letter
and contain only ASCII letters, numbers, _, or -.
For example, a browser application can place the generated document in an existing output container:
Contextual fragment. Use an ES module with the imports, data, and prepared resource state described in this section. Resolve these names from setup in this fragment or section; alternatives branch from the same base.
document.querySelector("#svg-output").innerHTML = svg;
PNG output
The Node-only entry point writes a completed program directly to PNG.
Contextual fragment. Use an ES module with the imports, data, and prepared resource state described in this section. Resolve these names from setup in this fragment or section; alternatives branch from the same base.
import { renderToPNG } from "ggaction/png";

const result = await renderToPNG(program, {
  output: "./output/chart.png",
  pixelRatio: 2
});
Missing output directories are created. A logical 640×400 chart at ratio 2
produces a 1280×800 image. The result contains the absolute output, physical
width and height, pixelRatio, and byte count.
PNG in memory
For HTTP responses, object storage, or other host-controlled output, use the
Node-only renderToPNGBuffer(program, { pixelRatio }) from ggaction/png.
Options are optional and accept only pixelRatio (default 1). The result is
{ buffer, width, height, pixelRatio, bytes }, where buffer is a caller-owned
Uint8Array and dimensions are physical pixels. Each call returns independent
bytes. The result object is frozen; its byte array remains writable.
Canvas drawing and geometry validation are synchronous. PNG encoding runs asynchronously in the native backend; the returned Promise does not move chart authoring or Canvas drawing off the JavaScript thread.
PDF output
The Node-only PDF entry writes one completed chart as one vector PDF page:
Contextual fragment. Use an ES module with the imports, data, and prepared resource state described in this section. Resolve these names from setup in this fragment or section; alternatives branch from the same base.
import { renderToPDF } from "ggaction/pdf";

const result = await renderToPDF(program, {
  output: "./output/chart.pdf",
  metadata: {
    title: "Quarterly revenue",
    author: "Example",
    subject: "Revenue by quarter",
    keywords: ["revenue", "quarterly"]
  }
});
Missing output directories are created. The page width and height in PDF points
use the program’s logical Canvas dimensions. The native vector backend
represents page boxes as positive integers, so PDF output requires each logical
dimension to be an integer no larger than 16777216; unsupported dimensions
are rejected before replacing the output file. The frozen result contains the
absolute output, logical width and height, pages: 1, and byte count.
Metadata is optional; it accepts only non-empty title, author, and subject
strings plus an array of non-empty keywords.
Text remains selectable/searchable PDF text. Paths, strokes, fills, clipping,
opacity, dashes, and linear gradients remain vector output. An explicit bar
blend: "difference" or explicit legend recipe-layer opacity rasterizes only
that glyph’s fill-and-outline source for native PDF compositing; the rest of the
page stays vector. The adapter does not
rasterize the complete chart or accept pixelRatio. Nested Canvas translations apply to
text as well as shapes, so concat children with different plot margins retain
their distinct title and axis-label origins in PDF output.
The current renderers support concrete canvas, collection, circle, rect, line,
text, and M/L/C/Z command-path graphics. Path and line strokes may use concrete
dash arrays. They validate values with the same concrete property contract used
by editGraphics. The paint string "none" draws no fill or stroke in every backend,
including text fill and Canvas backgrounds. It never reuses an earlier drawing color.
Rect and closed-path fills may be solid strings or item-local linear-gradient
paint values. Gradient endpoints are normalized against the final fill geometry;
path stroke width does not expand that coordinate box. The renderer creates the
Canvas gradient only for the current draw call and never stores backend objects
in graphicSpec.
Canvas, PNG, and PDF share a native drawing backend. Before creating or changing
native output, they require every geometry and style number passed to that
backend—including path controls, nested translations, stroke/dash sizes, text
size/rotation, and resolved gradient endpoints—to have magnitude no greater
than 16777216 (2^24). Derived rect/circle and nested-clip extents, gradient
direction lengths, cumulative translations, and pixel-ratio-scaled values use
the same boundary. SVG remains browser-safe string serialization and preserves
the complete finite JavaScript number range.
Line curve actions resolve interpolation into those commands before rendering.
Canvas, SVG, and PDF execute L and cubic C segments but do not read curve
names or calculate control points.
PDF in memory
The Node-only renderToPDFBuffer(program, { metadata }) from ggaction/pdf
accepts the same optional metadata as file output and returns
{ buffer, width, height, pages: 1, bytes }. Options may be omitted. The
caller-owned Uint8Array contains one vector PDF page; dimensions are logical
PDF points. The result object is frozen and its bytes remain writable.
Both memory functions reject output; PDF also rejects pixelRatio. File
functions call their corresponding memory function before creating directories
or replacing files. PDF construction and encoding are synchronous even though
the public function returns a Promise. Use a host worker for expensive jobs.
Errors and limitations
Rendering never reads semanticSpec. Every drawable property must already be
concrete. Canvas/PNG pixelRatio must be positive at native precision, no
greater than 16777216, and produce physical dimensions within the raster
limits above. PDF is vector output and does not accept pixelRatio, but its
page and drawing geometry use the Canvas-backed native limits. Native numeric
range failures are rejected before Canvas mutation or PNG/PDF file replacement.
SVG uses neither native nor raster limits. PDF options and metadata use closed
key sets. SVG resourceNamespace follows the identifier form above, and SVG
text, attributes, titles, and descriptions reject characters that XML 1.0
cannot represent; emoji, joiners, variation selectors, and right-to-left text
remain unchanged.
Accessible data alternatives
exportAccessibleData(program, { target? }) from ggaction/accessibility works in
Browser and Node with Full or Basic editable programs. It returns a deeply frozen
{ schemaVersion: 1, title, views } without changing the program or its trace.
title is the semantic title string or null.
alternative. Use an ES module with the imports, data, and prepared resource state described in this section. Resource selectors used here:
target: "sales". Resolve these names from setup in this fragment or section; alternatives branch from the same base.
import { chart } from "ggaction";
import { exportAccessibleData } from "ggaction/accessibility";

const program = chart().createCanvas()
  .createData({ values: [
    { quarter: "Q1", revenue: 12 }, { quarter: "Q1", revenue: 18 },
    { quarter: "Q2", revenue: 20 }
  ] })
  .createBarPlot({ id: "sales", x: "quarter",
    y: { field: "revenue", aggregate: "mean" }, guides: false });
const alternative = exportAccessibleData(program, { target: "sales" });
console.log(alternative.views[0]);
The first quarter is one aggregated bar with endpoints 0 and 15, rather than two source rows. The second bar has endpoints 0 and 20.
Each owner view has ownerId, markType, columns, rows, and units. A column
has a unique key, semantic channel role, and component mark ID, with field,
aggregate, and unit when applicable. Keys combine component ID and channel
with :. A row has component, a series field/value record, and values keyed
by those column keys. Composite owners include their owned graphical components
in the same view; rows from different components may use different columns.
Absent values remain absent. Temporal position values use UTC milliseconds and
corresponding columns declare unit: "utc-milliseconds"; other units are not
guessed. Area layouts can also supply lower and upper endpoint roles. Parallel
coordinate dimensions use their field names as column roles.
Omitting target exports every stable chart owner in semantic order. An explicit
target must name a stable owner; requesting an owned component reports its owner.
A composition returns child views in composition order, each with ownerId,
kind: "composition-child", title, and nested views. Facet children also have
a facet field/value record. Grid facets contain both row and column fields;
repeats contain repeatField and channel. To select a mark within a composition,
pass the explicit child program to this function. A composition-level target is
rejected instead of choosing among repeated IDs.
Point, bar, histogram, line, area, arc, rule, tick, rect, and their supported composite owners use final materialized data. This includes aggregate cells, bin endpoints, ordered path points, stack endpoints, error intervals, and final mark filters. Attached text labels repeat owner data and do not create additional views. Standalone text marks and custom unsupported owners raise an error identifying the owner; the function never silently returns a partial set of views. Incomplete marks and render-only snapshots are rejected. Empty charts return an empty list.
The output describes the authored chart data, including data outside a clipped
viewport or styled with zero opacity. It does not reverse scale mappings from
pixels or infer units, prose, missing observations, or statistical explanations.
The host supplies meaningful captions, HTML tables, and ARIA relationships. Use
DOM textContent for user-controlled titles, column labels, and values; do not
insert them as HTML. Keep the alternative synchronized by exporting the updated
program after an edit.
Explicit whole-glyph opacity
Concrete rect/path nodes accept blend:'normal' as an explicit whole-glyph
source-over instruction; circles accept only that normal marker. The renderer
paints fill and outline together, attenuates the source once, and composites it.
This marker is emitted for explicit legend recipe-layer opacity. Omission keeps
legacy painting unchanged; line/text/containers do not accept blend markers.
The bar action’s blend:'normal' remains a semantic reset which removes its
optional concrete blend field. Normal does not enable circle difference blending.
Transition scenes
createTransitionScene(program) from ggaction/scene is a read-only extension API.
It returns a frozen, structured-cloneable version-1 scene with native width and
height, SVG definitions, and ordered nodes. Each node contains an opaque
key, concrete type, path topology signature, escaped SVG fragment, absolute
parent offset, and intersected canvas clip rectangle. Keys are correspondence
hints, not editable graphic addresses. Renderers still consume concrete graphics.
Contextual fragment. Use an ES module with the imports, data, and prepared resource state described in this section. Resource selectors used here:
data: "data". Resolve these names from setup in this fragment or section; alternatives branch from the same base.
import { chart } from 'ggaction';
import { createTransitionScene } from 'ggaction/scene';
const program = chart().createCanvas({ width: 600, height: 400 })
  .createData({ id: 'data', values: [{ x: 1, y: 2 }, { x: 2, y: 3 }] })
  .createScatterPlot({ id: 'points', data: 'data', x: { field: 'x' }, y: { field: 'y' } });
const scene = createTransitionScene(program);
The optional @ggaction/transition package owns browser playback, timing,
interruption and reduced-motion behavior. Creating a scene does not append an
action or modify a program. Scene extraction shares an ordered concrete traversal; version 1 additionally serializes SVG.
Point/member correspondence survives filters, reordered rows and facet placement;
identical records receive occurrence keys. Selection resolvers supply membership
for supported aggregate and series marks. Changed membership, unsupported
selection structures and changed path topology use conservative replacement
rather than an invented data relationship. Arbitrary data-transform lineage and
many-to-one morphs are not inferred. Keys are opaque and only comparable within
a related dataset/program history, not globally persistent row identifiers.
Canvas transition scenes
createTransitionScene(program, { format: 'canvas' }) returns a frozen version-2
scene. It shares version-1 keys, order, topology, offsets and clips, but each node
contains concrete properties instead of an SVG fragment. Properties include
resolved path commands, multiline text, gradients and blend settings. It contains
no DOM, Canvas resources, semantic compilation or data tables. The default format
remains SVG/version 1; unknown formats are rejected.
Canvas nodes also retain optional clips: the explicit outer-to-inner clip
frames in global logical coordinates. The root physical viewport is implicit.
This preserves fractional-edge coverage and owner clips inside nested Canvases;
clip remains their intersected bounds. If an intermediate node omits clips,
its single clip rectangle is used. Retain the supplied frames when animating
an unchanged clipping hierarchy.
renderTransitionScene(scene, context, { pixelRatio = 1 } = {}) paints version-2
scenes with the ordinary Canvas renderer. It uses the same primitive validation,
paint order, nested clipping and isolated blending as render. It sizes and clears
the target Canvas, keeping logical dimensions independent of output density.
Invalid scene versions, duplicate keys and invalid geometry are rejected.
Playback code may supply intermediate concrete properties; this function does
not perform interpolation or schedule frames. Mutable intermediate scenes are
not cached. Each intermediate node must retain a unique key and valid concrete
properties. Do not use keys as editable graphic addresses.
Browser example (with an existing <canvas id="chart"> element):
Contextual fragment. Use an ES module with the imports, data, and prepared resource state described in this section. Resource selectors used here:
data: "data". Resolve these names from setup in this fragment or section; alternatives branch from the same base.
import { chart } from 'ggaction';
import { createTransitionScene, renderTransitionScene } from 'ggaction/scene';
const program = chart().createCanvas({ width: 600, height: 400 })
  .createData({ id: 'data', values: [{ x: 1, y: 2 }, { x: 2, y: 3 }] })
  .createScatterPlot({ id: 'points', data: 'data', x: { field: 'x' }, y: { field: 'y' } });
const scene = createTransitionScene(program, { format: 'canvas' });
renderTransitionScene(scene, document.querySelector('#chart').getContext('2d'), {
  pixelRatio: window.devicePixelRatio
});
Measured text layout
Full charts support applyTextMetrics({ profile }) and removeTextMetrics().
These authoring actions recalculate text layout before rendering. A profile has
exactly schemaVersion: 1, a nonempty id, and a measurements array. Each entry
requires text, fontFamily, fontSize, fontWeight, and width, and may
include fontStyle: "normal" | "italic" (normal when omitted).
The host measures strings in the font it will use. Width is in logical pixels, not output pixels multiplied by device pixel ratio. Font size must be positive; width must be finite and nonnegative. Weight is one of 100, 200, …, 900. Duplicate text/family/size/weight/style combinations are rejected. Empty profiles and empty strings are valid.
This complete browser example waits for fonts and measures the full string and word candidates that its title wrapping will use:
Contextual fragment. Use an ES module with the imports, data, and prepared resource state described in this section. Resolve these names from setup in this fragment or section; alternatives branch from the same base.
import { chart } from "ggaction";

await document.fonts.ready;
const context = document.createElement("canvas").getContext("2d");
const fontFamily = "sans-serif";
const fontSize = 20;
const fontWeight = 400;
context.font = `${fontWeight} ${fontSize}px ${fontFamily}`;
const profile = {
  schemaVersion: 1,
  id: "page-fonts",
  measurements: ["Alpha Beta", "Alpha", "Beta"].map(text => ({
    text, fontFamily, fontSize, fontWeight,
    width: context.measureText(text).width
  }))
};
const measured = chart()
  .applyTextMetrics({ profile })
  .createCanvas({ width: 500, height: 350, margin: 80 })
  .createTitle({
    text: "Alpha Beta", maxWidth: 100,
    titleStyle: { fontFamily, fontSize, fontWeight }
  });
const estimated = measured.removeTextMetrics();
Matching uses the exact string, family, size, and normalized weight. Omitted
family uses sans-serif; omitted/normal weight is 400 and bold is 700.
Numeric weights use the renderer’s rounding to 100 and clamping to 100–900;
strings "100" through "900" match those numeric values. Unmatched strings or
styles, including relative CSS weights, use the existing deterministic estimate.
Wrapping may measure partial words and candidate lines; include those strings
when exact measurements are needed for them.
Applying clones and freezes the profile and replaces any active profile. It recalculates titles, axes, legends, labels, and composition layout without changing typography. A composition applies the profile to its root and nested children, adopting Basic children as Full snapshots; replacement/insertion children and retained facet/repeat edits inherit it. Removal clears the profile throughout that composition and restores estimates; it does not restore earlier child profiles. Removing without an active profile is an error. Failed layout leaves the original program intact.
Later domain edits and source revisions use the stored profile. Editable persistence preserves and validates it. Render-only snapshots contain the already laid-out graphics. Changing the original profile or loading a font later does not change an existing program. Apply a new measured profile to update layout after fonts change. Canvas, SVG, PNG, and PDF draw the resulting text graphics; they do not rewrap or replace the authoring measurements.
Related
Canvas · Semantic and graphical state · Primitive extension API
Documentation provenance
293 actions · sha256:e755591a2e5f5e2b494867583876e28020a478c5220b77bdc6ad469a6224891d