Recipe
Program composition
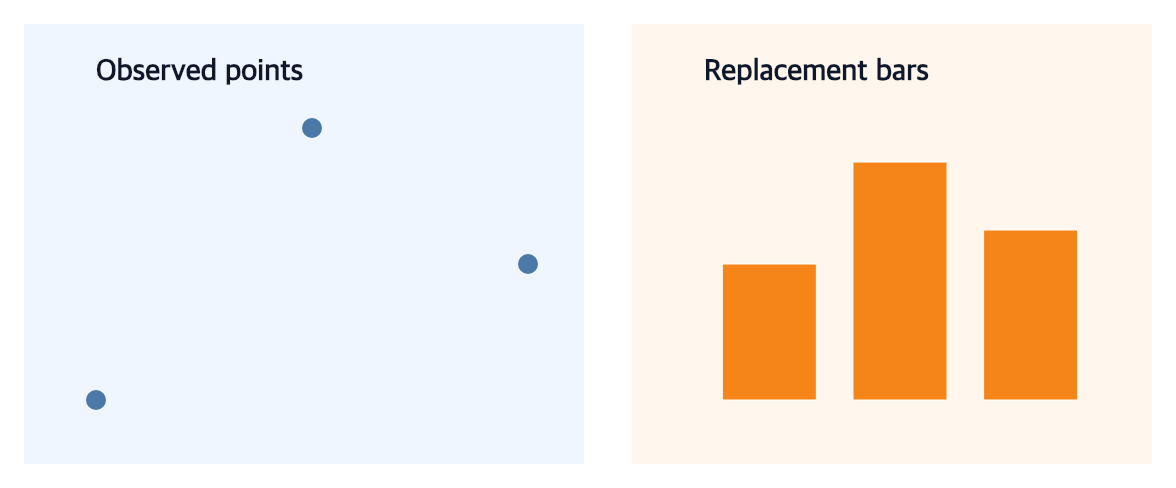
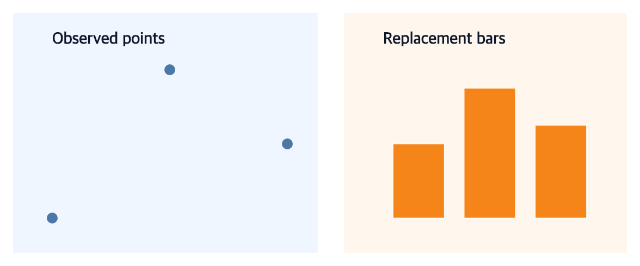
Compare distinct child panels, edit their layout, and replace one stable slot.
hconcat
editCompositionLayout
replaceCompositionChild
View full size
Published-release documentation · release compatibility
This curated set highlights complete, representative charts. Every card links to the canonical tutorial, recipe, or API page that owns the chart. Use the filters to narrow the analytical relationship you want to express.
Compare distinct child panels, edit their layout, and replace one stable slot.
hconcat
editCompositionLayout
replaceCompositionChild
View full size
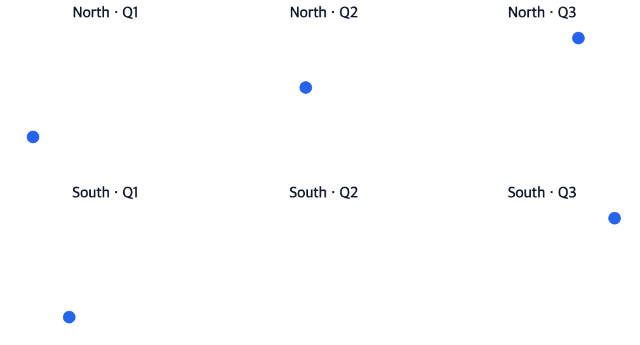
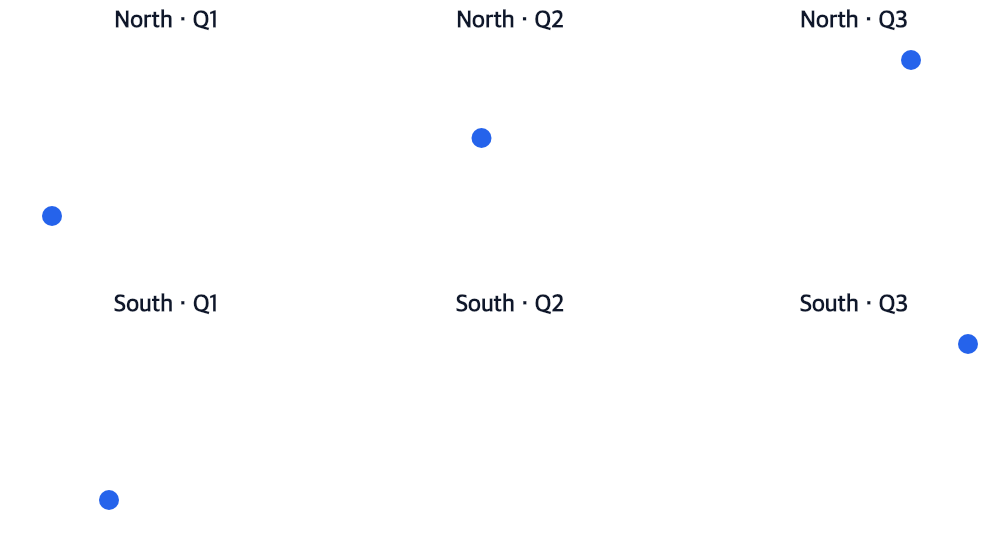
Cross two fields into an observed or complete grid with stable cell coordinates.
facetGrid
editFacetSource
editCompositionLayout
View full size
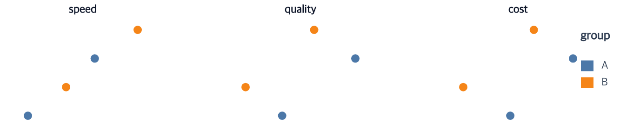
Repeat one positional encoding across fields with explicit scale and guide policies.
repeatCharts
editFacetSource
editCompositionLayout
View full size
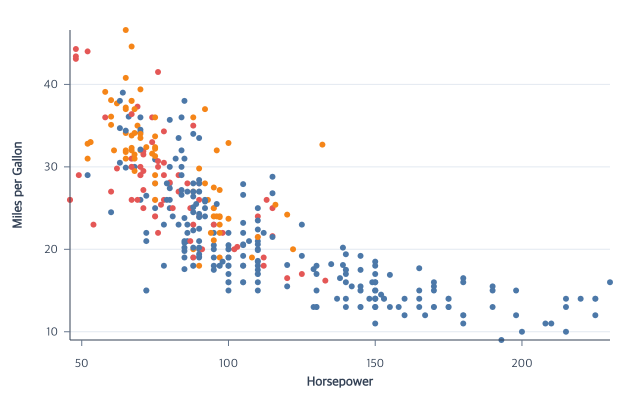
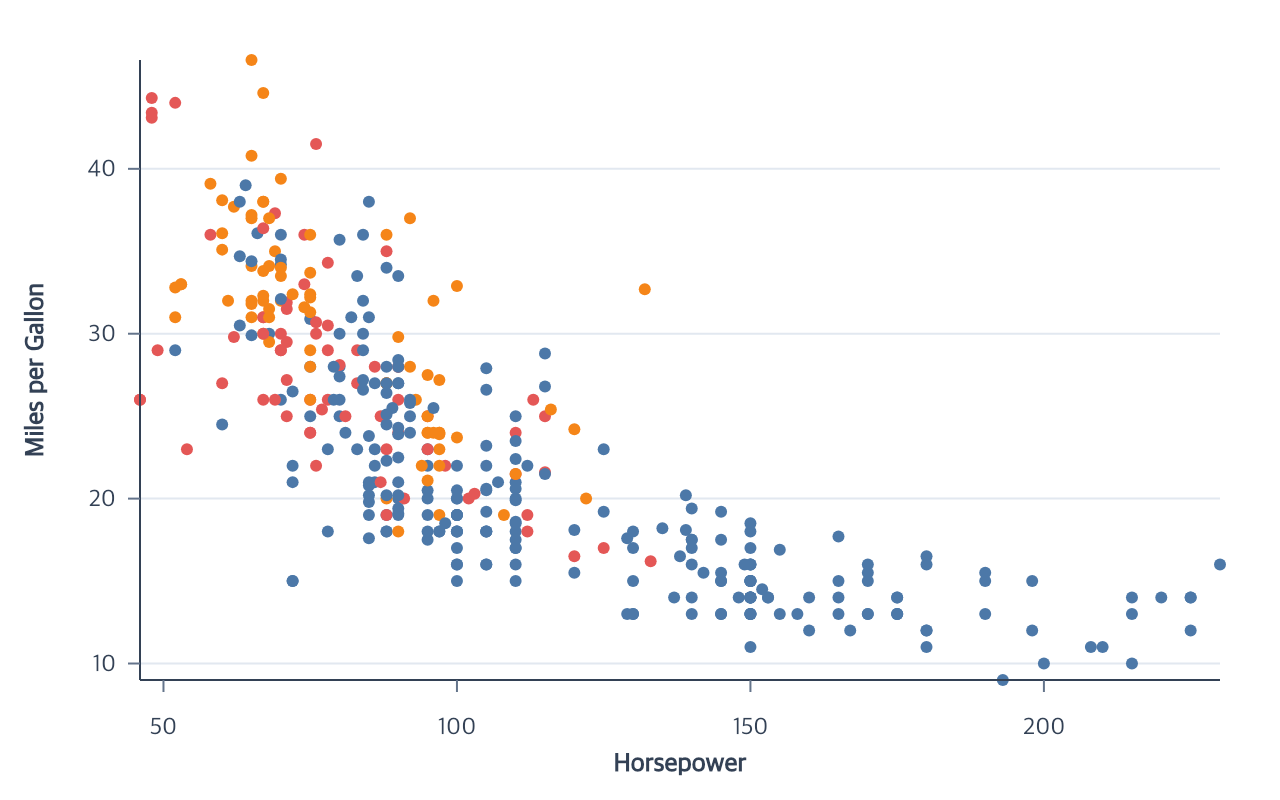
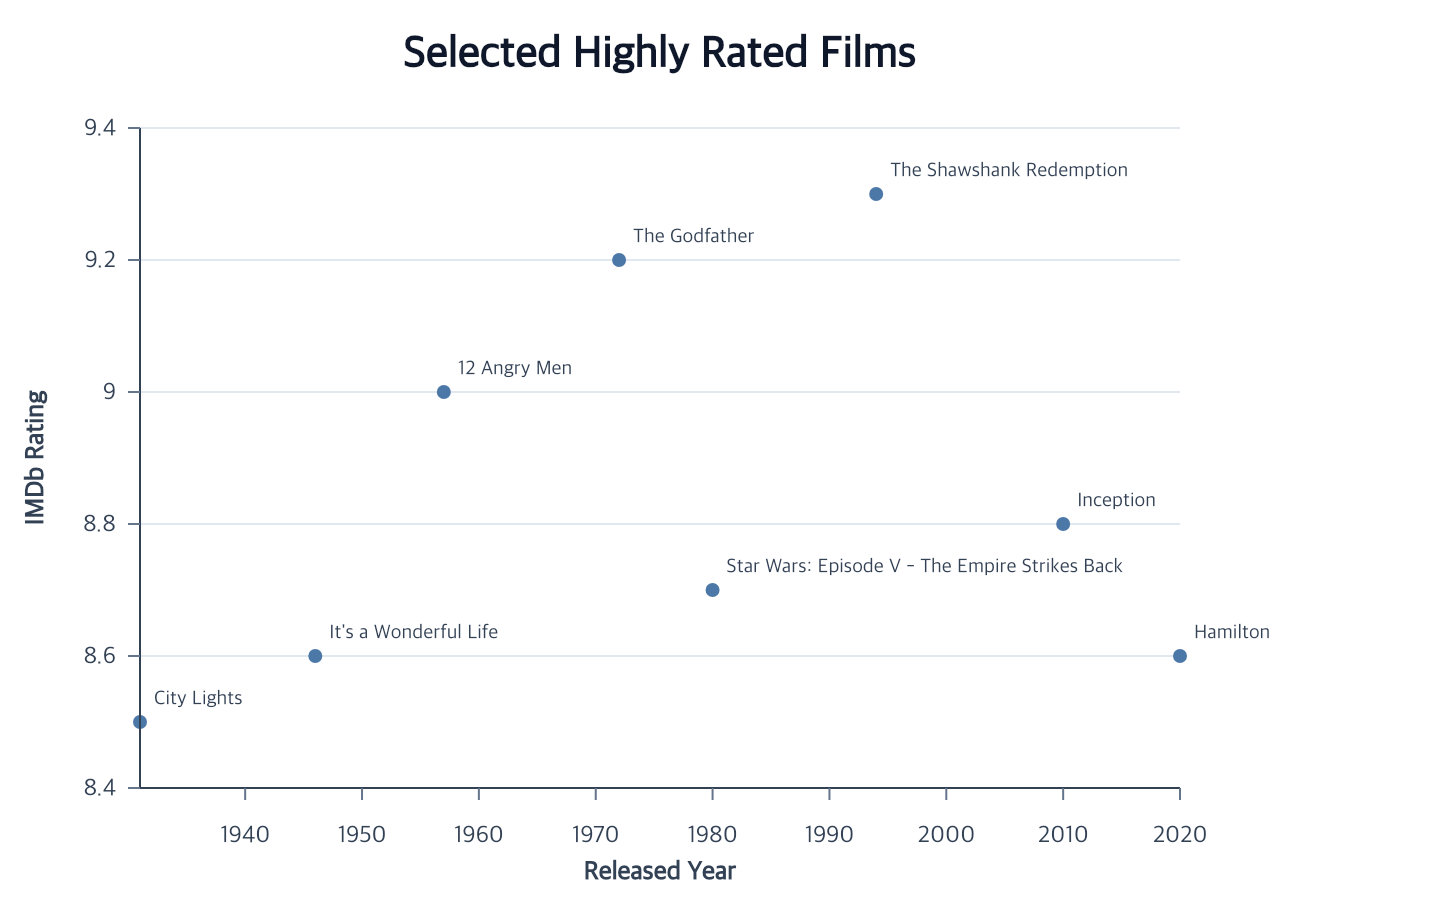
Compare two quantitative fields and encode a category with color.
createScatterPlot
View full size
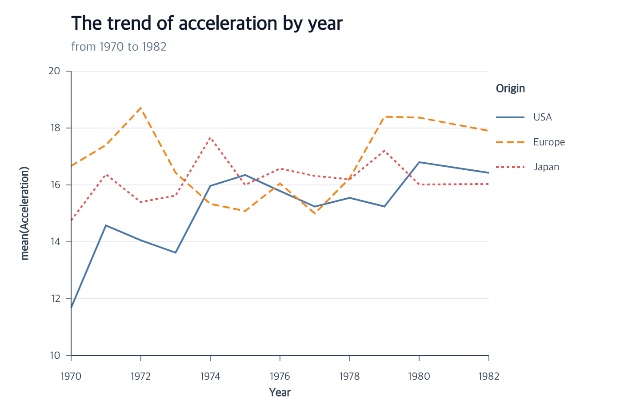
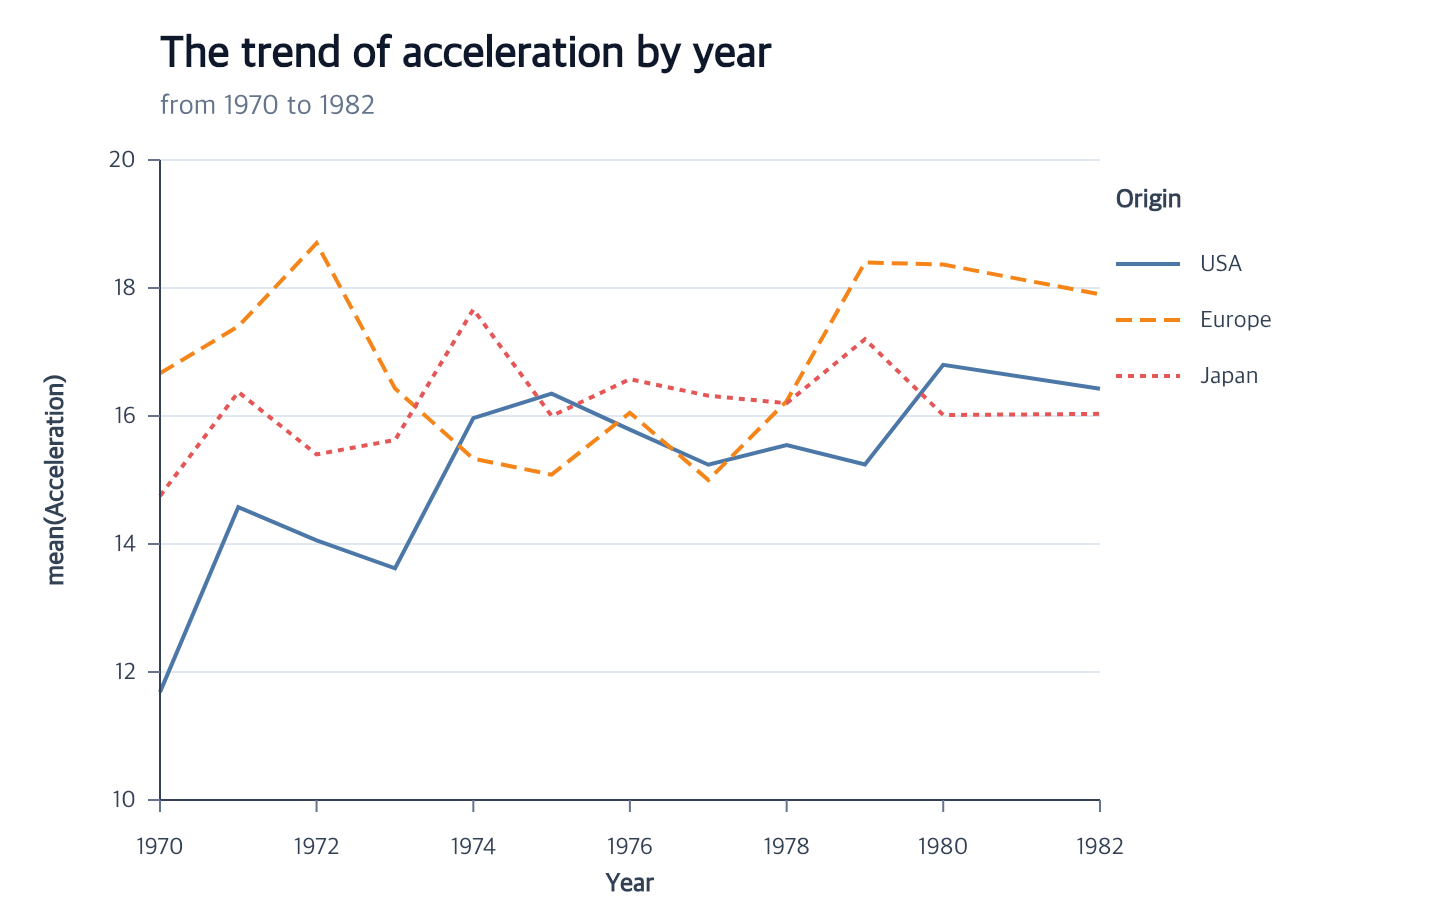
Aggregate values over time and split the result into series.
createLinePlot
View full size
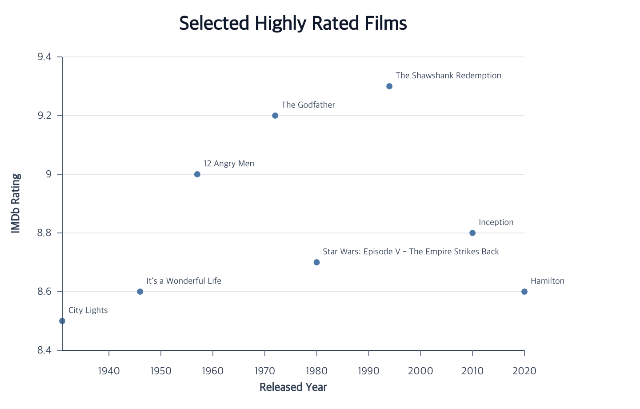
Attach readable data labels to final point, bar, or rule items.
createTextMark
encodeText
editTextMark
View full size
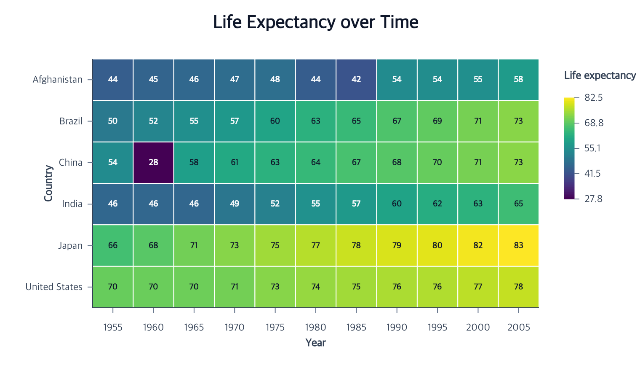
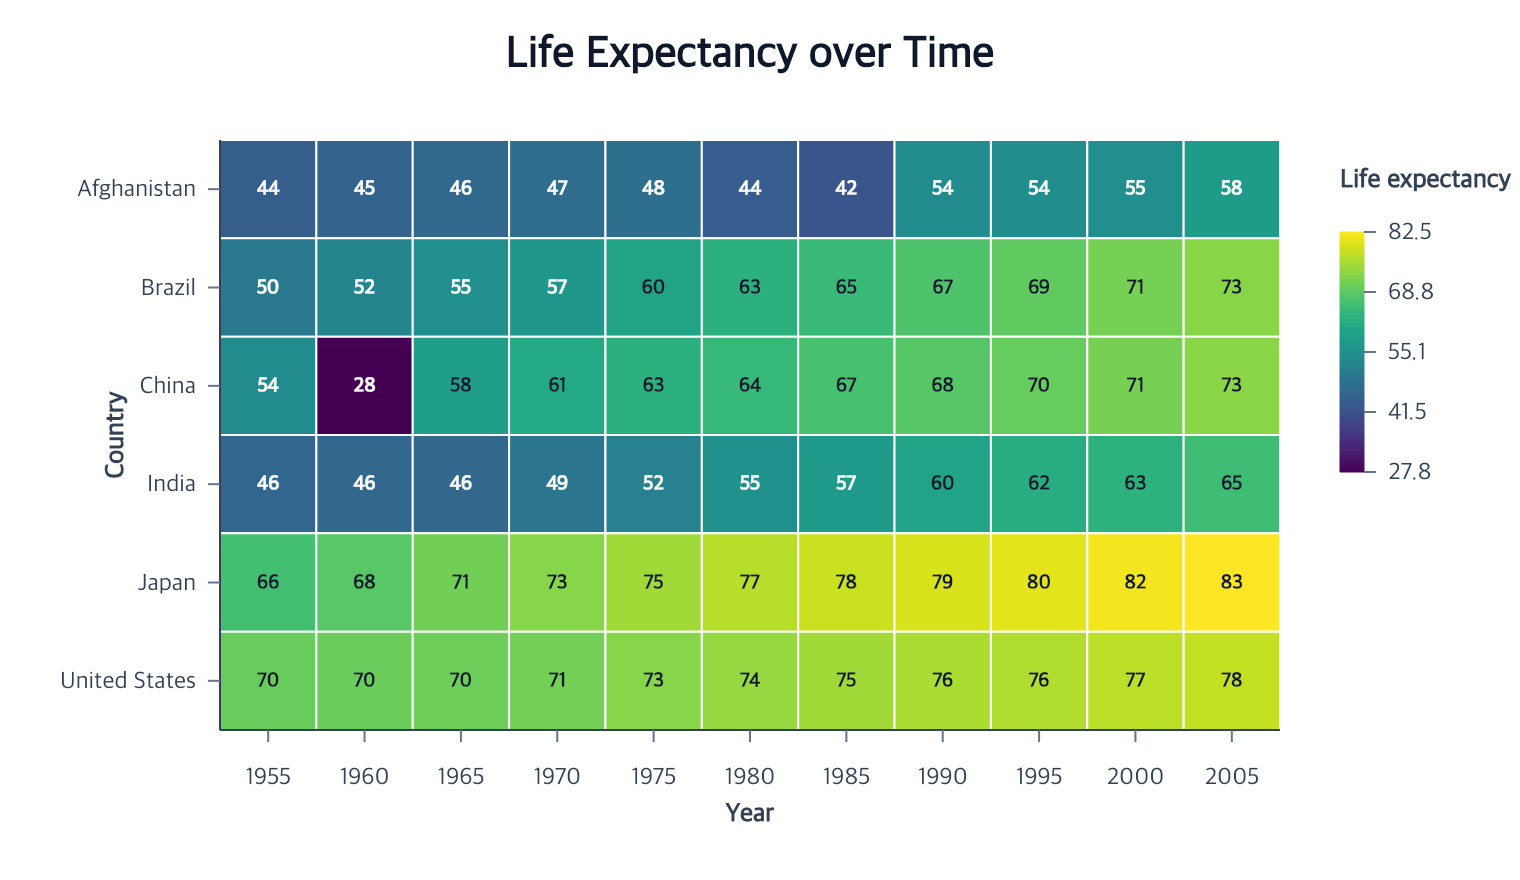
Map two discrete fields to cells and a quantitative field to color.
createHeatmap
createTextMark
encodeText
View full size
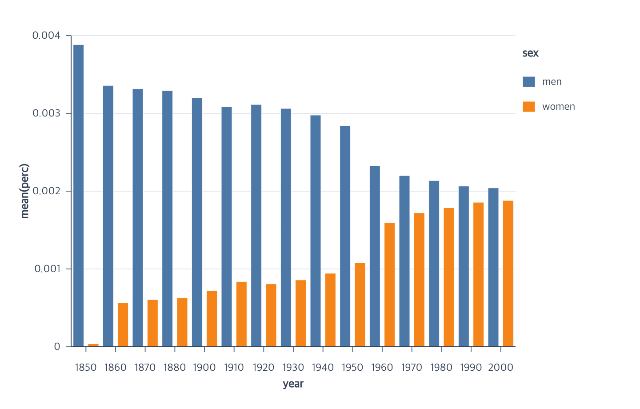
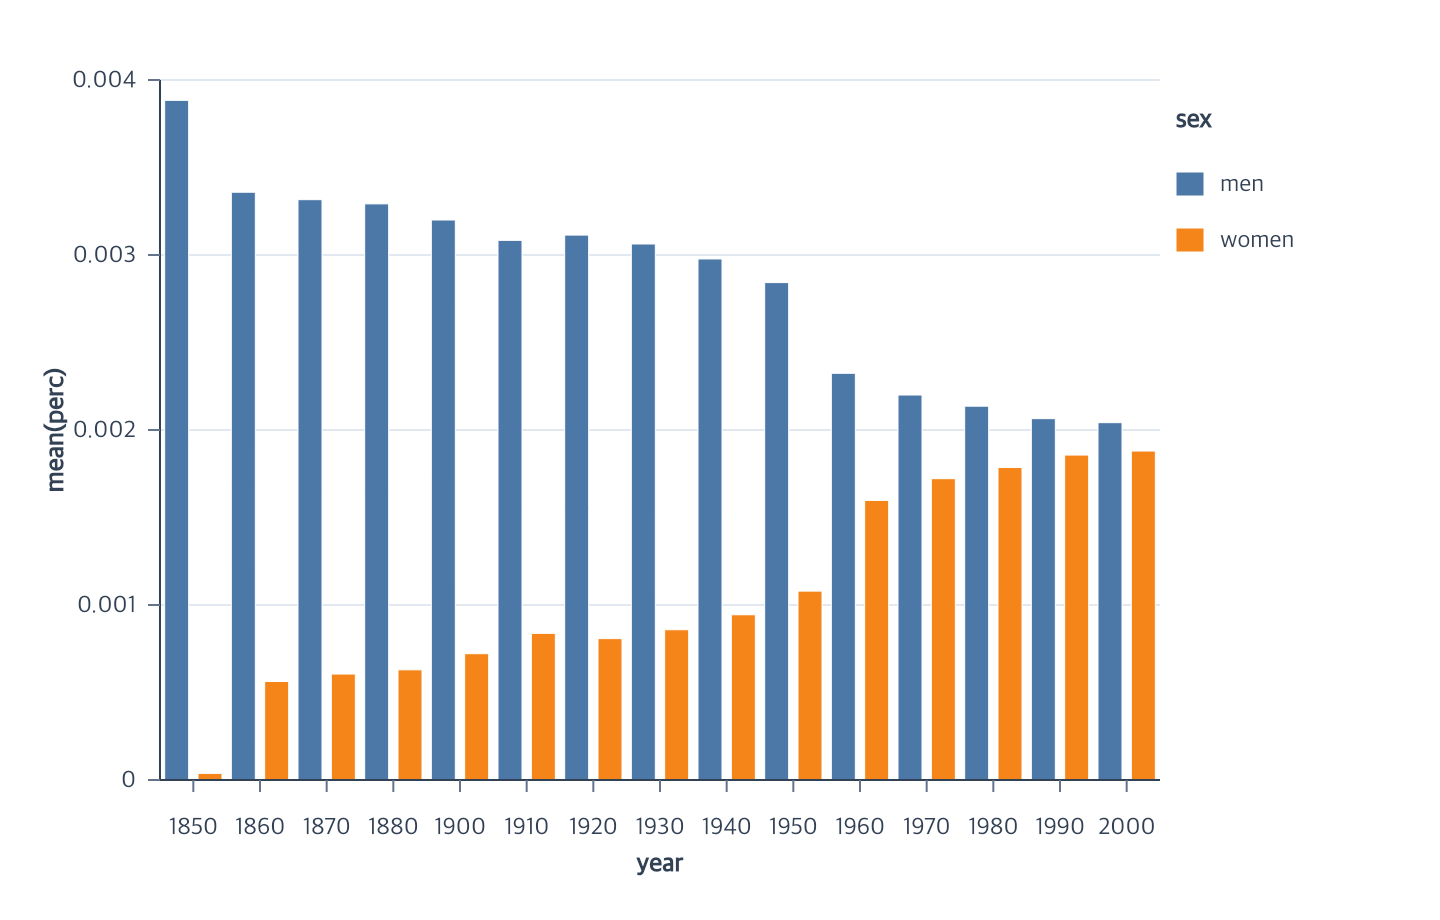
Aggregate ordinal categories and arrange nominal groups side by side.
createBarPlot
View full size
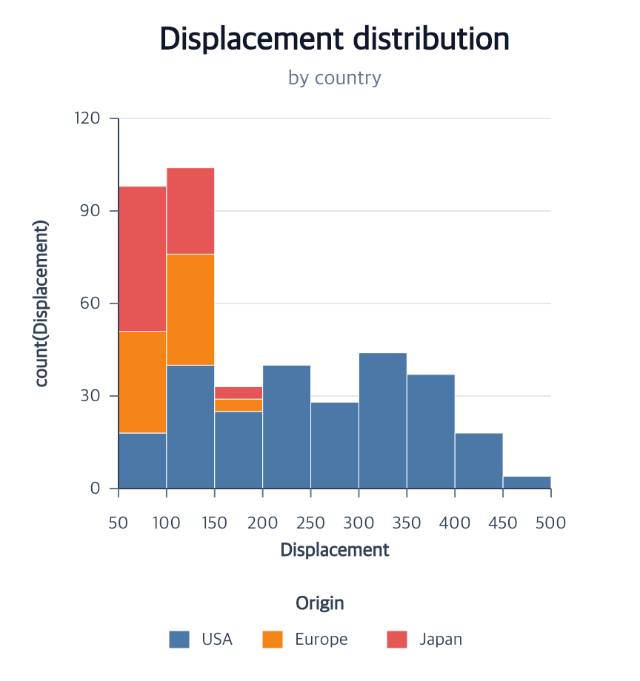
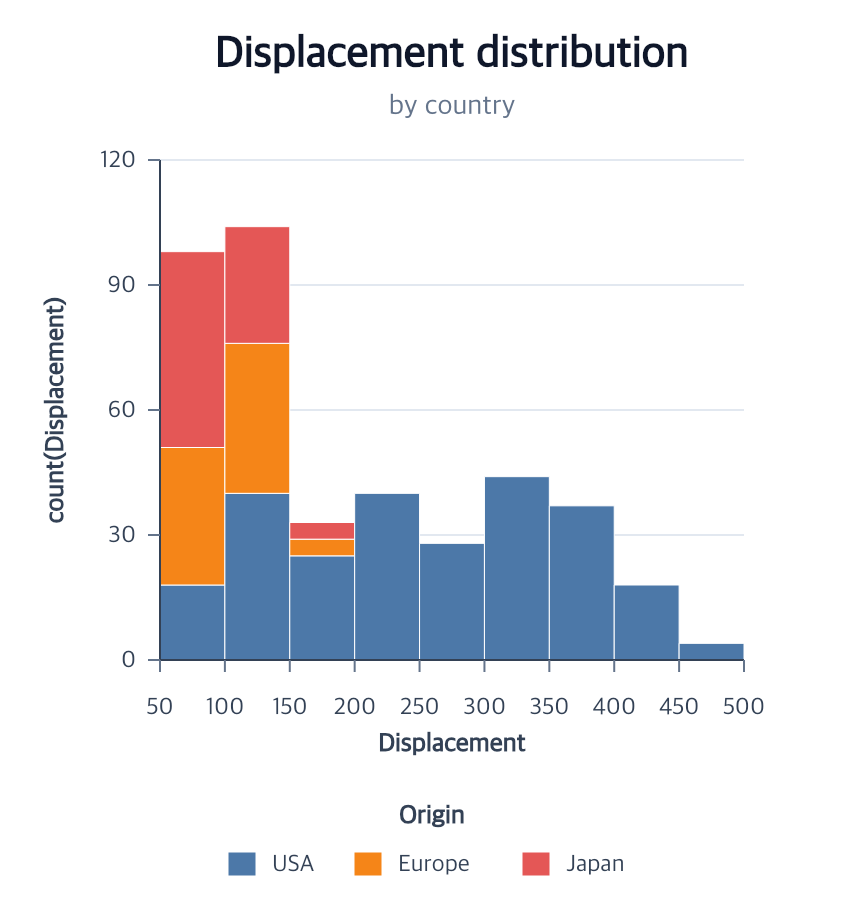
Bin a quantitative field and count category partitions.
createHistogram
View full size
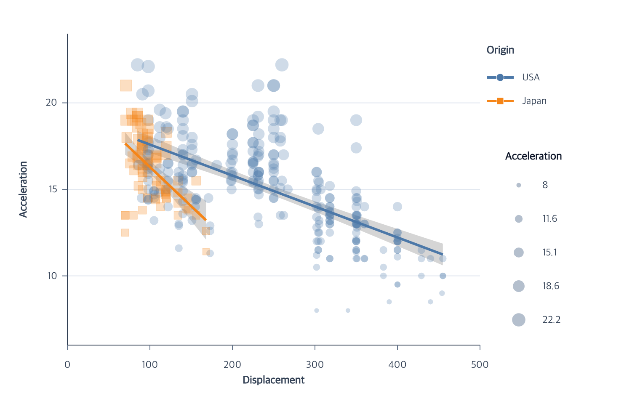
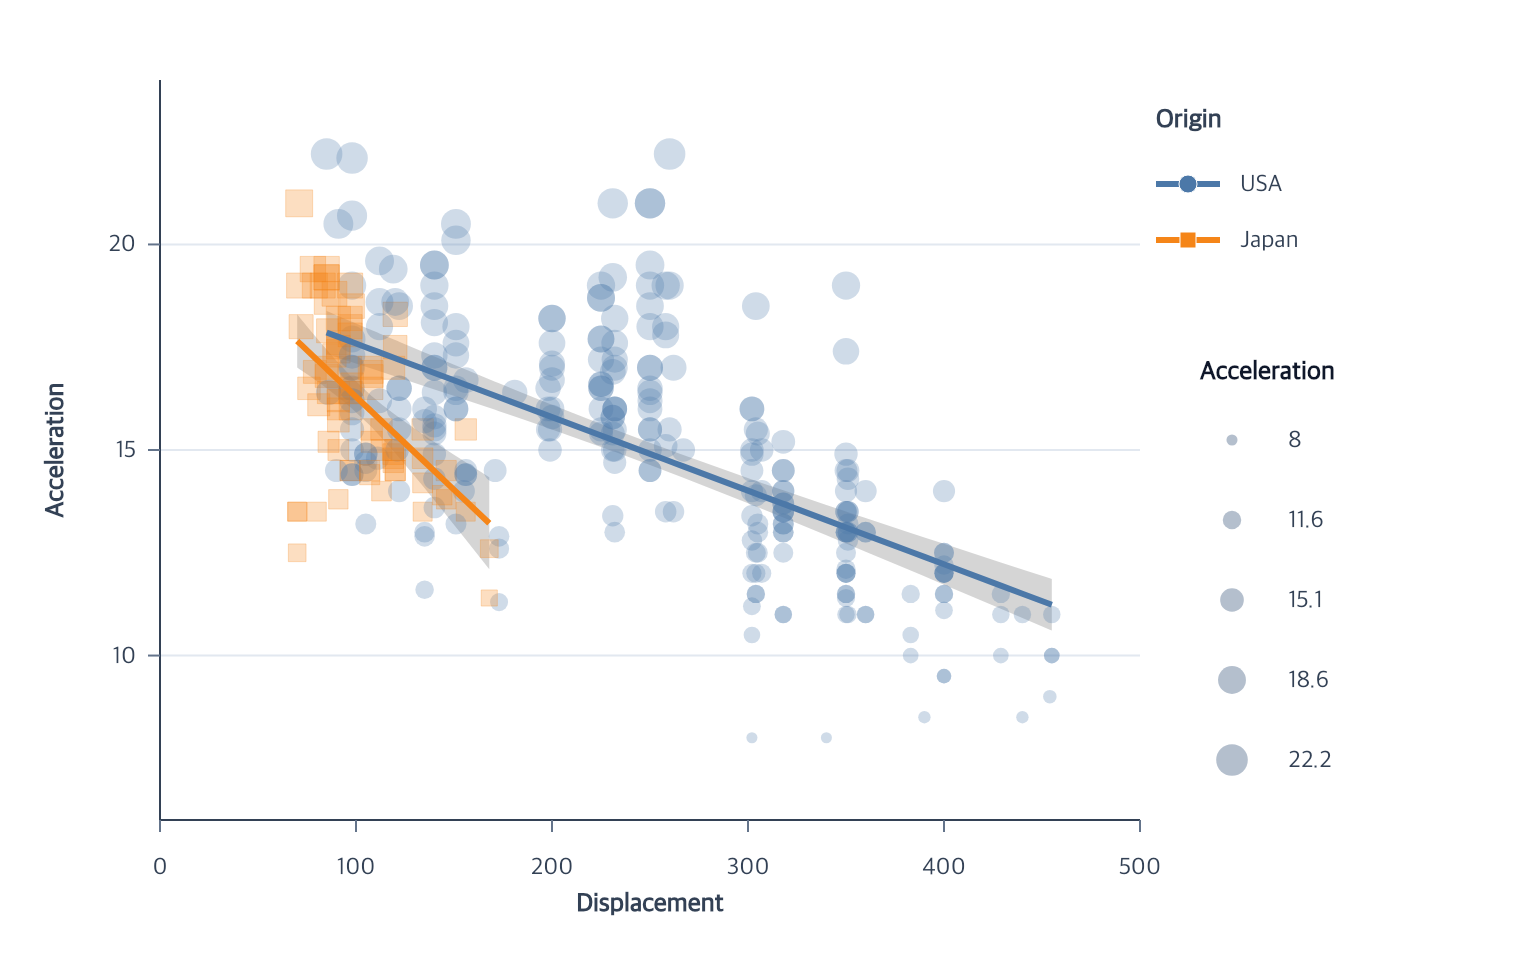
Layer observations, grouped fits, and confidence bands.
createPointMark
createRegression
View full size
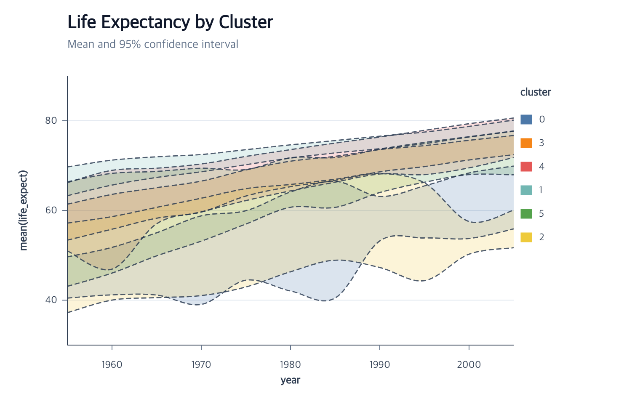
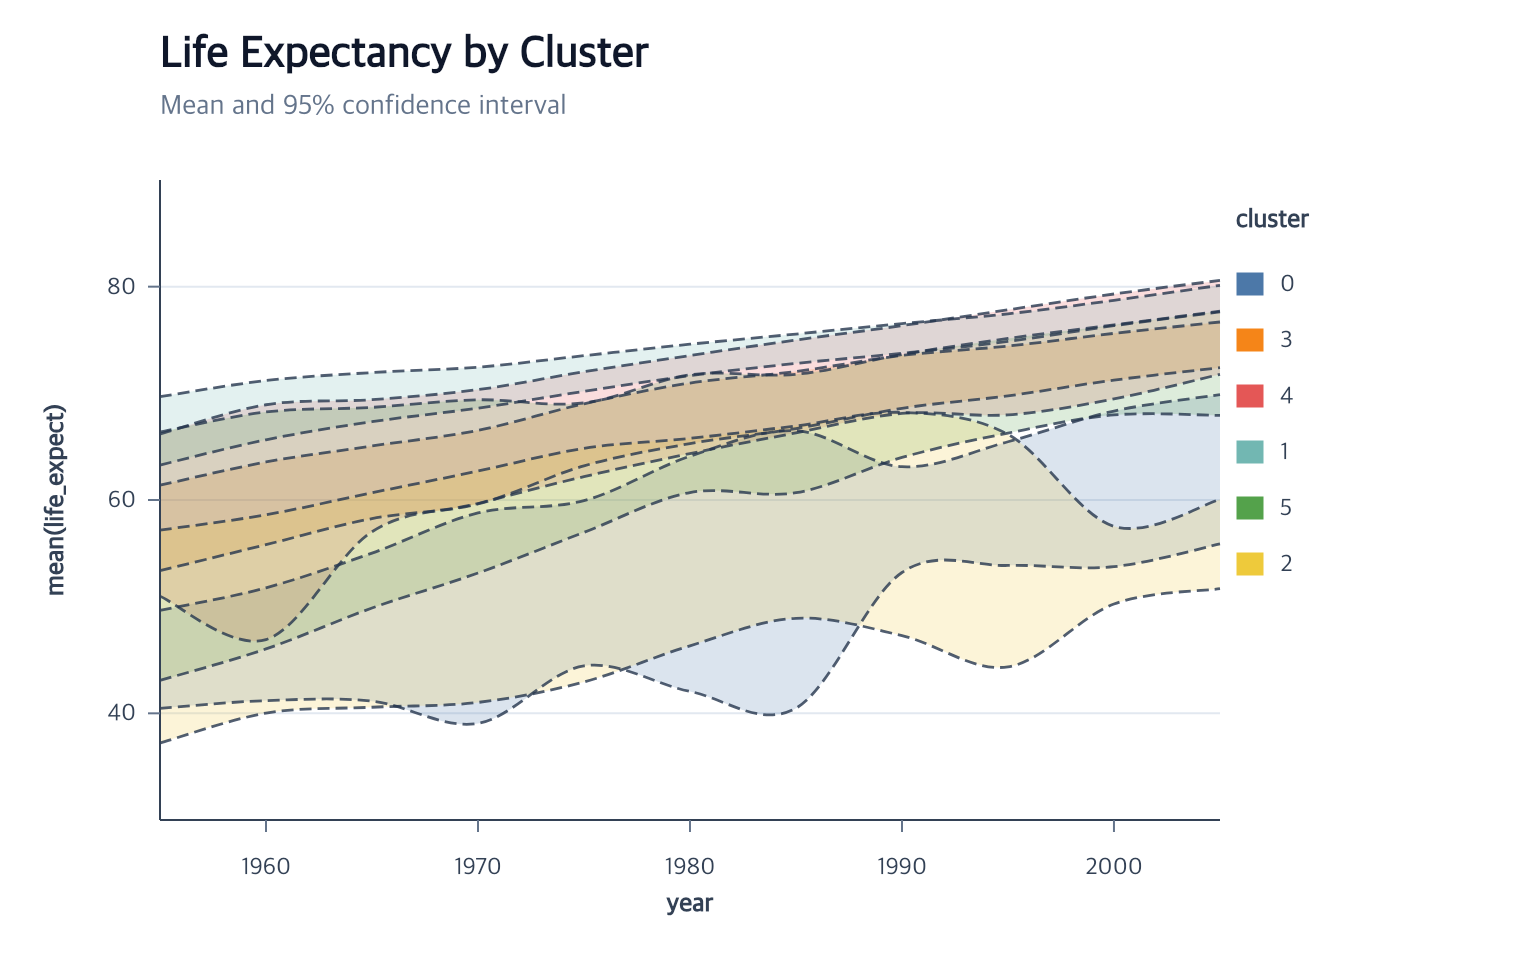
Show interval ribbons with explicit lower and upper boundaries.
createErrorBand
View full size
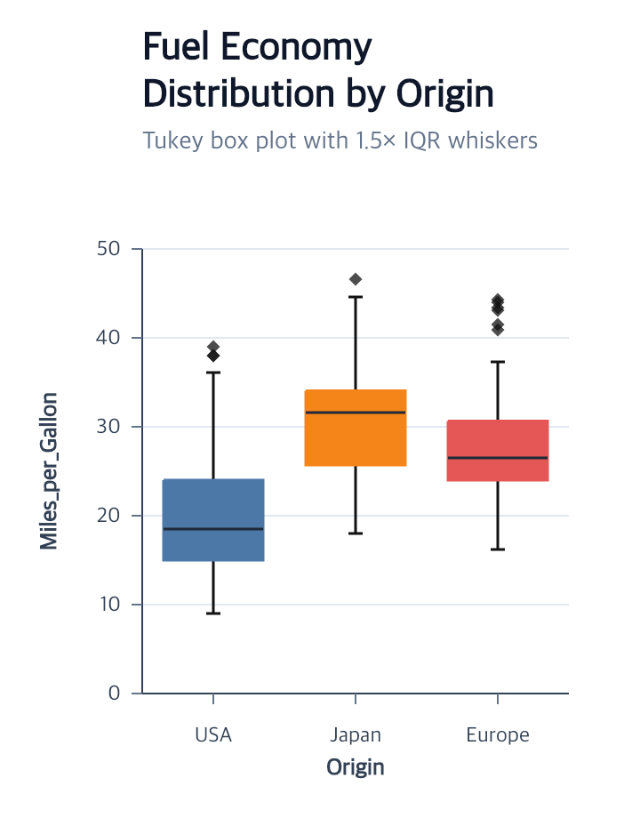
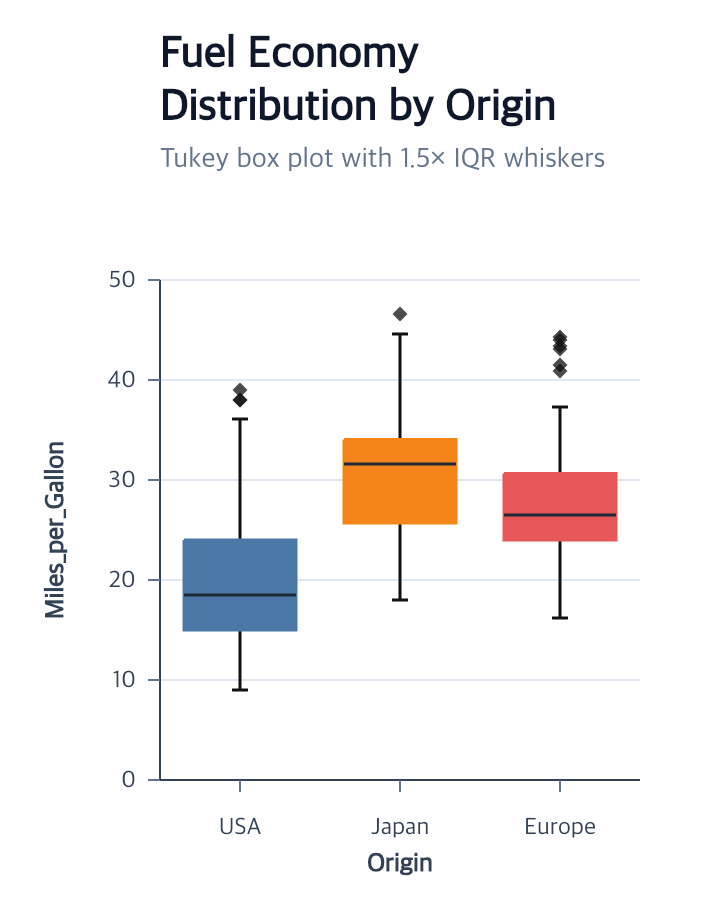
Compose quartiles, whiskers, medians, and outlier points.
createBoxPlot
View full size
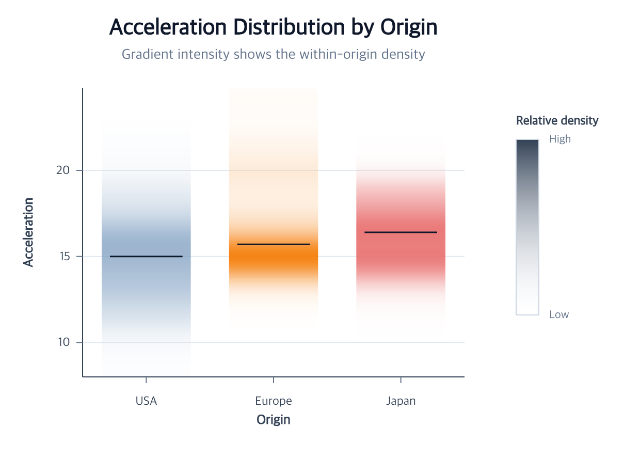
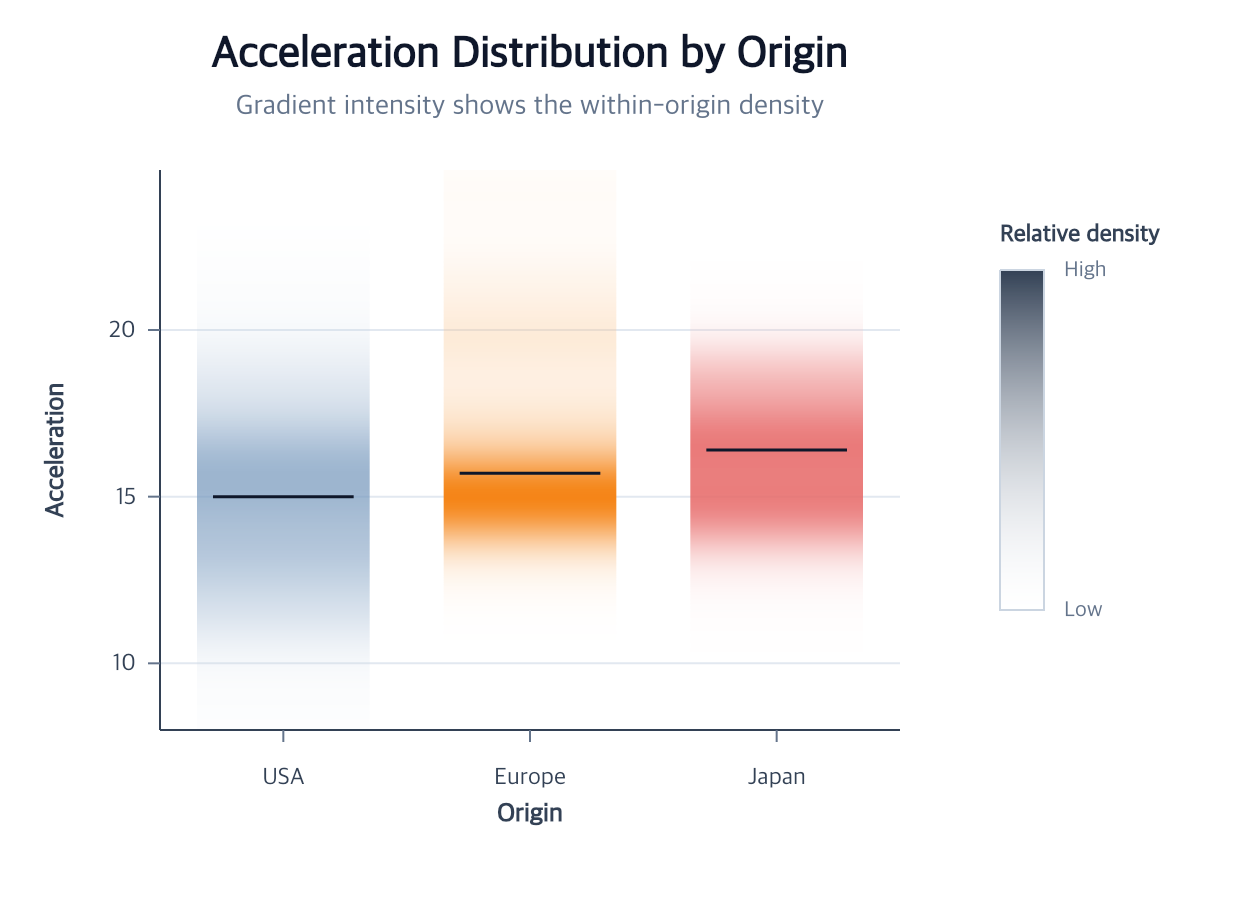
Compare complete distribution shapes across categories in a compact strip.
createGradientPlot
editGradientPlot
View full size
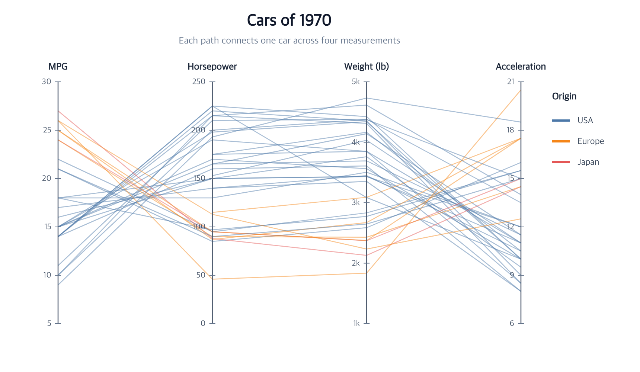
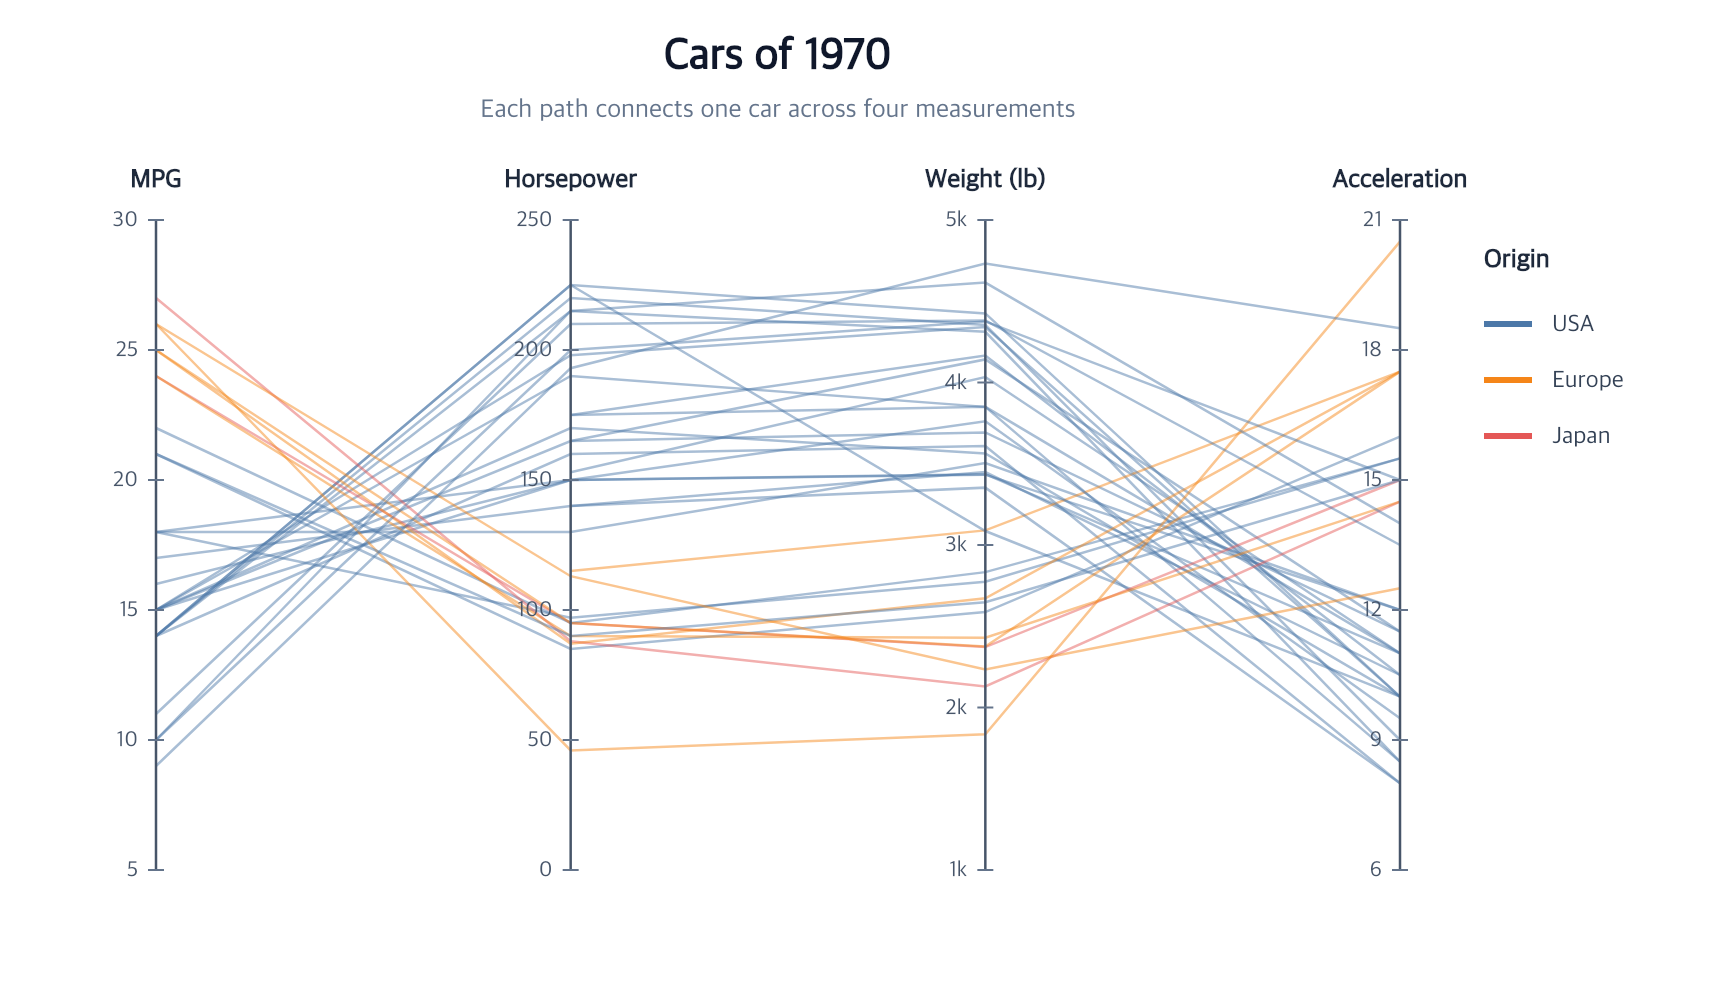
Compare multivariate row profiles while retaining row-level identity.
createParallelCoordinates
encodeParallelCoordinates
View full size
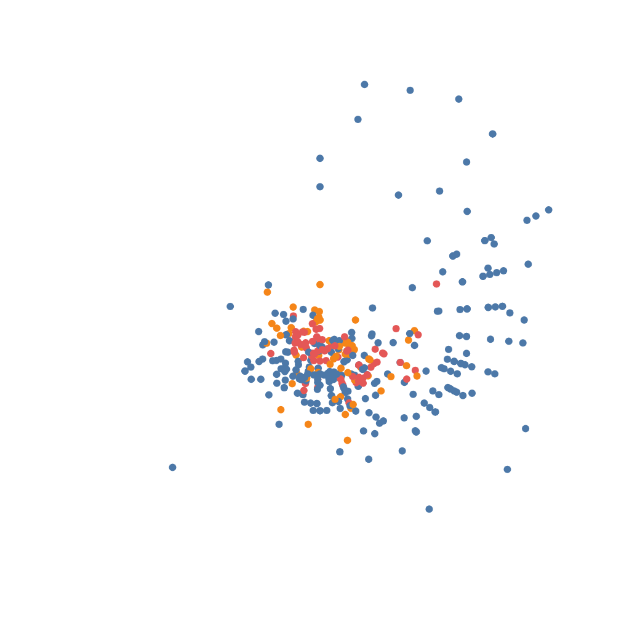
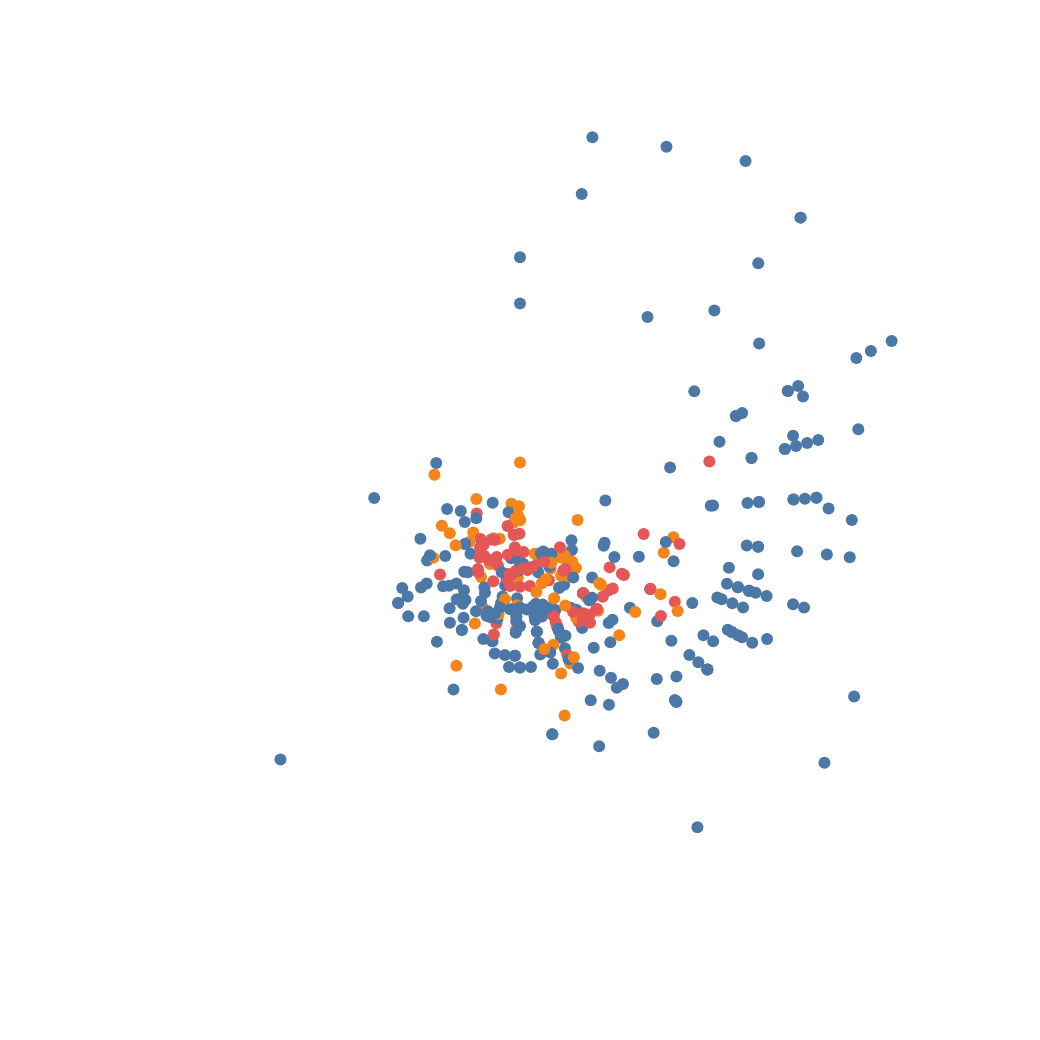
Map quantitative fields to clockwise angle and radial distance.
encodeTheta
encodeR
encodePointRadius
View full size
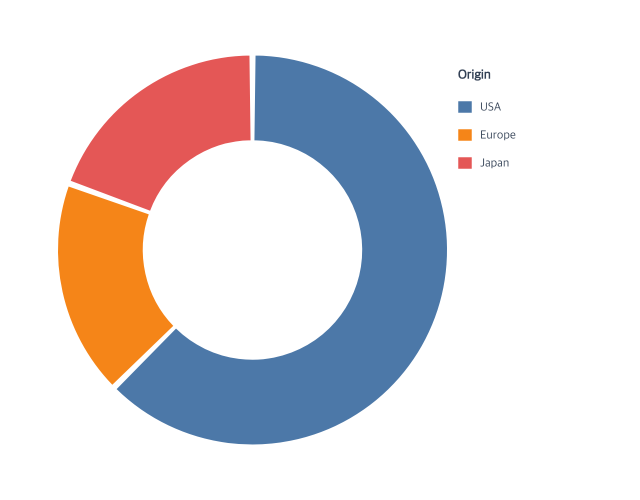
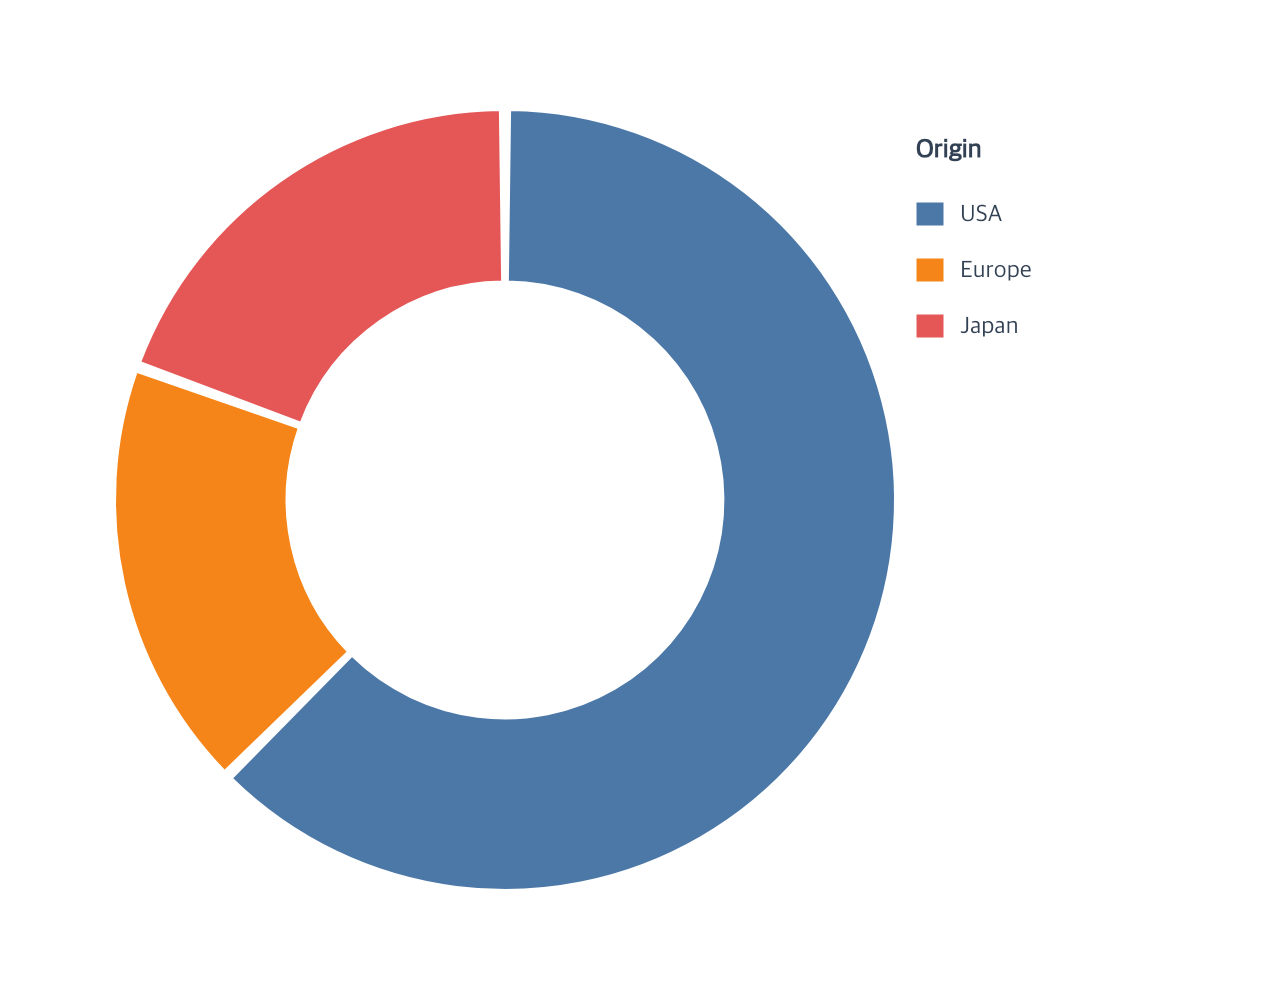
Build proportional sectors with an inferred categorical color legend.
createArcMark
encodeTheta
encodeColor
View full size
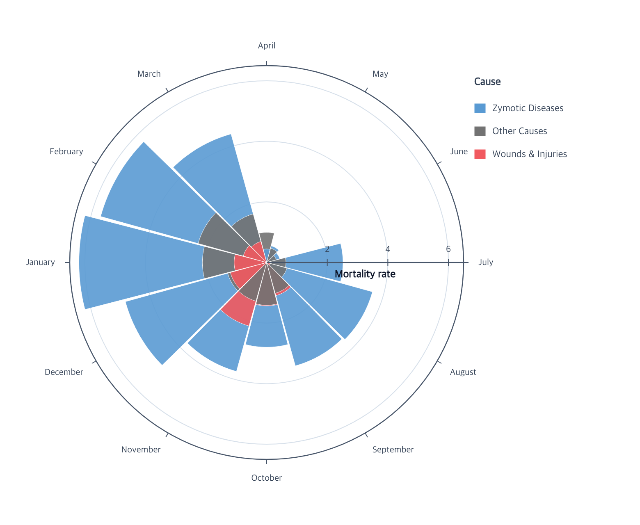
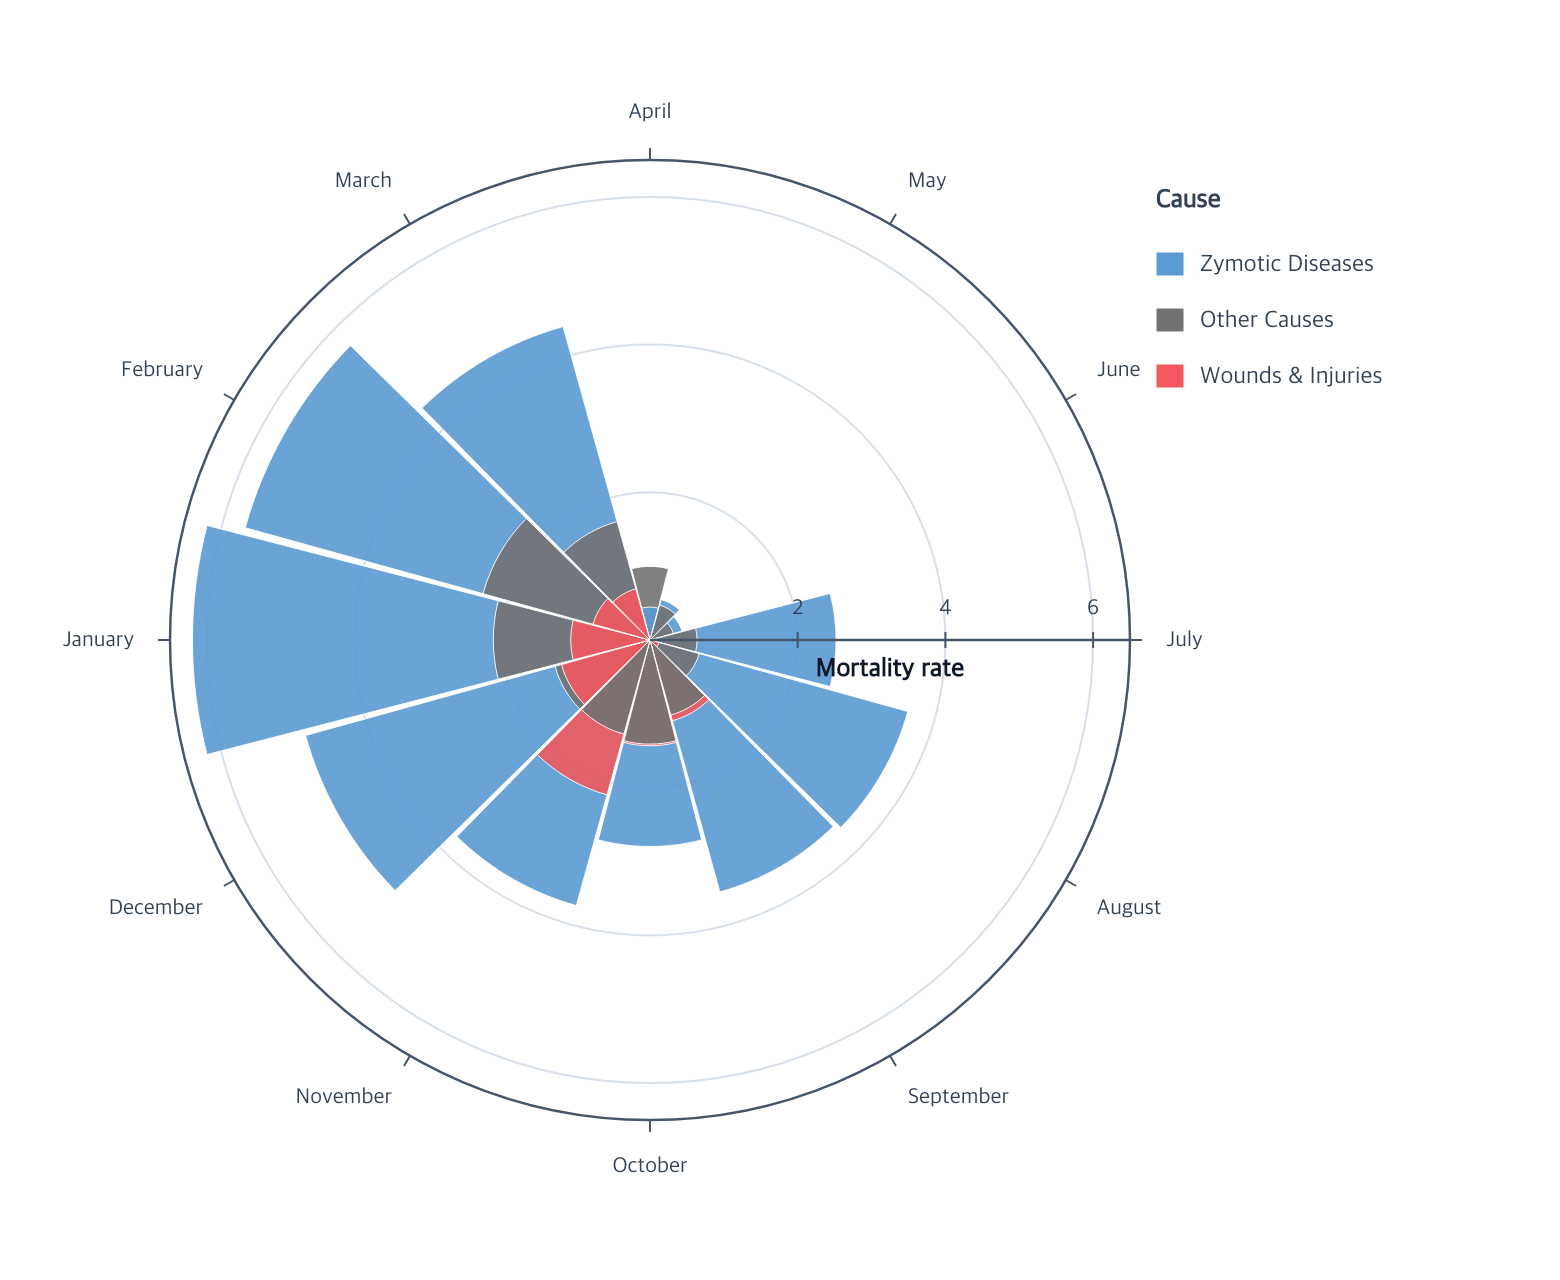
Compare radial magnitudes inside ordered categorical sectors.
createArcMark
encodeTheta
encodeR
View full size
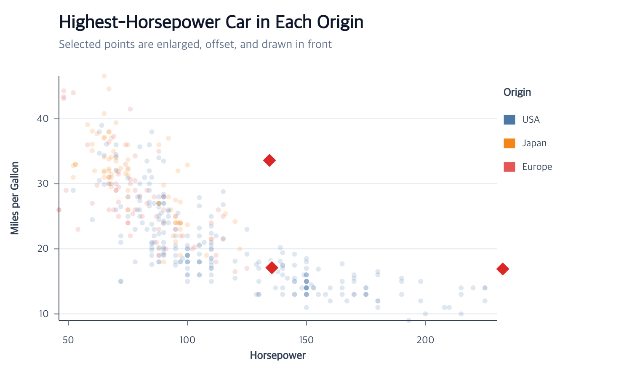
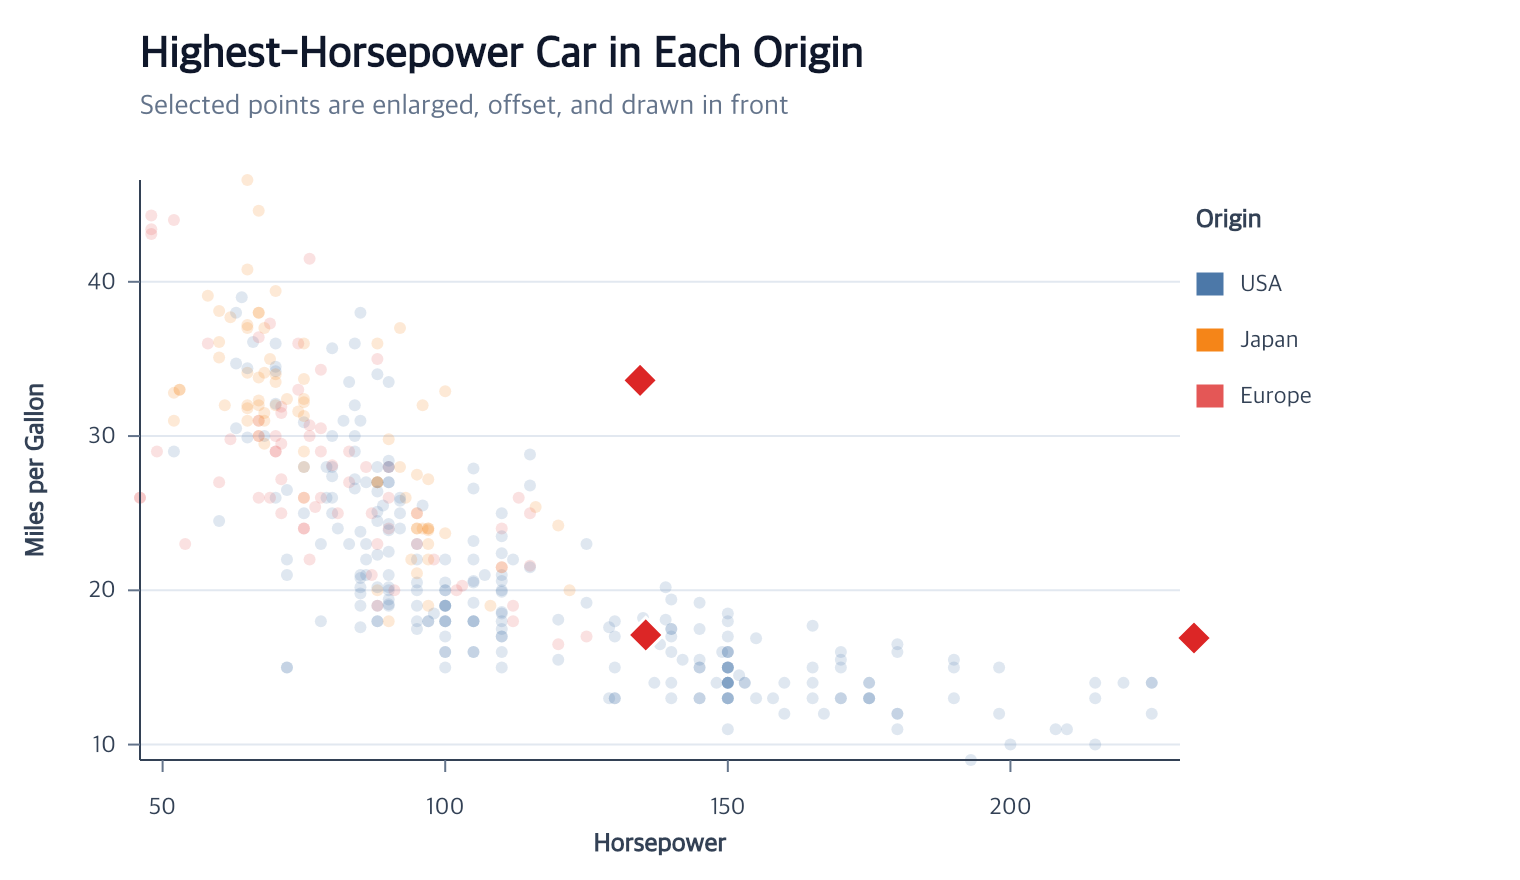
Select, filter, and emphasize final point, bar, and line items.
highlightMarks
View full size
Browse all supported chart examples →
293 actions · sha256:e755591a2e5f5e2b494867583876e28020a478c5220b77bdc6ad469a6224891d