Published-release documentation · release compatibility
Polar Point Chart Tutorial
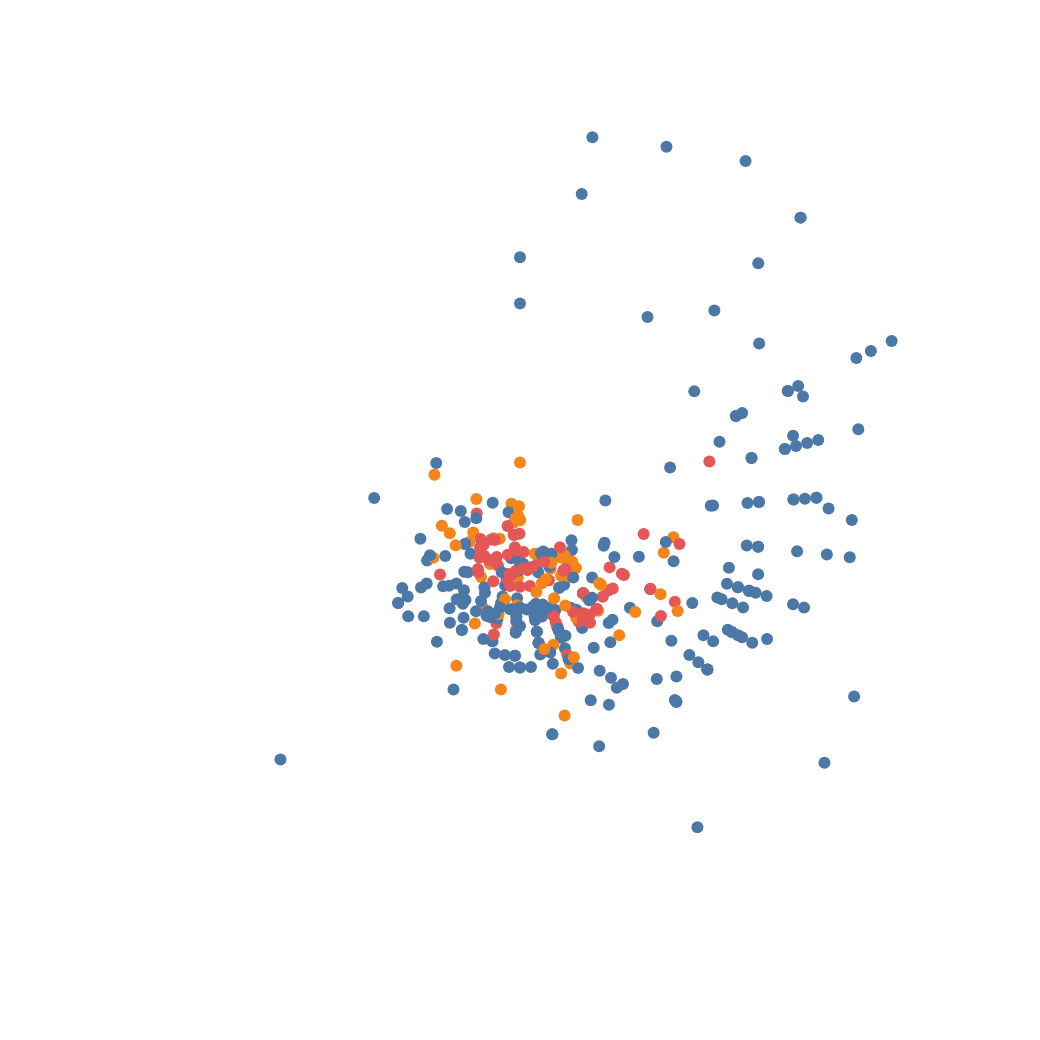
This tutorial maps car acceleration to angle, horsepower to distance from the
center, and origin to color. The public angle unit is degrees: 0 points to 12
o’clock and positive angles move clockwise.
Start with the Vite project from Getting Started, then place the tutorial dataset in Vite’s public directory:
mkdir -p public
curl --fail --location https://raw.githubusercontent.com/ggaction/ggaction/6422776b0a379c8c89809f41b434f366fbc1f143/data/cars.json --output public/cars.json
Complete program
import { chart, render } from "ggaction";

const response = await fetch("/cars.json");
if (!response.ok) throw new Error(`Failed to load cars: ${response.status}`);
const cars = await response.json();
const rows = cars.filter(row =>
  Number.isFinite(row.Acceleration) &&
  Number.isFinite(row.Horsepower) &&
  typeof row.Origin === "string" &&
  row.Origin.length > 0
);

const program = chart()
  .createCanvas({ width: 520, height: 520, margin: 48 })
  .createData({ values: rows })
  .createPointMark()
  .encodeTheta({ field: "Acceleration" })
  .encodeR({ field: "Horsepower" })
  .encodeColor({ field: "Origin" })
  .encodePointRadius({ value: 3 });

render(program, document.querySelector("canvas").getContext("2d"));
encodeTheta and encodeR infer the current point mark, create the polar
coordinate, and create scales named theta and radius. You can call them in
either order. Until both channels exist, the semantic assignment is retained
but no visible point position is produced.
Scale control
Theta uses [0, 360] by default. An explicit range may be reversed, but its
absolute span cannot exceed 360 degrees:
const reversed = program.editScale({ id: "theta", reverse: true });
Radius uses [0, min(plot width, plot height) / 2] by default. Explicit radial
ranges are logical Canvas pixels, must be non-negative, and must fit the current
plot bounds. Canvas size and margin edits recompute automatic radial ranges.
const zoomed = program.editScale({
  id: "radius",
  domain: [40, 240],
  range: [12, 200]
});
encodePointRadius controls glyph size. It is an alias of encodeRadius and is
separate from semantic radial position in encodeR.
Add Polar guides
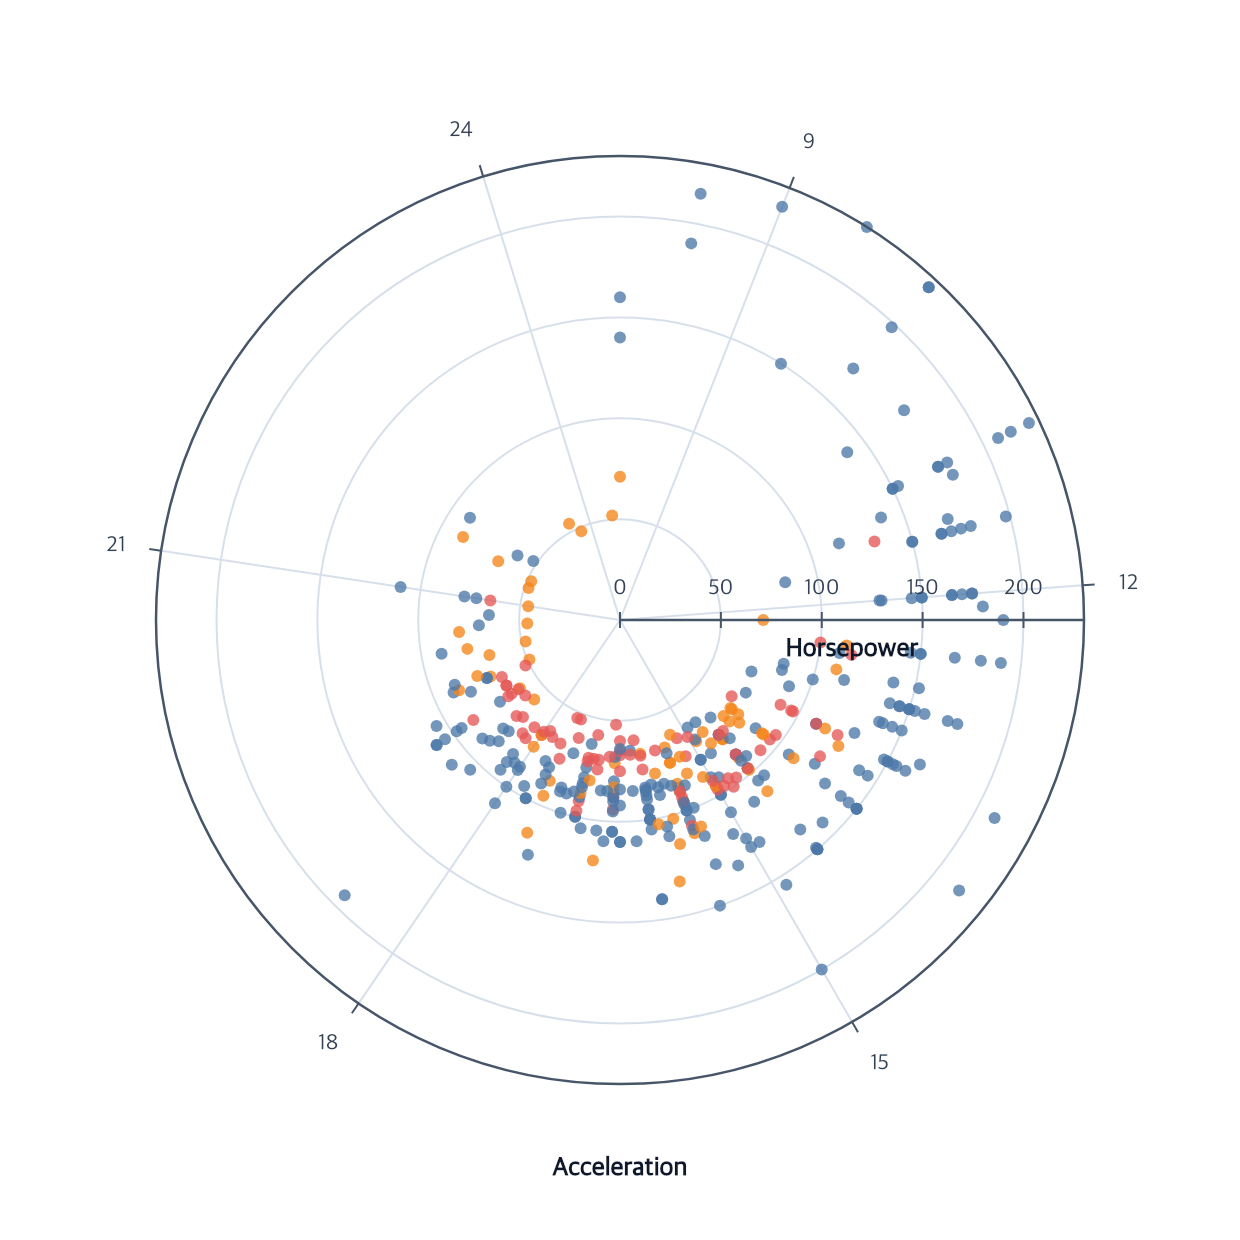
Call createGuides() after both position encodings to infer theta/radius axes
and grids:
const guided = chart()
  .createCanvas({ width: 620, height: 620, margin: 78 })
  .createData({ values: rows })
  .createPointMark({ opacity: 0.78 })
  .encodeTheta({ field: "Acceleration" })
  .encodeR({ field: "Horsepower", scale: { zero: true } })
  .encodeColor({ field: "Origin" })
  .encodePointRadius({ value: 3 })
  .createGuides();
The default radial axis points right at 90 degrees. Theta spokes and radial
circles draw behind the points; both axes draw above them. Titles are inferred
from the encoded fields. Use editRadialAxis({ angle: 180 }) to move the whole
radial axis together, or a focused edit such as
editThetaAxisLabels({ fontSize: 12 }).
Current boundary
Polar point marks support ordinary color, size, shape, opacity, filtering, selection, highlighting, theta/radius axes, and both Polar grid families. Polar lines and closed radar paths use the same position and guide system; arc marks remain outside this slice.
Related
Position encodings · Polar lines · Coordinates · Scale options
Documentation provenance
293 actions · sha256:e755591a2e5f5e2b494867583876e28020a478c5220b77bdc6ad469a6224891d