Published-release documentation · release compatibility
Categorical and Size Legends
createLegend(options?)
Creates inferred legend blocks. It supports combined line-series, color-stacked histogram, grouped ordinal-bar, grouped area, independent stroke, composite point-series, quantitative point-size, continuous-color gradient, and field-opacity legends. It also infers interval swatches for quantize, quantile, and threshold point color scales.
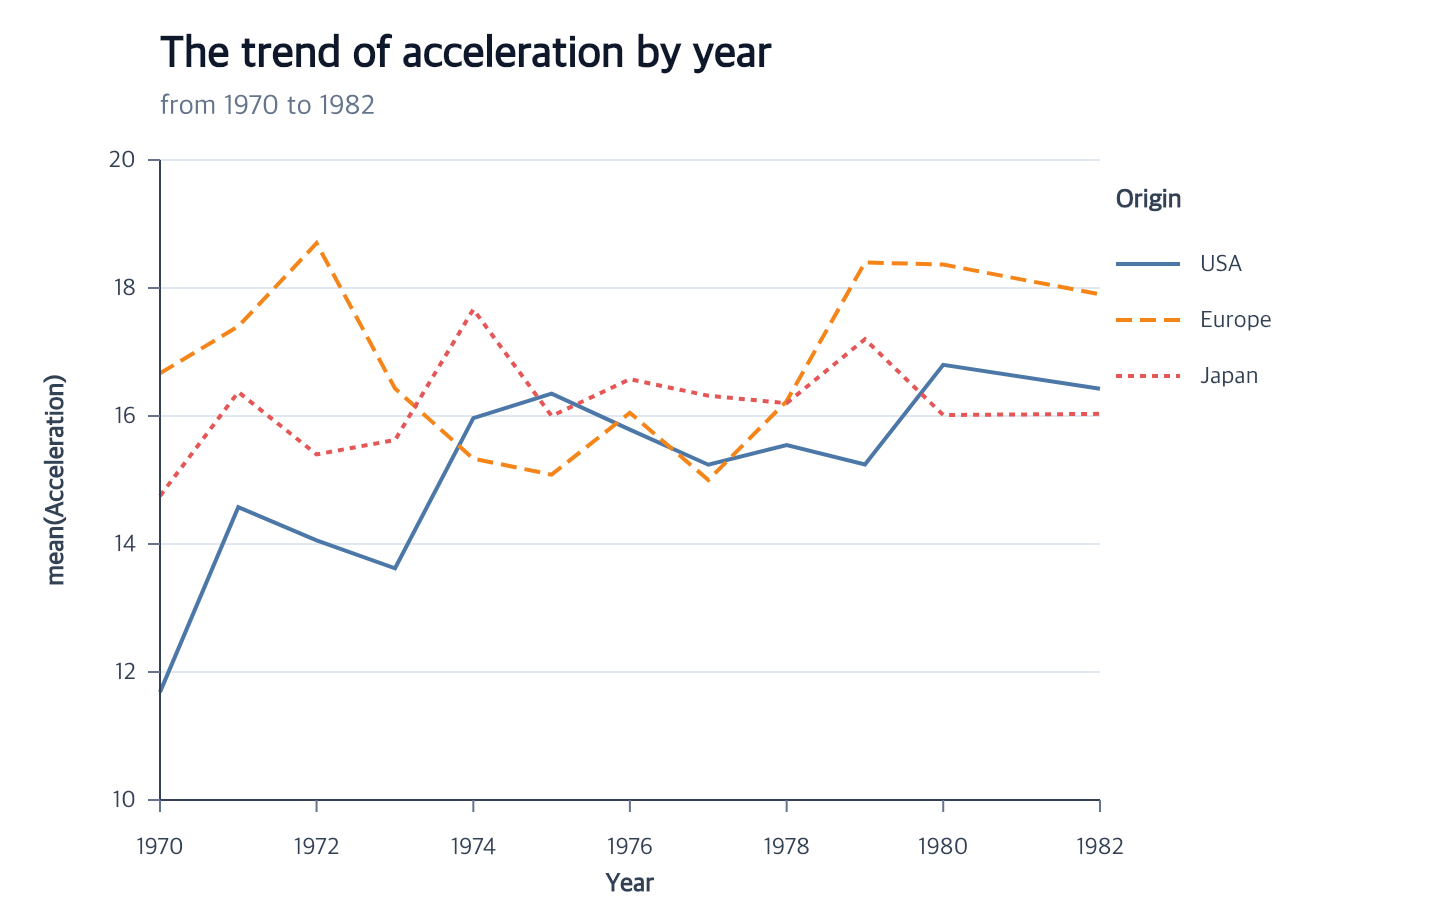
For a line legend that explains a categorical dash pattern, samples inherit the line’s fixed stroke color. Mapped color or stroke scales and explicit legend-block symbol overrides take precedence. Editing the line’s fixed color updates its existing samples; the sample recipe’s opacity remains independent of mark opacity.
Contextual fragment. Use an ES module with the imports, data, and prepared resource state described in this section. Caller-provided receivers:
program. Resolve these names from setup in this fragment or section; alternatives branch from the same base.
program.createLegend();
A size encoding is independently eligible; color and shape are not required:
Contextual fragment. Use an ES module with the imports, data, and prepared resource state described in this section. Caller-provided receivers:
program. Resolve these names from setup in this fragment or section; alternatives branch from the same base.
program.createLegend({ channels: ["size"], position: "right", count: 4 });
With one size-encoded point mark, both createLegend() and createGuides()
infer the same block. Multiple size-encoded point marks require target.
Standalone size legends support four edges and four plot corners, edge layout, grid controls,
text styles, and borders. A size block paired with a categorical point legend
supports every edge. Continuous size scales use evenly sampled domain values.
Quantize, quantile, and threshold size scales show every interval and reject an
explicit count.
An explicit channels array selects exactly the content to create. On a point
mark encoding all three channels, use channels: ["color", "shape", "size"]
to include all three, or ["color", "size"] to show color swatches and size
samples without a shape explanation. Selecting just ["color"] or ["shape"]
does not add a size block. Sample count requires size to be selected in a
categorical request and requires a continuous size scale. Encodings and mark
appearance remain unchanged.
Stroke may be selected independently with channels: ["stroke"]. When Point
fill and outline use different fields, create separate color and stroke blocks;
their domains, titles, symbols, edits, highlighting, and removal stay independent.
Omitting channels on a point mark infers its encoded categorical color, shape,
and quantitative size. Color alone uses swatches; shape uses typed symbols;
color plus size and shape plus size each create both corresponding blocks.
The result matches explicitly listing those channels. If several point marks
can own an inferred size companion, specify target.
Every categorical legend uses the same right-side default:
| Mark | Channels | Position | Symbol |
|---|---|---|---|
| line | encoded color, stroke, and/or strokeDash |
right |
line |
| bar histogram | color |
right |
swatch |
| grouped ordinal bar | color |
right |
swatch |
| grouped area | color |
right |
swatch |
| point | inferred or selected color only |
right |
swatch |
| point | inferred or selected shape only |
right |
typed point |
| point + matching line | color + shape |
right |
line over typed point |
| quantitative point size | size |
four edges and four corners, standalone or combined | five equal-area circles |
| quantitative/temporal point color | color |
right |
continuous gradient with five labels; explicit symbols representation shows sampled points |
| discretized quantitative point color | color |
right/left/top/bottom |
ordered interval swatches |
| categorical supported-mark stroke | stroke |
right/left/top/bottom |
actual fill with mapped outline |
| quantitative point opacity | opacity |
right |
five constant-size circles with sampled opacity |
A shape-only point legend also works when the chart contains unrelated lines. The automatic line-and-point symbol requires the point and line to share both the encoded color field and color scale. Removing the point’s color encoding preserves its remaining shape legend.
| Option | Type | Default |
|---|---|---|
target |
compatible mark ID | current or unique compatible mark |
channels |
compatible channel array; continuous guides use one color or opacity |
compatible encoded channels |
order |
"scale", { values: [...] }, or { channel: "x"/"y"/"theta" }; categorical only |
"scale" |
position |
four outside edges or top-left/top-right/bottom-left/bottom-right inside the plot |
"right" |
blockLayout |
"row", "column", or "wrap"; layout of all blocks owned by one target |
existing edge flow; new corner group uses row |
at |
finite { x, y }; occupied group top-left relative to the plot |
no free anchor |
layout |
categorical "edge" or "legacy-bottom" |
"edge" |
align |
"left", "center", or "right" |
"center" |
direction |
"horizontal" or "vertical" |
"vertical" at either side; "horizontal" at top/bottom |
columns |
positive integer | all items in one row at top |
offset |
non-negative number | 8; omission clears an occupied same-edge axis, explicit values stay plot-relative |
titlePosition |
"top" or "left" |
"top" |
title |
non-empty string or false |
encoded field name; false initially hides it |
symbol |
"auto", shorthand object, or layered recipe |
inferred from mark |
labels |
label style object | default sans-serif label style |
titleStyle |
title style object | default sans-serif title style |
itemGap |
positive number | 18 for vertical items; horizontal items keep 24 at top and 20 at bottom |
rowPadding |
non-negative finite number | omitted; opt into occupied edge-to-edge vertical row spacing |
titlePadding |
non-negative finite number | omitted; independently set title-to-body spacing |
border |
boolean or border style object | false |
count |
size-legend symbol count from 2 through 10,000 |
5 for point legends |
gradient |
{ length?, thickness? } with positive values |
{ length: 120, thickness: 12 } |
Pass position: "bottom" explicitly to place the legend below the plot.
Without rowPadding, vertical items reserve the larger of itemGap, painted sample height, and
labels.fontSize * 1.2. This conservative line-height allowance retains the
18-pixel pitch for ordinary 12-pixel labels and grows for larger labels; it is
not a font-specific glyph-height guarantee. Horizontal grids are unchanged.
Opt-in content spacing uses each row’s
actual sample and logical text bounds. It takes precedence over the vertical
pitch while retaining itemGap for column separation and later reset. Both
spacing policies override the corresponding legacy editLegendBlock({gap})
distance while active; resetting them restores that retained fallback.
For a combined categorical-and-size legend, title: false hides the categorical
title; the size block retains its independent title, matching editLegend.
Bottom legends use the same item grid as top legends and can use left, center,
or right alignment; side legends require center alignment. Left categorical,
composite point, and size blocks use vertical flow and preserve symbol-to-label
and resolved-domain order. Both sides use vertical direction and a top title. columns is a positive
integer and defaults to one on the sides. Items fill each column from top to
bottom in domain order before starting the next column. Each column reserves
its measured symbol and label width; itemGap separates columns. Provide
enough side margin for the complete grid. Moving a horizontal grid to either
side preserves its column count; use titlePosition: "top" when needed.
Incompatible direction or title options produce an error.
For example, this complete program places 21 years in three columns on the right:
Contextual fragment. Use an ES module with the imports, data, and prepared resource state described in this section. Resolve these names from setup in this fragment or section; alternatives branch from the same base.
import { chart } from "ggaction";

const program = chart()
  .createCanvas({
    width: 620, height: 380,
    margin: { top: 20, right: 300, bottom: 60, left: 70 }
  })
  .createData({ values: Array.from({ length: 21 }, (_, i) => ({
    x: i, y: i % 5, year: String(1980 + i)
  })) })
  .createScatterPlot({
    x: "x", y: "y", color: { field: "year", fieldType: "ordinal" },
    guides: { legend: { position: "right", columns: 3 } }
  });
Categorical legends use layout: "edge" by default, including a bottom legend
with no other layout options. To preserve the former compact single row anchored
near the Canvas bottom edge, specify both position: "bottom" and
layout: "legacy-bottom". This mode keeps labels at Canvas height minus 28 and
the title at height minus 52. It supports alignment, item gap, symbols, styles,
and borders; columns, vertical direction, a left title, or a custom plot offset
require layout: "edge". Layout mode is preserved by edits and replay.
Large text or symbols that overlap the fixed title row, cross the plot, or
exceed the Canvas produce an error; the fixed anchors do not move.
Top and bottom legends use a general item grid. columns caps the column count;
direction: "horizontal" fills rows first and "vertical" fills columns
first. For a single edge legend, align positions the actual outer bounds of
the complete title, items and border against the plot left edge, center or right
edge. Strokes and label extents count toward these bounds. offset measures
the gap from the plot to the nearest outer legend edge. The final block must
fit the requested Canvas. The title appears above the grid by default, or beside it with
titlePosition: "left".
Each item reserves the actual extent of every symbol layer, including strokes
and mapped shapes. Labels start after this shared sample slot plus
labels.offset (8 for color, 10 for series). Narrower shapes retain the same
label column. Side rows expand for large labels or symbols, with at least
12 pixels between the visible title and item content. Horizontal grids and
borders use the same extents; inline titles are vertically centered beside
the complete grid. Hidden titles reserve no space.
Plot-corner item blocks measure that 12-pixel title-to-content gap from actual painted bounds. They do not inherit the outside side legend’s fixed first-row anchor. The native corner inset and item pitch remain unchanged; content that still exceeds the inset plot fails without resizing or moving the plot.
A categorical legend resolves at most 10,000 domain items. A layered symbol recipe contains at most one line, one point, and one swatch layer.
When two or more legend blocks share the top or bottom edge, the lane starts at the plot’s left edge and keeps 40 logical pixels between complete occupied blocks. A left-positioned categorical title participates in the same inline center line as a left-positioned sampled-opacity title.
Contextual fragment. Use an ES module with the imports, data, and prepared resource state described in this section. Caller-provided receivers:
densityArea. Resolve these names from setup in this fragment or section; alternatives branch from the same base.
densityArea.createLegend({
  position: "top",
  direction: "vertical",
  columns: 3,
  titlePosition: "left",
  offset: 8
});
Automatic recipes refresh when a matching companion line is added, removed,
or rebound to another color scale. Creating the legend before or after the
line produces the same result. Explicit symbol recipes retain their layers
and order through those changes; editLegend({ symbol: "auto" }) restores
inference. Title visibility and text styles remain intact.
Item order without changing color
createLegend and editLegend accept the same categorical order policy.
An explicit non-empty list puts those categories first and appends omitted
categories in source first-appearance order. Explicit scale-domain entries absent
from the source remain at the end. Unknown and duplicate categories are errors.
Color, shape, and dash assignments remain attached to category values.
To follow the same target’s categorical x, y, or theta domain, use
order: { channel: "theta" } (substitute x or y as needed). The linked encoding
must use the same field and category set as the legend. Its later order/scale
changes update the legend. Removing that encoding or changing it to an
incompatible field/domain fails; first reset with editLegend({ order: "scale" }).
Omitted order on an edit preserves the policy. Continuous and interval legends
do not accept categorical ordering.
Inside a complete chart’s guides.legend, linked channels follow that chart’s
position roles: categorical Cartesian positions use x or y; Pie, Rose, and
Radial Bar use theta. Line, Area, Density, and Parallel facade declarations
offer "scale" or explicit values, since their declared positions do not
provide a categorical axis to link.
Combined categorical and size layout
Point legends can combine categorical color or shape with quantitative size on any edge. For a point chart with both encodings, this fragment places a bordered legend above the plot:
Contextual fragment. Use an ES module with the imports, data, and prepared resource state described in this section. Caller-provided receivers:
program. Resolve these names from setup in this fragment or section; alternatives branch from the same base.
program.createLegend({
  channels: ["color", "size"],
  position: "top",
  count: 3,
  offset: 30,
  columns: 2,
  border: true
});
At top and bottom, categorical content precedes size content with 40 pixels
between their occupied bounds. Blocks wrap to another row away from the plot
when necessary. The whole group, including its border, follows align and
offset. direction, columns, titlePosition, and itemGap apply to both
item grids. Newly combined blocks share label and title typography at every
edge, including the default title color #334155. Each block retains its own
title text, sample sizes, and label gap. A size legend created independently
keeps its stored styles when added to a categorical legend; its standalone
default title color remains #0f172a.
Opting into blockLayout or moving the group to a corner or free anchor retains
this typography inheritance and each symbol’s paint. Placement and typography
inheritance are independent, including after Canvas, scale, data, and persistence replay.
Title spacing also includes labels that are taller than the samples.
A size border retained from an earlier standalone legend stays inside the
shared outer border. Other legends place this complete group as one block.
Combined legends require layout: "edge"; "legacy-bottom" is unsupported.
A separately positioned size legend can coexist with a categorical
"legacy-bottom" legend on another edge. Each keeps its own placement and styles.
Combine ordinal size and shape
createLegend({ combine: "size-shape" }) draws one categorical block whose
sample uses both the mapped shape and the mapped physical area. It requires
one point owner, the same nominal or ordinal field for both encodings, and
identical typed, ordered ordinal domains. Explicit channels must contain
exactly "shape" and "size"; with omitted channels, an encoded color legend
remains an independent block. Different owners, fields, grain, numeric size
scales, or domain order are rejected.
Omitting combine, or creating with "separate", preserves the previous output.
An edited combination is retained unless explicitly changed. Whole-target
editLegend({ combine: "separate" }) splits the pair and copies shared text,
title and placement styles; combining independent blocks uses supplied styles
or the combined native defaults, rather than choosing one old block’s styles.
A split preserves an independent color block. Incompatible display maps must
be reset before splitting.
Either member selects the same combined block. Removing either member removes the entire block without removing either mark encoding. Fixed sample shape or size overrides conflict with the mapping; stroke, fill, opacity, labels and categorical item order retain their existing controls. Zero mapped area retains its category and text slot. Current data and scale revisions revalidate both encodings, so an invalid revision fails instead of silently splitting the block.
Recipe layer opacity
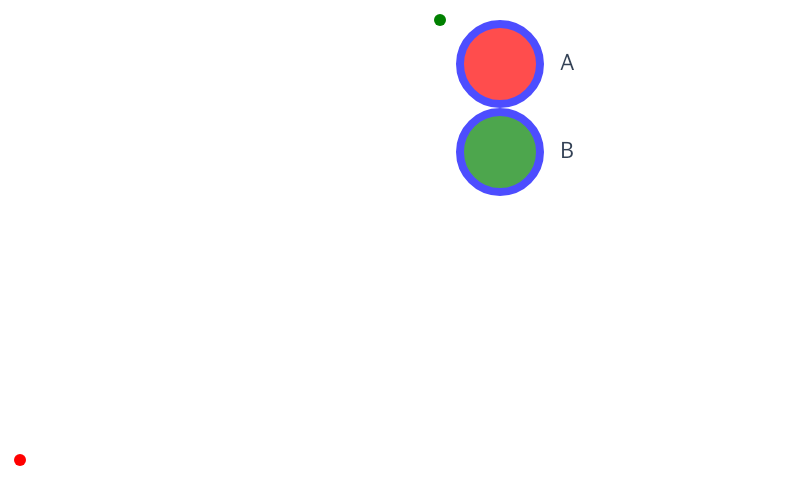
Each symbol.layers line, point or swatch accepts optional opacity in0..1.
The supplied value applies once to that layer’s complete fill and outline;
it does not change other recipe layers, labels, title or frame. Omission keeps
historical fallback appearance. Replacing a recipe without opacity, including
symbol:'auto', removes its explicit layer opacity.
Contextual fragment. Use an ES module with the imports, data, and prepared resource state described in this section. Caller-provided receivers:
program. Resolve these names from setup in this fragment or section; alternatives branch from the same base.
program.createLegend({
  channels: ['shape'],
  symbol: {layers: [
    {type: 'line', opacity: 0.3},
    {type: 'point', fill: 'red', stroke: 'blue', strokeWidth: 4, opacity: 0.7}
  ]}
});
A mapped size-shape block retains its mapped shape and physical area when the point layer supplies opacity. Canvas uses a bounded transparent glyph source; SVG uses whole-element opacity. PDF rasterizes only the explicitly affected glyph, preserving surrounding vector output. Existing block symbol-opacity patches retain their established behavior and do not opt into this new path.
Independent legend appearance
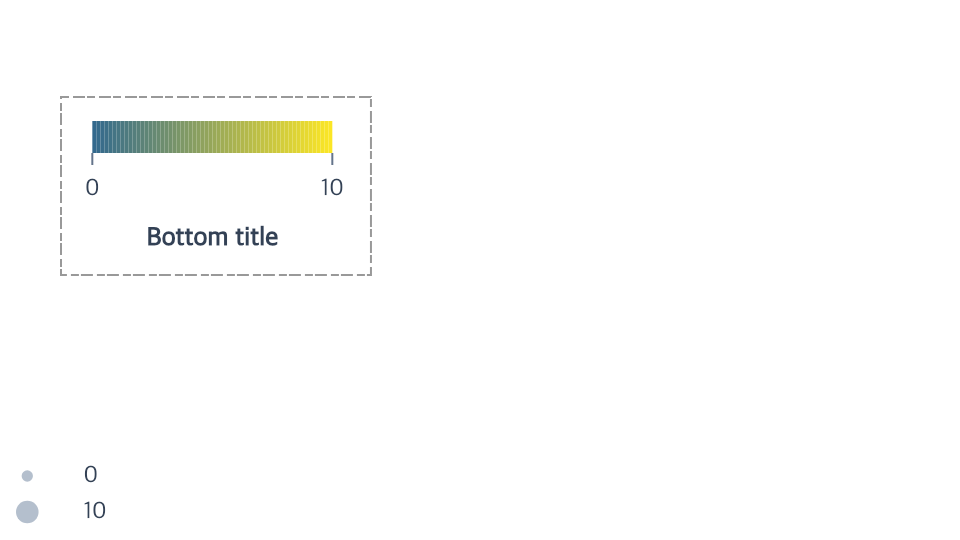
The complete example starts with a color legend, then edits its gradient,
orientation, title and border. Its horizontal ramp measures 120 by 16 logical
pixels. The bottom title clears the full strip, ticks and labels by 12 pixels.
The border uses one continuous [4, 2, 6, 1] dash pattern around the frame.
A later block edit moves only the size legend to "bottom-left"; the gradient
keeps its own placement.
Layered recipe opacity
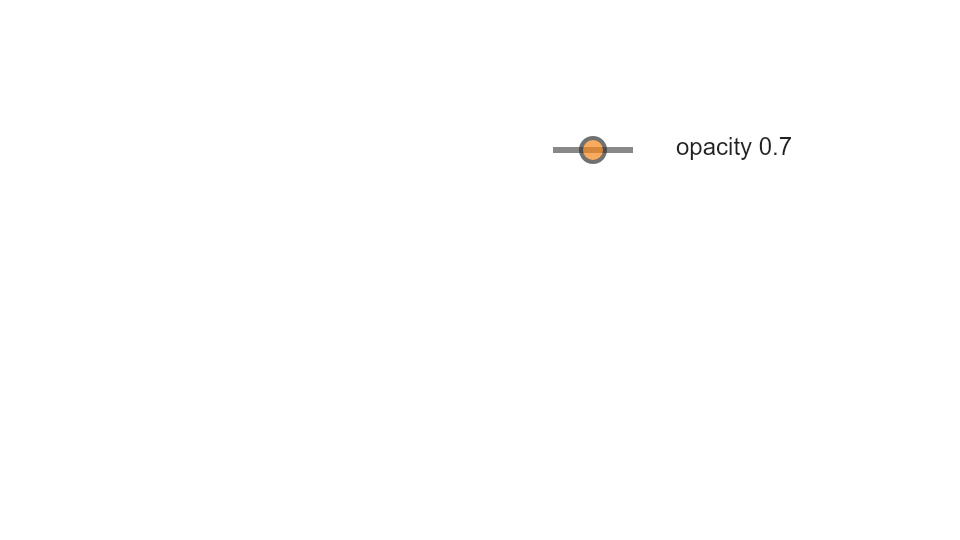
The linked canonical source has a createRecipeOpacityProgram(opacity) factory.
It builds one line-and-point recipe with an explicit opacity of 0, 0.7 or 1
on both layers. These are separate authored recipes; the categorical legend
does not infer opacity from individual categories. Each case retains the same
40-pixel line, 6-pixel point radius, outline and opaque label. The original
single-point opacity example remains available above.
Sample windows
Keep an encoded size while showing only a vertical slice of its symbol:
Contextual fragment. Use an ES module with the imports, data, and prepared resource state described in this section. Caller-provided receivers:
program. Resource selectors used here:target: "points". Resolve these names from setup in this fragment or section; alternatives branch from the same base.
program.createLegend({ channels: ["size"], clipHeight: 30 });
program.editLegendSymbols({ channel: "size", clipHeight: 24 });
program.editLegendBlock({ target: "points", channel: "size", clipHeight: "auto" });
A positive finite clipHeight centers the window on each glyph anchor. The
original radius, physical area, shape and stroke remain intact; the symbol is
cropped rather than shrunk. Labels, titles and frames stay outside the window.
Item spacing uses the visible sample and label bounds. Smaller symbols retain
their original height.
This applies to sampled size, opacity and color-symbol legends, combined legends,
and categorical recipes containing a point. Every layer of a composite sample
shares its window. Gradient ramps, interval swatches, line-only recipes and
stroke-width samples reject this option. Editing with "auto" removes the window;
omitting it preserves the current setting.
Quantitative color and size
createLegend({combine: "color-size"}) creates one numeric sample list for a
Cartesian circle point mark. Both encodings must use the same quantitative
field and grain, continuous scales, and identical finite domain endpoints.
Each sample uses the original color mapper and sqrt(mappedArea / Math.PI);
transformed scales keep their independent mappings. Mark data and mappings do
not change. Omission keeps separate legends.
Contextual fragment. Use an ES module with the imports, data, and prepared resource state described in this section. Caller-provided receivers:
program. Resource selectors used here:target: "points". Resolve these names from setup in this fragment or section; alternatives branch from the same base.
program.createLegend({combine: "color-size", values: [0, 5, 10]});
program.editLegendSymbols({channel: "color", symbol: {stroke: "black", strokeWidth: 1, opacity: 0.7}});
program.editLegendBlock({target: "points", channel: "size", labelMap: [{value: 5, label: "middle"}]});
program.editLegend({combine: "separate"});
Color and size select the same block. Exact values, automatic count, numeric format, labels, title, local position, border and sample window each have one owner. Mapped fill, size and radius cannot be overridden. A sample’s stroke, stroke width and opacity can be styled. Splitting restores a gradient and a size list, retains compatible shared styles and placement, and carries exact samples only to the size list. Recombining starts with combined defaults. Incompatible field, shape, grain or endpoint edits fail atomically.
The combined legends example compares samples 0, 5 and 10 with independently specified black, gray and white circles of radius 1, 2 and 3.
Related
Legend overview · Composite symbols · Editing legends
Documentation provenance
293 actions · sha256:e755591a2e5f5e2b494867583876e28020a478c5220b77bdc6ad469a6224891d