Published-release documentation · release compatibility
Quantitative Positions
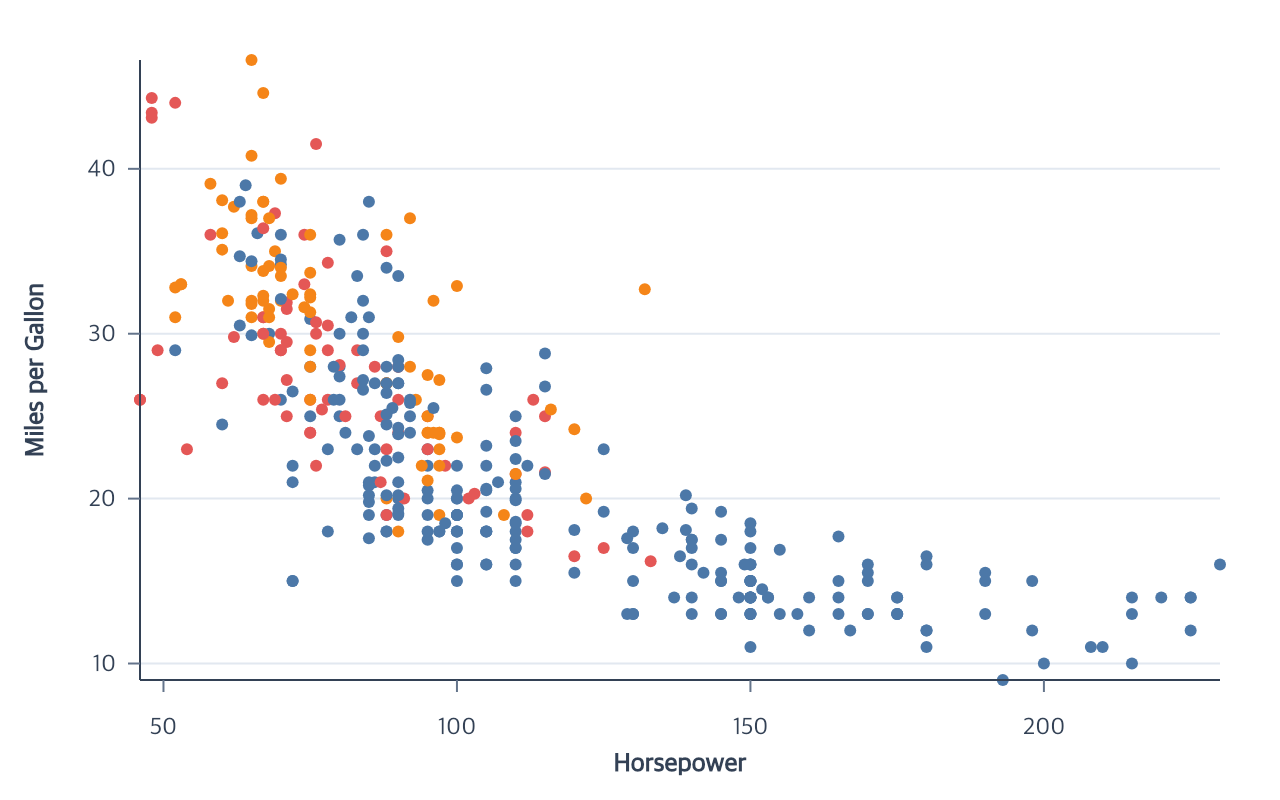
At a glance
| Action | Shortest call | Required state | Result |
|---|---|---|---|
encodeX |
encodeX({ field: "x" }) |
point mark and finite field | Concrete horizontal positions |
encodeY |
encodeY({ field: "y" }) |
point mark and finite field | Concrete vertical positions |
Point encodeX(options) and encodeY(options)
Contextual fragment. Use an ES module with the imports, data, and prepared resource state described in this section. Resolve these names from setup in this fragment or section; alternatives branch from the same base.
program
  .encodeX({ field: "Horsepower" })
  .encodeY({ field: "Miles_per_Gallon" });
| Option | Type | Default |
|---|---|---|
field |
non-empty string | required |
target |
point mark ID | current mark |
fieldType |
"quantitative" |
"quantitative" |
coordinate |
coordinate ID | layer coordinate, then "main" |
scale.id |
scale ID | channel name |
scale.type |
"linear" |
"linear" |
scale.domain |
"auto" or two finite numbers |
"auto" |
scale.range |
"auto" or two finite numbers |
"auto" |
scale.nice |
boolean | omitted |
scale.zero |
boolean | omitted |
Automatic domains combine compatible fields that share a scale. Automatic ranges use plot bounds, and every encoded value must be finite. The actions ensure a Cartesian coordinate exists and attach it to the point layer.
Calling the same action again on the same target replaces that channel’s
field. If scale.id is omitted, the current channel scale is reused and all
connected marks, axes, and grids are recomputed. An explicit new scale ID
rebinds a non-shared guide while retaining the old named scale. Inferred axis
titles follow the new field; explicit titles and appearance stay unchanged.
Errors and limitations
A conflicting layer coordinate, non-Cartesian coordinate, cross-channel scale, or non-finite field value is rejected before partial output is retained. A guide cannot be rebound away from a scale that still has another consumer.
Related
Position encoding index · Scale options · Scatterplot tutorial
Documentation provenance
293 actions · sha256:e755591a2e5f5e2b494867583876e28020a478c5220b77bdc6ad469a6224891d