Published-release documentation · release compatibility
Chart API
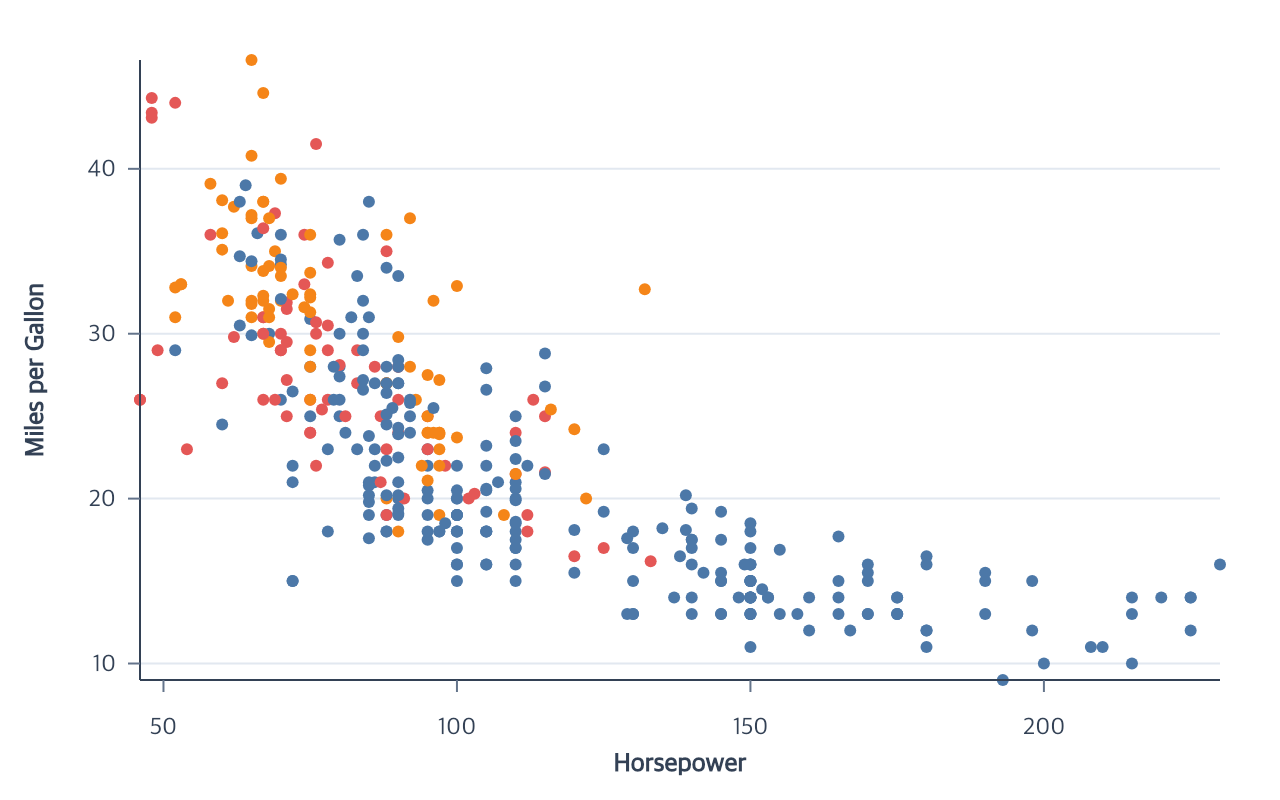
Build a chart from a small set of domain actions. Start with the family that owns the decision you need to make; follow its focused pages only when the overview no longer provides enough control.
Basic chartsCreate scatter, line, bar, histogram, and heatmap charts from their minimum field decisions.
CanvasCreate and resize the drawing surface, background, and plot margins.
Data and transformsCreate immutable source data, derived datasets, filters, bins, windows, and statistical transforms.
MarksCreate point, line, area, bar, and rule layers.
EncodingsMap fields and constants to position, grouping, and appearance.
CoordinatesUse Cartesian, Polar, or Parallel coordinate systems.
ScalesControl domains, ranges, mapping types, palettes, and missing values.
Parallel coordinatesCompare each source row across an ordered set of dimension-local scales.
Guides and titlesCreate axes, grids, legends, and chart titles from existing encodings.
Program compositionArrange complete chart programs horizontally or vertically and replace stable child slots.
RenderingRender the fully materialized program to Browser Canvas, SVG, Node PNG, or vector PDF.
All complete chart families
The complete chart picker covers every complete-chart facade, including Pie, Area, Density, Horizon, endpoint charts, ECDF, Rug, Strip, Beeswarm, and Raincloud.
Statistical and distribution facades
RegressionAdd grouped fitted lines and optional confidence bands to encoded observations.
Error barsShow observed values with explicit or derived interval endpoints.
Error bandsShow continuous uncertainty ribbons with optional boundaries.
Box plotsSummarize quartiles, whiskers, medians, and outliers by category.
Gradient plotsCompare category distributions as compact density fills.
Violin plotsCompare symmetric or split density shapes by category.
Exact action lookup
Use the complete action reference when you know an action name and need its canonical signature. Extension authors should use the extension API rather than depending on internal trace operations.
Documentation provenance
293 actions · sha256:e755591a2e5f5e2b494867583876e28020a478c5220b77bdc6ad469a6224891d