Published-release documentation · release compatibility
Cars Histogram Tutorial
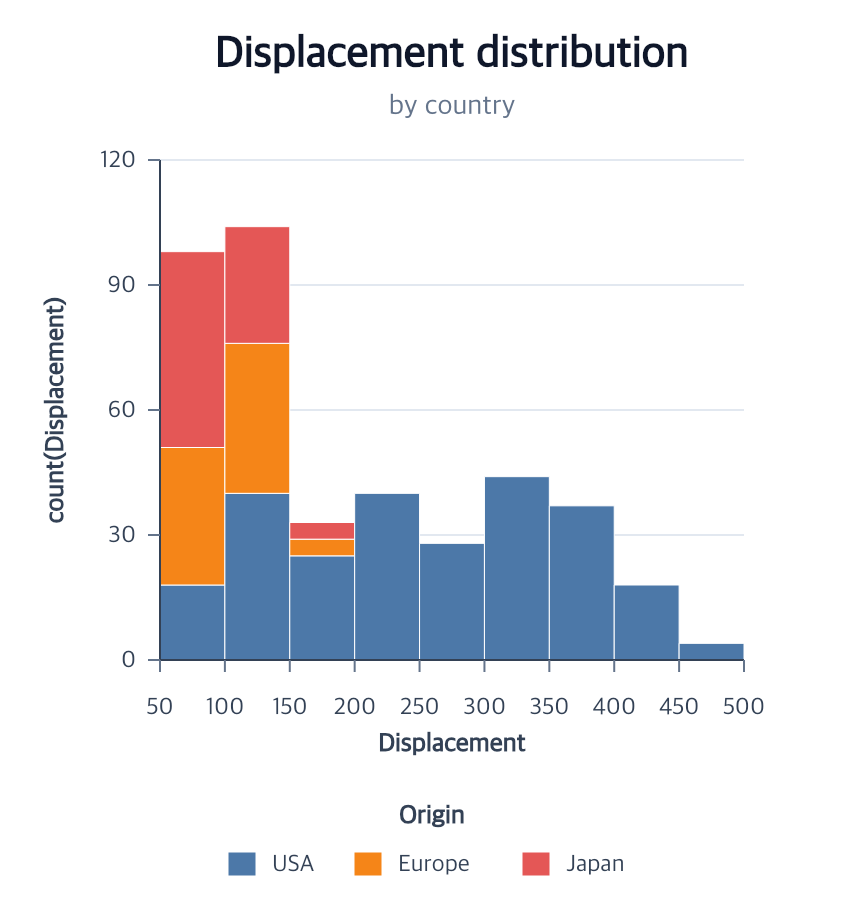
This chart bins car displacement, counts the rows in each bin, and stacks those counts by origin. The complete module uses the public npm package. The repository also contains a runnable browser example and its complete program.
Start with the Vite project from Getting Started, then place the tutorial dataset in Vite’s public directory:
mkdir -p public
curl --fail --location https://raw.githubusercontent.com/ggaction/ggaction/6422776b0a379c8c89809f41b434f366fbc1f143/data/cars.json --output public/cars.json
Complete program
import { chart, render } from "ggaction";

const response = await fetch("/cars.json");
if (!response.ok) throw new Error(`Failed to load cars: ${response.status}`);
const cars = await response.json();

const rows = cars.filter(
  car =>
    Number.isFinite(car.Displacement) &&
    typeof car.Origin === "string" &&
    car.Origin.length > 0
);

const program = chart()
  .createCanvas({
    width: 432,
    height: 460,
    margin: { top: 80, right: 60, bottom: 130, left: 80 }
  })
  .createData({ id: "cars", values: rows })
  .createHistogram({
    id: "bars",
    field: "Displacement",
    maxBins: 10,
    xScale: { nice: true, zero: false },
    color: { field: "Origin", scale: { palette: "tableau10" } },
    guides: { legend: { position: "bottom", layout: "legacy-bottom" } }
  })
  .createTitle({
    text: "Displacement distribution",
    subtitle: "by country",
    align: "center"
  });

render(program, document.querySelector("#chart").getContext("2d"));
What the actions establish
| Stage | Semantic result | Graphical result |
|---|---|---|
createHistogram |
Bar layer, atomic bin/count positions, nominal stack identity, scales, and guides | Category-colored bin rects plus bin-aligned axes, grid, and bottom legend |
createTitle |
Chart title and subtitle text | Plot-centered title graphics |
The facade calls atomic encodeHistogram because its x binning and y
count/stack meaning are interdependent. That action still exposes wrapped
encodeX and encodeY children. The source dataset remains unchanged; bin
counts and stacked geometry are derived and materialized separately.
Use maxBins for an inferred nice partition, binStep for an exact
zero-anchored width, or binBoundaries for explicitly authored irregular
intervals. These options are mutually exclusive. Calling encodeHistogram
again replaces the complete bin/count assignment and refreshes inferred axes
and grids while preserving compatible color grouping and legends.
To compare proportions instead of absolute counts, set the color layout to
"fill". It invokes normalized y stacking and produces a [0, 1] axis:
program.encodeColor({ field: "Origin", layout: "fill" });
Legends default to the right for every supported chart. This example passes
position: "bottom", layout: "legacy-bottom" to retain its compact row near
the Canvas bottom. The default layout: "edge" uses the plot margin instead;
reserve enough space and set an offset below any x-axis title.
Key action trace
The atomic histogram action exposes its interdependent position actions as children, while guide selection remains a separate aggregate.
program
├─ createHistogram
│  ├─ createBarMark
│  ├─ encodeHistogram
│  │  ├─ encodeX
│  │  └─ encodeY
│  │     └─ rematerializeBarMark
│  ├─ encodeColor
│  │  └─ rematerializeBarMark
│  └─ createGuides
│     ├─ createAxes
│     ├─ createGrid
│     └─ createLegend
└─ createTitle
Run and continue
- Serve the repository root and open
examples/cars-histogram/. - View the complete chart program.
- Continue with Encodings, Guides, Titles, and the Basic Chart contract.
Documentation provenance
293 actions · sha256:e755591a2e5f5e2b494867583876e28020a478c5220b77bdc6ad469a6224891d