Published-release documentation · release compatibility
Heatmap Recipe
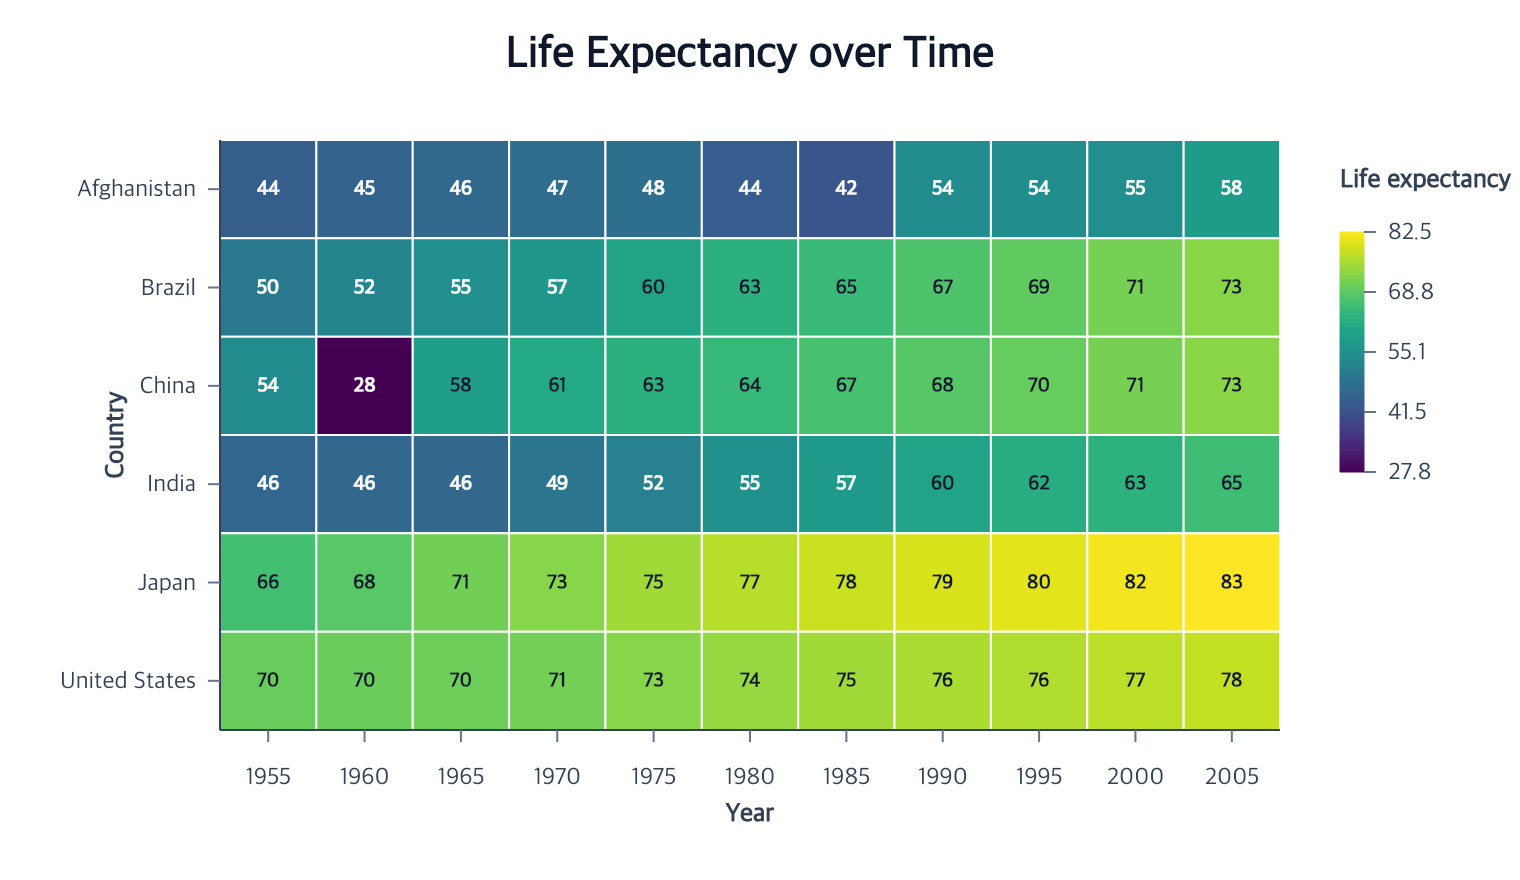
Pre-gridded flow
Runnable: install ggaction and provide the named data array as plain row objects.
import { chart } from "ggaction";

const program = chart()
  .createCanvas({ margin: { right: 120 } })
  .createData({ values: cells })
  .createHeatmap({
    x: { field: "column", fieldType: "ordinal" },
    y: { field: "row", fieldType: "nominal" },
    color: {
      field: "value",
      fieldType: "quantitative",
      scale: { type: "sequential", palette: "viridis" }
    }
  });
Raw-row binned flow
Runnable: install ggaction and provide the named data array as plain row objects.
import { chart } from "ggaction";

const program = chart()
  .createCanvas({ margin: { right: 120 } })
  .createData({ values: observations })
  .createHeatmap({
    x: "weight",
    y: "economy",
    bin: { bins: { x: 10, y: 8 } },
    color: { scale: { palette: "blues" } }
  });
This mode derives rectangular x/y bounds and a count for each cell. It emits the complete grid by default, including zero-count cells.
You must decide
- Whether rows are already at one-row-per-cell grain or require
bin - The two position fields
- The color field for pre-gridded rows; binned mode owns its generated count
- Optional bin counts or explicit extents when the defaults are not appropriate
The library infers
- Band scales for the two discrete positions
- One concrete rectangle per valid observed row
- A categorical or continuous color scale and matching legend
- Cartesian axes and horizontal grid
In binned mode, the library instead infers quantitative position scales from
the resolved bin extents, a continuous count scale, source-facing axis titles,
and a Count legend. It disables separate chart grid lines unless requested.
Use rect: { opacity, stroke, strokeWidth } for cell appearance. Cell fill is
owned by the required color encoding. The following continuation applies only to the pre-gridded flow above, whose source rows contain value. Set program to that branch; the raw-row binned branch owns generated count data and cannot use this source-field label:
const labeled = program
  .createTextMark({ align: "center", baseline: "middle" })
  .encodeText({ field: "value", format: ".0f" });
Continue
Basic Charts · Rectangular 2D bins · Rect marks · Continuous color scales
Documentation provenance
293 actions · sha256:e755591a2e5f5e2b494867583876e28020a478c5220b77bdc6ad469a6224891d