Published-release documentation · release compatibility
Statistical Data Transforms
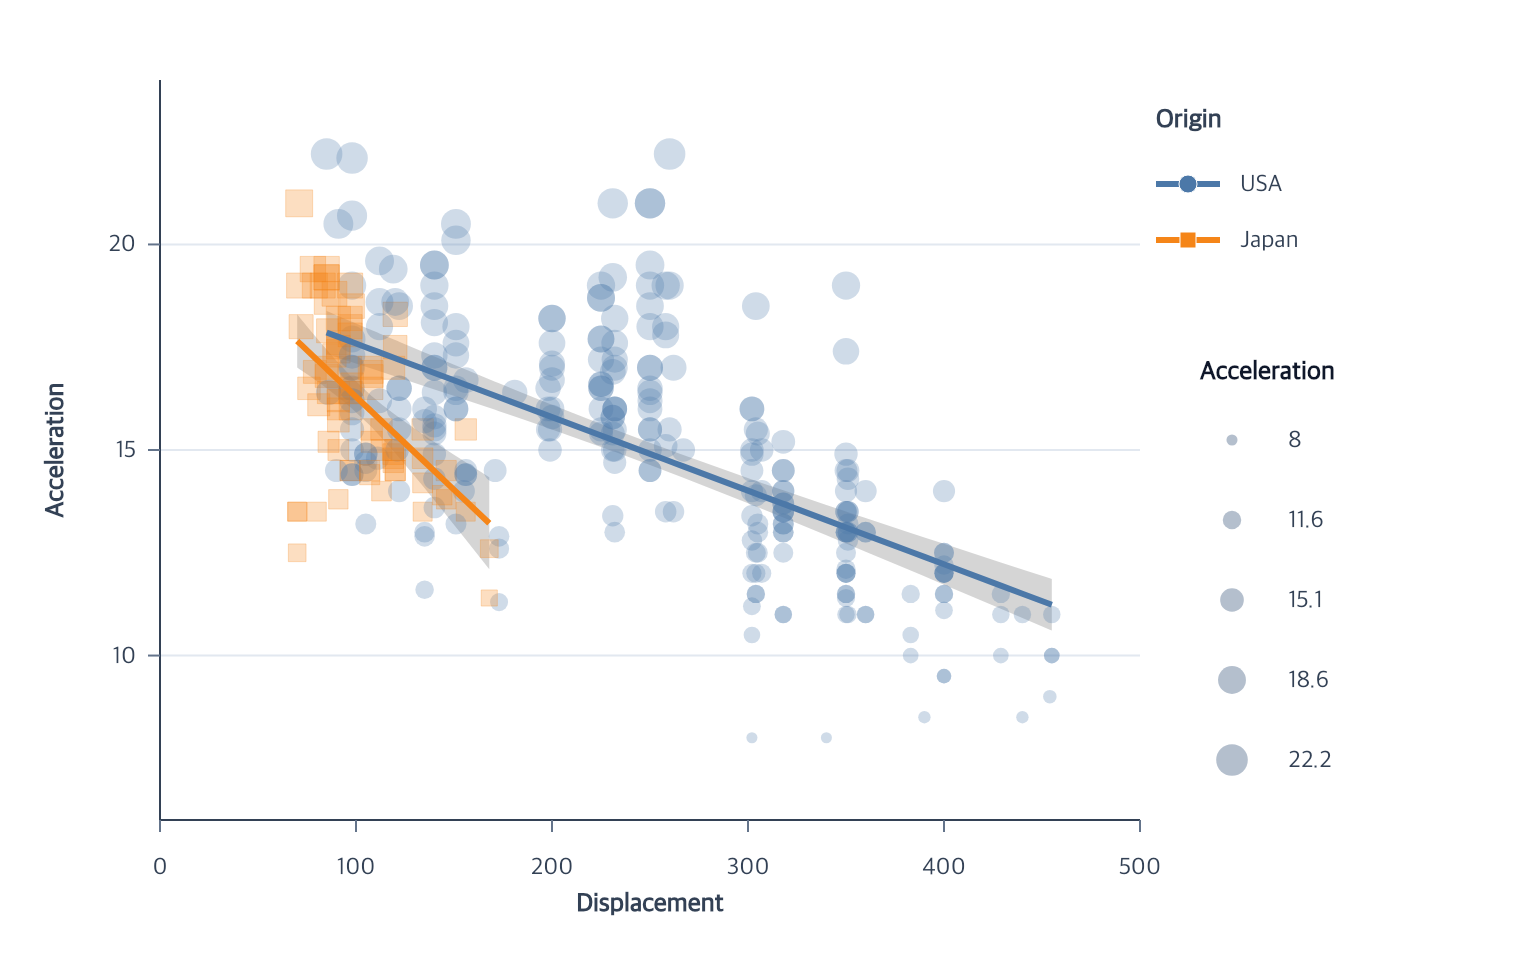
createRegressionData({ id, source?, x, y, groupBy?, method?, degree?, span?, confidenceMethod?, level?, confidence?, interval?, predict?, missing? })
This heading shows common options. For the full callable contract and all branches, see createRegressionData and the exact declarations.
Create deterministic regression predictions from an existing dataset. This is an advanced data action used by higher-level regression chart actions.
Contextual fragment. Use an ES module with the imports, data, and prepared resource state described in this section. Caller-provided receivers:
program. Resolve these names from setup in this fragment or section; alternatives branch from the same base.
program.createRegressionData({
  id: "regressionData",
  x: "Displacement",
  y: "Acceleration",
  groupBy: "Origin"
});
| Option | Type | Default |
|---|---|---|
id |
new dataset ID | required |
source |
existing dataset ID | current dataset |
x, y |
finite quantitative field names | required |
groupBy |
nominal field name | one ungrouped model |
method |
"linear", "polynomial", "loess", or "exp" |
"linear" |
degree |
integer from 1 through 32 for polynomial |
2 |
span |
number greater than 0 and at most 1 for LOESS |
0.75 |
robustIterations |
integer 0 through 32, LOESS only |
0 |
confidenceMethod |
"normal" or "student-t"; not accepted by LOESS |
"student-t" |
level |
number strictly between 0 and 1; not accepted by LOESS |
0.95 |
confidence |
compatibility alias for level; must match it when both appear |
omitted |
interval |
"mean", "prediction", or false; not accepted by LOESS |
"mean" |
predict |
{ values } or { domain, steps } |
observed unique x values |
missing |
"error" or "drop" |
compatibility behavior when omitted |
Linear and polynomial fits use stable least squares. Fit-only linear models
require two rows; fit-only polynomial models require degree + 1 rows and
distinct x values. Confidence intervals require the additional residual
degrees of freedom. Set interval: false for fitted values without lower and
upper confidence fields. LOESS uses
tricube-weighted local-linear fits over max(2, ceil(span * groupSize)) nearest rows,
with source order breaking distance ties. Output follows group first appearance
and the chosen prediction grid. Explicit prediction values must be finite,
unique, and strictly ascending; a domain requires at least two steps. Linear
and polynomial interval output includes fixed __regression_ci_lower /
__regression_ci_upper fields; fit-only and LOESS output does not.
Source values remain unchanged.
Regression output is limited to 10,000 unique group/x rows. Polynomial and LOESS fitting reject inputs whose estimated work exceeds 10,000,000 units, before allocating or entering the expensive fit.
Exponential fits use positive-response-weighted least squares on log(y);
omitted or false intervals produce no confidence fields. Confidence options,
degree, span, and robust iterations are rejected. See the regression API
for the positive-response and representable-result requirements.
Linear fit statistics
createRegressionStatisticsData({ id, source }) creates reusable rows from an
explicit existing linear regression dataset. Both options are required.
It reuses the existing fit and does not infer a source from the current dataset.
This advanced data action is available in the full entry.
Contextual fragment. Use an ES module with the imports, data, and prepared resource state described in this section. Resource selectors used here:
source: "fit". Resolve these names from setup in this fragment or section; alternatives branch from the same base.
import { chart } from "ggaction";

const program = chart()
  .createData({ values: [{ x: 0, y: 1 }, { x: 1, y: 2 }, { x: 2, y: 4 }] })
  .createRegressionData({ id: "fit", x: "x", y: "y" })
  .createRegressionStatisticsData({ id: "fitStatistics", source: "fit" });
Each row contains fixed count, intercept, slope, and rSquared fields.
count describes eligible observed pairs, independent of prediction-grid size.
R-squared is 1 - SSE / SST; a constant response has rSquared: null.
Grouped fits add their original typed grouping field in first source appearance
order. Group fields named like a fixed output are rejected. Polynomial, LOESS,
exponential, and ordinary raw datasets are unsupported sources.
editRegressionStatisticsData({ target?, source? }) changes the fit source and
replays dependent data and annotations atomically. Omitted source preserves
it. Omitted target uses the current statistics owner, otherwise the unique
standalone owner; ambiguous ownership fails. Fixed output names have no aliases
or reset options. Data revisions update fit statistics before their consumers.
Remove dependent statistics and consumers before changing a fit to an
unsupported model or deleting its source.
Editable snapshots retain compact fit statistics for reuse. Earlier snapshots without them still load without recalculation; the first explicit statistics request computes and retains the fit once. Existing prediction rows, graphics, and authoring trace remain unchanged, although serialized bytes can increase.
createIntervalData({ id, source?, field, groupBy?, center?, extent?, method?, level?, missing?, as? })
Create immutable grouped interval-summary rows independently from an error-bar mark.
Contextual fragment. Use an ES module with the imports, data, and prepared resource state described in this section. Caller-provided receivers:
program. Resolve these names from setup in this fragment or section; alternatives branch from the same base.
program.createIntervalData({
  id: "accelerationIntervals",
  field: "Acceleration",
  groupBy: "Origin"
});
| Option | Type | Default |
|---|---|---|
id |
new dataset ID | required |
source |
existing dataset ID | current dataset |
field |
quantitative field name | required |
groupBy |
field name or array of field names | one ungrouped interval |
center |
"mean" or "median" |
"mean" |
extent |
"stderr", "stdev", "ci", or "iqr" |
"ci" |
method |
"normal", "student-t", or { type: "bootstrap", seed, samples? } |
"student-t" for CI |
level |
number strictly between 0 and 1 |
0.95 for CI |
missing |
"error" or "drop" |
compatibility behavior when omitted |
as |
{ center, lower, upper } distinct field names |
ID-namespaced fields |
Mean supports standard error, sample standard deviation, and two-sided normal
or Student-t confidence intervals. Explicit seeded percentile-bootstrap mean CI
also uses the shared resampling contract;
editIntervalData accepts the same method and preserves raw data. Bootstrap centers
and endpoints retain full finite JavaScript Number precision; other interval methods
keep their existing decimal output boundary. Median requires interquartile range, and IQR
requires median. Group order follows first appearance. Missing group values,
non-finite measures follow the explicit missing policy when provided;
undersized mean groups fail with a diagnostic. Valid source rows
and the source dataset remain unchanged. A summary whose derived finite center
or endpoint is not representable throws a RangeError atomically.
createDensityData({ id, source?, field, groupBy?, bandwidth?, extent?, steps?, kernel?, normalization?, weight?, missing?, as? })
Create an immutable kernel-density dataset. This is an advanced data action used by higher-level density-chart encodings.
Contextual fragment. Use an ES module with the imports, data, and prepared resource state described in this section. Caller-provided receivers:
program. Resolve these names from setup in this fragment or section; alternatives branch from the same base.
program.createDensityData({
  id: "accelerationDensity",
  field: "Acceleration",
  groupBy: "Origin",
  bandwidth: 0.6
});
| Option | Type | Default |
|---|---|---|
id |
new dataset ID | required |
source |
existing dataset ID | current dataset |
field |
quantitative field name | required |
groupBy |
nominal field name | one ungrouped density |
bandwidth |
positive number or "auto" |
automatic rule-of-thumb estimate |
extent |
ascending finite pair or "auto" |
observed valid extent |
steps |
integer from 2 through 10,000 |
100 |
kernel |
"gaussian", "epanechnikov", "uniform", or "triangular" |
"gaussian" |
normalization |
"unit" or "count" |
"unit" |
weight |
{ field, kind: "frequency" | "reliability" } |
unweighted |
missing |
"error" or "drop" |
compatibility behavior when omitted |
as |
two distinct output field names | <field>_value, <field>_density |
Grouped densities use one shared extent and inclusive sample grid. Group order
follows first appearance. Transform provenance keeps the requested bandwidth
and extent values—including "auto"—and stores the materialized revision’s
concrete values separately as resolved: { bandwidth, extent }. Kernel and
normalization defaults are stored directly. Unit normalization integrates
each complete group density to one; count normalization scales it by that
group’s valid sample count. Density output is limited to 10,000 rows, and
valid source rows multiplied by steps must not exceed the 10,000,000-unit
work budget. Source values remain unchanged.
Weighted density validates every requested value and weight, including rows
whose weight is zero. Only positive-weight rows contribute to the observed
extent, profiles, and membership. unit divides weighted kernel mass by total
weight; count preserves that mass. Automatic bandwidth uses weighted sample
spread and effective sample size, and is recomputed for every group, split
profile, and facet child. Multiple profiles store their individual resolved
bandwidths in first-appearance order. Frequency weights are non-negative safe
integers; reliability weights are non-negative finite numbers. Use an explicit
positive bandwidth when a weighted profile has effective sample size one.
Summary, bin, density, interval, and regression materializers store calculation
reports in materializationConfigs.calculations.datasets[id]. Reports expose
input, accepted, and dropped row counts plus transform-specific group or output
counts. Editing or revising a derived dataset replaces its report; releasing
the dataset removes it.
Related
Data overview · Chart API · Action reference
Documentation provenance
293 actions · sha256:e755591a2e5f5e2b494867583876e28020a478c5220b77bdc6ad469a6224891d