Published-release documentation · release compatibility
Encodings
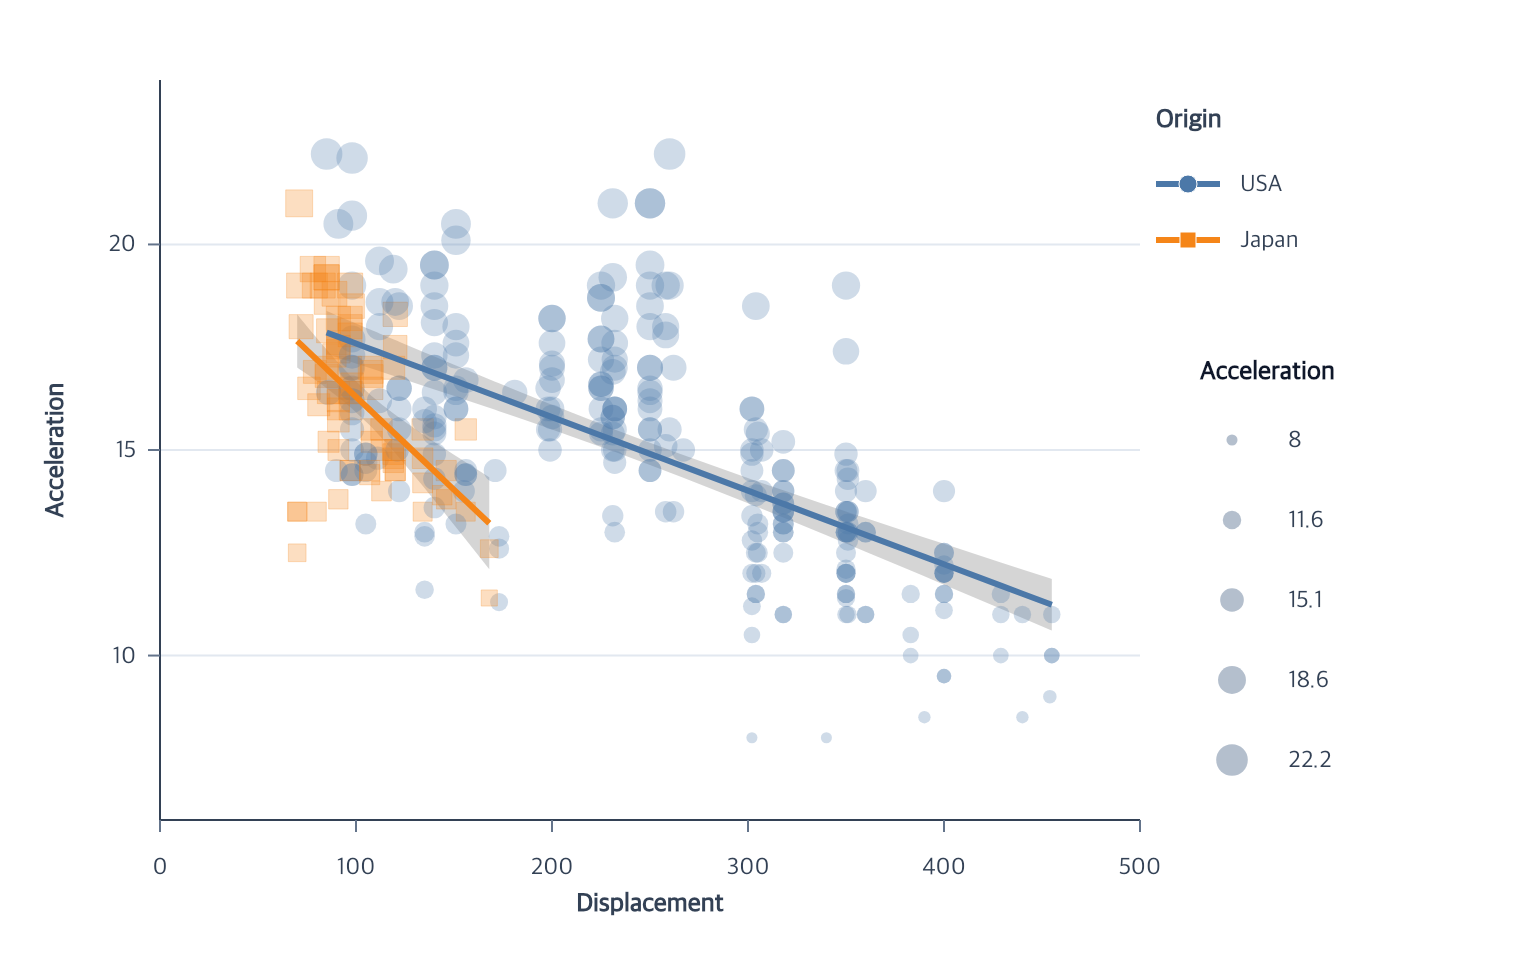
Encoding actions connect data fields or constants to chart channels. Ordinary authors choose the relationship; ggaction infers a unique target, coordinate, scale ID, and field type when the stored program makes that choice safe.
Reassign an existing encoding
Calling an available field encoding again can replace settings on its bound
scale. In ggaction/basic, same-type reassignment uses the same validation and
mark, axis, grid, and legend updates as Full. Every shared consumer must remain
valid; failure preserves the earlier program and caller data.
Basic still has no public editScale, focused scale editors, or legend editors.
Scale-type transitions require Full, or a new scale ID in Basic. Saving a Basic
program preserves its internal actions; restoring it returns the existing
editable Full program. See Saved programs.
Choose a family
Supported mark/channel matrix
The tables below are generated from the same reviewed capability registry used by the focused API pages.
Position channels
| Action | Supported marks | Field types | Important modes |
|---|---|---|---|
encodeX |
point, line, area, bar, rect, rule, tick, text | point/line/area/bar/rect/rule/tick/text: quantitative, temporal, ordinal, nominal | field; rule, area, rect, and independent text also accept datum; bar accepts aggregate or bin |
encodeY |
point, line, area, bar, rect, rule, tick, text | point/line/area/bar/rect/rule/tick/text: quantitative, temporal, ordinal, nominal | field; rule, area, rect, and independent text also accept datum; bar accepts aggregate or count |
encodeX2 / encodeY2 |
area, ranged bar, rect, rule | area/ranged bar/rect/rule: matching primary | secondary field; rule, area, and rect also accept datum |
encodeTheta |
point, line, arc | point/line: quantitative, temporal, ordinal, nominal; arc: quantitative, ordinal, nominal | arc maps direct quantitative values, category counts, or category-weighted sums to proportional sectors |
encodeR |
point, line, arc | point/line/arc: quantitative | radial position; arc combines it with a categorical theta band |
encodeParallelCoordinates |
line | line: quantitative, ordinal | atomic ordered dimensions; one namespaced scale and axis per dimension |
encodeDx / encodeDy |
text | text: quantitative | independent Text only; finite field or constant logical-pixel offsets, no scale or guide; field offsets establish row grain |
Color channels
| Mode | Supported marks | Field types | Important options |
|---|---|---|---|
| Categorical | point, line, area, bar, rect, arc, text | point/line/area/bar/rect/arc/text: nominal, ordinal | bar/area layout; arc overlay; palette and ordinal scale; explicit-domain row-owned Cartesian line color supports unknown paint |
| Continuous | point, aggregate bar, rect, text, area, tick | point/rect/text/tick: quantitative, temporal; aggregate bar/area: quantitative | sequential scale; aggregate required for a different bar measure; area requires one finite value per existing series; tick paints its centered segment and rejects simultaneous stroke |
| Discretized continuous | point, aggregate bar, rect, text, area, tick | point/aggregate bar/rect/text/area/tick: quantitative | quantize, quantile, or threshold scale; area requires one finite value per existing series; tick maps colors per row |
Independent stroke channel
| Mode | Supported marks | Field types | Scale and grain constraints |
|---|---|---|---|
| Constant | point, line, area, bar, rect, arc, rule, tick | point/line/area/bar/rect/arc/rule/tick: constant color or supported reset | Independent from fill/color; no scale; field-to-constant removes the stroke legend |
| Categorical | point, line, area, bar, rect, arc, rule, tick | point/line/area/bar/rect/arc/rule/tick: nominal, ordinal | ordinal scale; one unambiguous value per final item; Line/Area values must be constant within each series |
| Continuous | point, line, area, bar, rect, arc, rule, tick | point/line/area/bar/rect/arc/rule/tick: quantitative, temporal | sequential scale; no aggregate option; unknown fallback is row-owned Point only; series and final-item uniqueness still apply |
| Discretized continuous | point, line, area, bar, rect, arc, rule, tick | point/line/area/bar/rect/arc/rule/tick: quantitative | quantize, quantile, threshold; same final-item and series constraints |
Other appearance channels
| Action | Marks | Field types | Scale family | Item grain and units |
|---|---|---|---|---|
encodeSize |
point | quantitative, nominal, ordinal | linear, log, sqrt, pow, quantize, quantile, threshold; ordinal for categories | row-owned point; range values are areas; remove explicit radius first |
encodeShape |
point | nominal | ordinal | row-owned point; conflicts with explicit constant shape |
encodeOpacity |
point, line, rule, bar | quantitative or constant | linear for field; none for constant | point/rule item, complete line series, or final bar cell; values within one series/cell must agree |
encodeStrokeWidth |
line, rule | quantitative or constant | linear, log, sqrt, pow, symlog for field; none for constant | complete line series or rule item; width in logical pixels |
encodeStrokeDash |
line, rule | nominal or constant | ordinal for field; none for constant | complete line series or rule item; series values must agree |
encodeAngle |
point, tick | quantitative or constant | none | item; clockwise degrees; circles retain the angle as a visual no-op |
encodePointRadius / encodeRadius |
point | constant | none | glyph radius in logical pixels; independent from Polar position r |
encodeBarWidth |
bar | constant band fraction, pixels, or UTC calendar interval | parent category band, temporal interval, or quantitative slot | aggregate or ranged bar; histogram bins own their width |
Selection and guides
| Action | Supported marks | Grain | Result |
|---|---|---|---|
selectMarks / highlightMarks |
point, bar, line, area, rect, arc, rule, tick | item; stacked bars also support stack | selection intent and mark-specific durable emphasis |
| Legend family | Supported marks | Channels |
|---|---|---|
| Categorical color/shape/dash | point, line, area, bar, rect, arc, text | ordinal color; point shape; line strokeDash; compatible composites follow family constraints |
| Categorical stroke | point, line, area, bar, rect, arc, rule, tick | ordinal stroke; final-item or series identities |
| Continuous color gradient | point, aggregate bar, rect, text, tick | sequential color; gradient swatch, no symbol recipe |
| Continuous stroke gradient | point, line, area, bar, rect, arc, rule, tick | sequential stroke; separate gradient, no symbol recipe |
| Discretized color interval | point, aggregate bar, rect, tick | quantize/quantile/threshold color; rectangle swatches |
| Discretized stroke interval | point, line, area, bar, rect, arc, rule, tick | quantize/quantile/threshold stroke; outline-colored interval symbols |
| Size | point | size; continuous numeric samples or every discrete interval; point glyph symbol |
| Opacity | point, line, bar | quantitative opacity samples; representative point symbol even for line consumers; Rule opacity has no legend |
| Stroke width | line, rule | quantitative strokeWidth samples; line symbol |
| Axis family | Create | Edit | Editable components |
|---|---|---|---|
| Cartesian complete axis | createXAxis / createYAxis / createAxes |
editXAxis / editYAxis |
line, ticks, labels, ticksAndLabels, title, position |
| Polar complete axis | createThetaAxis / createRadialAxis / createAxes |
editThetaAxis / editRadialAxis |
line, ticks, labels, ticksAndLabels, title, radial angle and radial title position |
| Parallel dimension axes | createAxes / createParallelAxes / createParallelAxis |
editParallelAxis / removeParallelAxis / removeParallelAxes |
line, ticks, labels, title from each stored dimension |
Fixed or variable appearance
Use the same action for either a constant value or a data field. These are
mutually exclusive. Constants have no scale or legend; field mappings use the
existing scale options and final-item grain constraints. Switching to a constant
removes that channel’s legend participation, preserving other guides and styles.
Switching back to a field removes its constant override. Color supports point,
line, bar, area, arc, rect and text; size supports point marks.
Contextual fragment. Use an ES module with the imports, data, and prepared resource state described in this section. Resolve these names from setup in this fragment or section; alternatives branch from the same base.
import { chart } from "ggaction";
const data = [{ x: 1, y: 2, group: "A" }, { x: 2, y: 4, group: "B" }];
const fixed = chart().createCanvas().createData({ values: data })
  .createScatterPlot({ x: "x", y: "y", guides: false })
  .encodeColor({ value: "#4c78a8" })
  .encodeSize({ value: 64 }) // Equal graphical area, in square pixels.
  .encodeOpacity({ value: 0.7 });
const variable = fixed.encodeColor({ field: "group" })
  .encodeSize({ field: "y", scale: { range: [20, 240] } })
  .encodeOpacity({ field: "y", scale: { range: [0.25, 1] } });
encodeStroke likewise accepts constant colors or field mappings. Field-driven
Line/Area appearance must still be unambiguous within each series; fixed values
work without requiring a suitable field. encodeRadius remains a direct radius
assignment and rejects an active size mapping; use encodeSize({ value }) for
an atomic switch to constant area.
For an aggregate bar with no existing group or layout, coloring the same nominal/ordinal field used on the category axis preserves bar positions, widths, and heights. This applies to both vertical and horizontal bars. A different color field retains the default grouped layout. Explicit or previously stored layouts and independent series groups take precedence.
Direction
encodeAngle rotates point and Tick glyphs with finite direct degrees. It
accepts either one constant value or one quantitative field; it does not
create a scale or legend. 0 points up and positive values rotate clockwise.
Contextual fragment. Use an ES module with the imports, data, and prepared resource state described in this section. Resource selectors used here:
target: "ticks". Resolve these names from setup in this fragment or section; alternatives branch from the same base.
const directional = chart()
  .createCanvas({ width: 640, height: 360 })
  .createData({ values: directions })
  .createTickMark({ id: "ticks", length: 14 })
  .encodeX({ target: "ticks", field: "x" })
  .encodeY({ target: "ticks", field: "y" })
  .encodeAngle({ target: "ticks", field: "direction" });
Calling encodeAngle again replaces the complete constant/field assignment.
Use removeEncoding({ target: "ticks", channel: "angle" }) to restore the
unrotated vertical baseline. Tick length and point area remain unchanged.
Atomic relationships
Some relationships require several channels to change together. Prefer their atomic action unless you intentionally need the lower-level steps.
| Relationship | Shortest action | What changes together | Complete example |
|---|---|---|---|
| One mark, several encodings | encodeChannels({ target: "points", channels: { x: { field: "b" }, y: { field: "a" } } }) |
The final channel set, shared scales, marks, dependent labels, and legends | Encoding action reference |
| Histogram | encodeHistogram({ field: "value" }) |
Bin x, count y, stack policy, and both scales | Histogram recipe |
| Density | encodeDensity({ field: "value" }) |
Immutable density data, value/density positions, grouping, and area paths | Density tutorial |
| Horizon | encodeHorizon({ x: "time", y: "value" }) |
Signed bands, folded positions, color, and source-facing x guide | Horizon recipe |
| Parallel coordinates | encodeParallelCoordinates({ dimensions: ["a", "b"] }) |
Ordered local scales, row paths, and dimension axes | Parallel recipe |
encodeChannels is the Full-only advanced action for a final-state change on
one explicit mark. Its channels object accepts x/y and secondary positions,
Polar theta/r, offsets, grouping and path order, appearance, angle, and text.
Each nested payload is the corresponding focused action payload without
target or coordinate. Use scale.id inside a payload to share a named
scale. The request is atomic: one invalid field or incompatible shared-scale
definition leaves the earlier program unchanged, and omitted channels remain
unchanged. A Cartesian axis rebound across categorical and continuous scale
families keeps its style and title while its coupled default ticks and labels
switch to final-domain values or count mode. An incompatible explicit guide or
grid rejects the whole request without changing the earlier program.
Atomic density
encodeDensity derives immutable kernel-density rows and authors the value and
density positions together. It infers a Gaussian kernel, automatic bandwidth
and extent, 100 samples, and vertical density placement. groupBy, kernel,
normalization, categorical placement, side, and two-value split remain
available through its exact action contract.
steps is at most 10,000, the complete grouped output is at most 10,000 rows,
and density work is limited to 10,000,000 source-row/sample units.
Atomic Horizon
encodeHorizon derives signed bands around an inferred or explicit baseline.
It accepts existing compatible x/y encodings or explicit x and y, then
owns the folded y/y2 positions and positive/negative palettes as one action.
Horizon charts intentionally keep only the source-facing x guide.
An explicit color legend shows the original measure and band intervals.
Different independent extents use relative band labels. editHorizon refreshes
inferred labels while retaining authored titles and label maps.
bands is at most 10,000 and the complete run-by-band output is limited to
10,000 rows; unrepresentable signed deviations or fold extents are rejected.
editDensity and editHorizon create immutable derived-data revisions and
rematerialize their connected scales, paths, and guides. Density edits can
also replace source, field, or groupBy; groupBy: false removes grouping
while retaining output field names, density channel, coordinate, and position
scale IDs. The exact option and error contracts live in the
Encoding Action Reference.
Removing an encoding
Use removeEncoding({ channel, target? }) to remove one active assignment
without deleting its named scale, source dataset, or coordinate:
Contextual fragment. Use an ES module with the imports, data, and prepared resource state described in this section. Resolve these names from setup in this fragment or section; alternatives branch from the same base.
const plainPoints = encodedPoints
  .removeEncoding({ channel: "size" })
  .removeEncoding({ channel: "color" });
The closed channel list is x, y, x2, y2, xOffset, yOffset,
theta, radius, color, stroke, strokeDash, strokeWidth, size, shape,
angle, group, opacity, and text. Primary x/y removal also clears its same-mark
secondary endpoint and offset. Grouped-bar color removal clears its generated
offset, and matching legends, axes, or grids are removed only when they no
longer have a valid consumer.
The action rebuilds complete marks from an empty concrete baseline. An
incomplete mark remains empty and can be completed later by the ordinary
encoding action using the retained scale. If a stored selection directly reads
the removed semantic channel, removal fails before changing state; compatible
highlights are replayed on the rebuilt items. Use removePathOrder() for path
topology and the Parallel aggregate action for ordered dimensions.
Shared inference and ordering
targetuses the current compatible mark, then one unique compatible mark.- A missing Cartesian, Polar, or Parallel coordinate is created only when the channel family determines it unambiguously.
- Scale IDs default to the channel name; explicit IDs create independent resources.
- Position calls may arrive before or after a compatible mark. Incomplete semantic state remains invisible until the required relationship is complete.
- Layered marks reuse compatible position encodings when omitted instead of requiring duplicate x/y calls.
- Ambiguity produces an error instead of selecting the first resource.
Errors and limitations
Unsupported mark/channel/field combinations fail before partial state is authored. Removing a missing channel, an ambiguous owner, or a channel directly referenced by a stored selection also fails atomically. Use the generated compatibility matrix above, then open the focused family page for inference and ordering rules. If a valid action still selects nothing, see Troubleshooting.
Explicit grouping and time inputs
createRegression, encodeDensity and encodeHorizon accept groupBy: false
for a JSON-safe ungrouped result. Regression omission infers one color/shape
field; Density omission stays ungrouped; Horizon omission infers stored group.
Their editors preserve omitted grouping, reject explicit undefined and clear it
with false. "auto" remains a literal field name.
Temporal bindings accept temporalUnit: "auto" | "year" | "timestamp"; see
temporal inputs. The option changes
input interpretation without modifying raw rows or the existing mean Bar and
nominal numeric color defaults.
Calendar interval bar widths
After a temporal bar facade, use .encodeBarWidth({ interval: { unit: "year", insetStart: 1 } }) to fill each UTC calendar year with a one-pixel gap at its beginning. This contextual fragment requires an existing ungrouped aggregate bar, UTC interval-start category values, and an explicit temporal domain covering every interval end. It preserves leap-year and varying-month spans without modifying source data. unit accepts year, quarter, month, day, hour, minute or second; optional insetStart and insetEnd are non-negative logical pixels and default to zero. Insets follow calendar edge identity when the scale reverses. Interval, band and pixel modes are mutually exclusive. This mode rejects grouped, ranged, numeric-center and histogram bars, mixed interval/centered temporal Bar consumers, non-boundary category values and insets leaving no positive width.
Related
Position Encodings · Series Encodings · Appearance · Scale Options
Documentation provenance
293 actions · sha256:e755591a2e5f5e2b494867583876e28020a478c5220b77bdc6ad469a6224891d