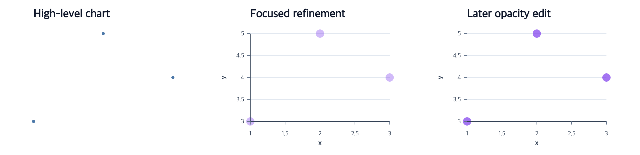
Choose the right authoring level
Choose the smallest action that expresses the intended chart change.
createScatterPlot
createPointMark
editPointMark
Published-release documentation · release compatibility
Tutorials build complete, runnable charts and explain what each action adds. Choose the visual relationship that matches the question you want to answer.
Choose the smallest action that expresses the intended chart change.
createScatterPlot
createPointMark
editPointMark
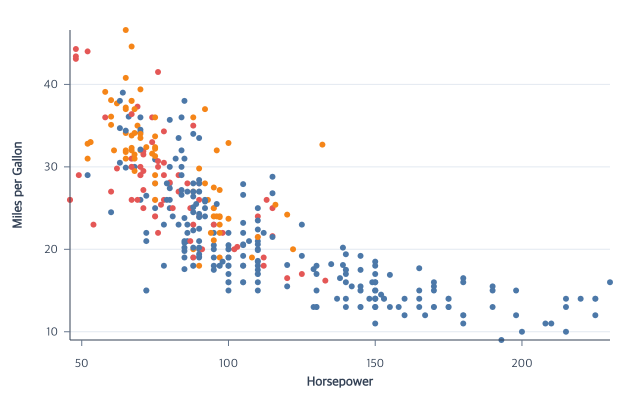
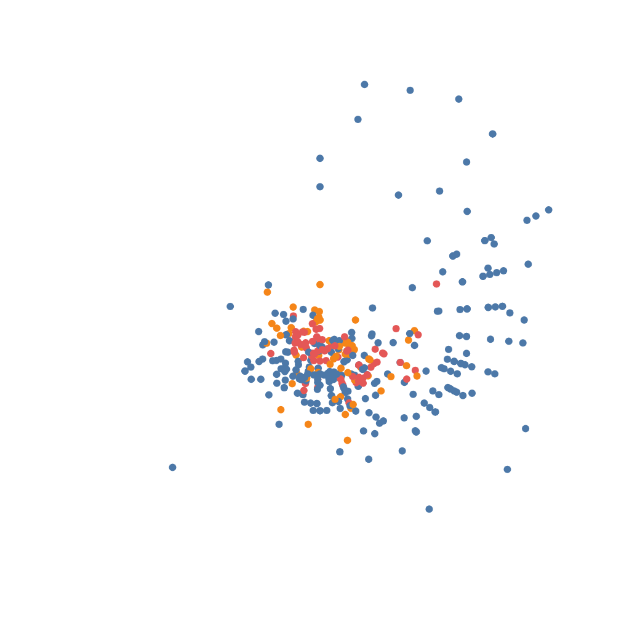
Map quantitative fields to clockwise angle and radial distance.
encodeTheta
encodeR
encodePointRadius
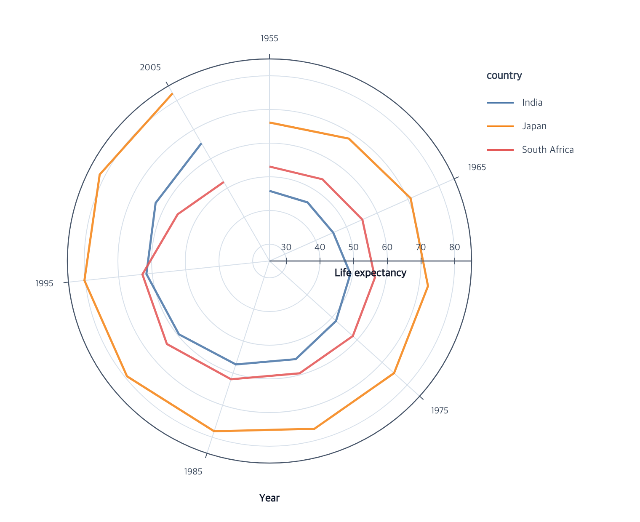
Connect ordered angle and radial values as grouped open paths.
createLineMark
encodeTheta
encodeR
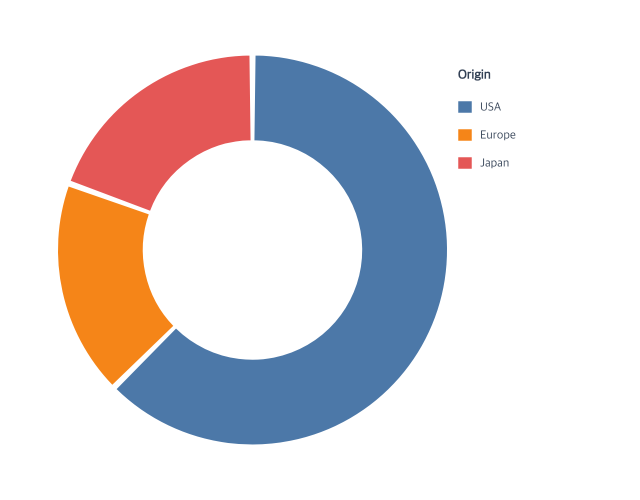
Build proportional sectors with an inferred categorical color legend.
createArcMark
encodeTheta
encodeColor
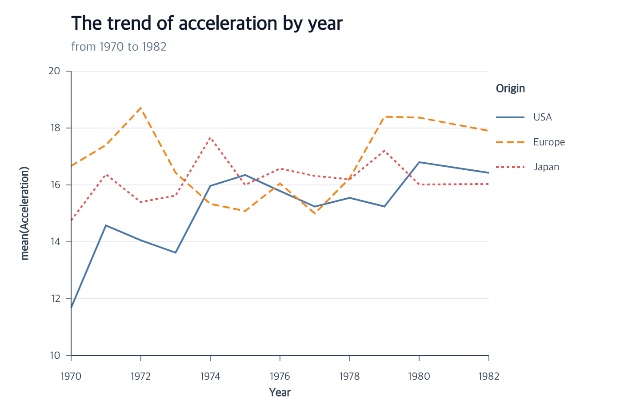
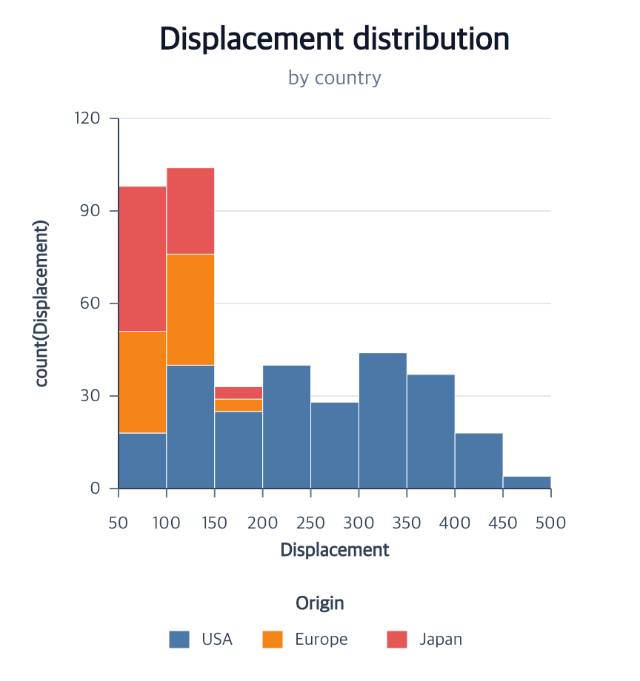
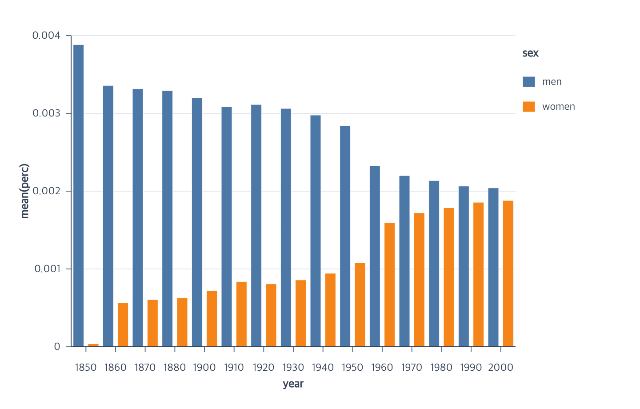
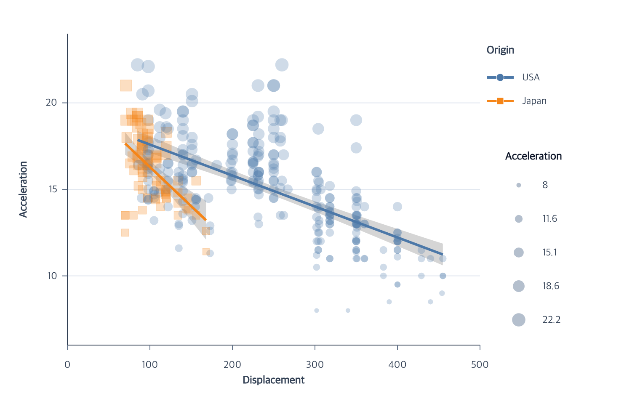
Layer observations, grouped fits, and confidence bands.
createPointMark
createRegression
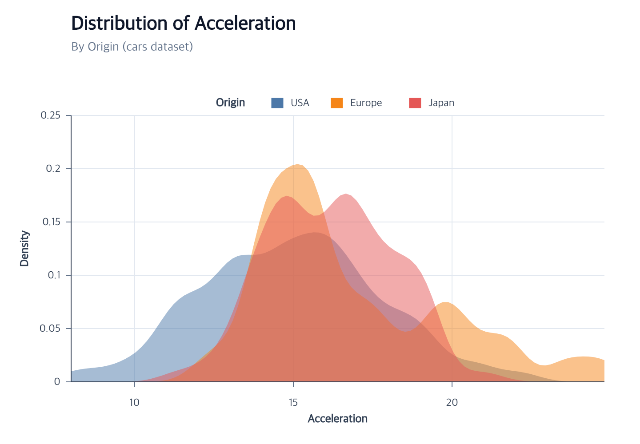
Estimate grouped distributions and draw baseline-closed areas.
createAreaMark
encodeDensity
encodeColor
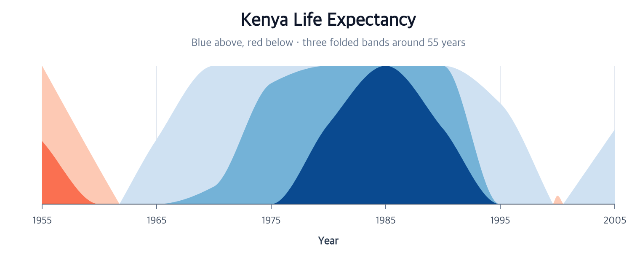
Compress a long time series by folding values above and below a baseline.
createAreaMark
encodeHorizon
editHorizon
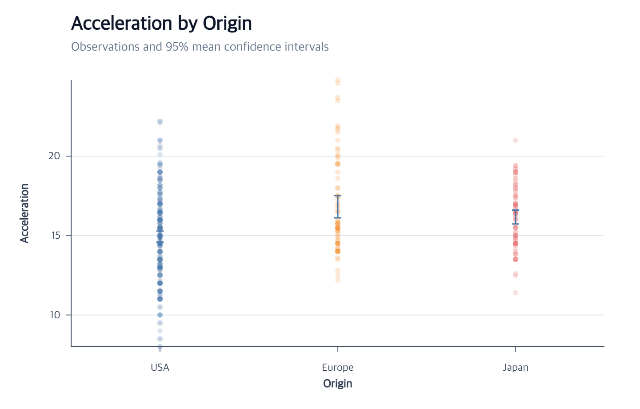
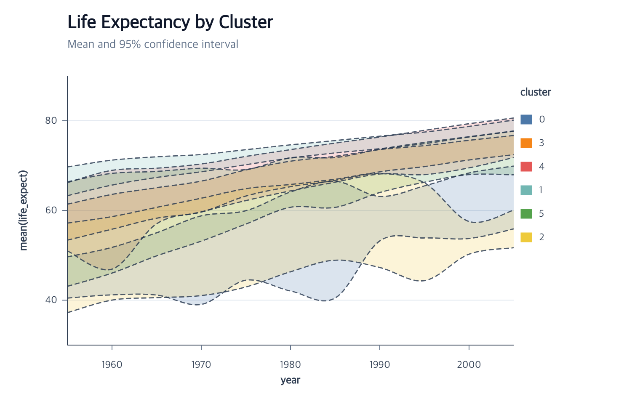
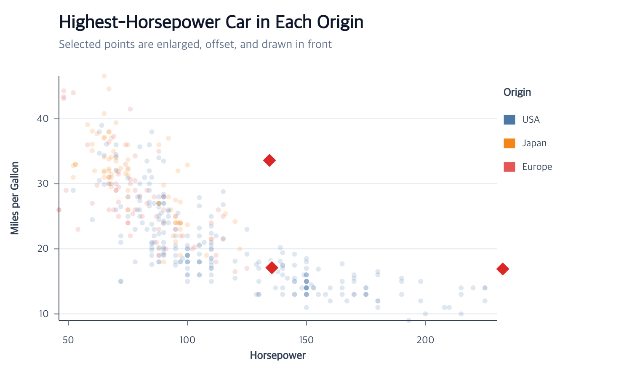
Select, filter, and emphasize final point, bar, and line items.
highlightMarks
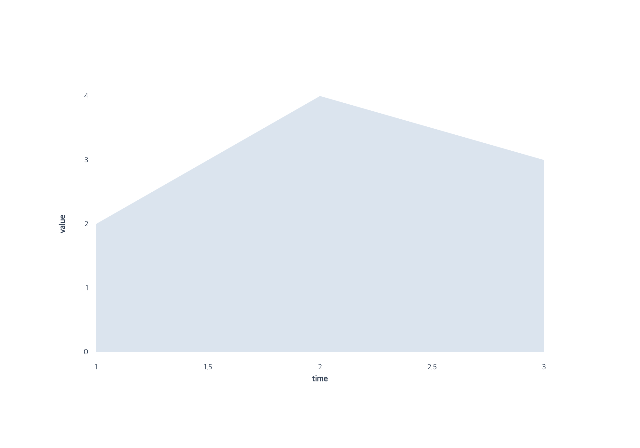
Define bounds and independently revise series identity, placement, and color.
createAreaPlot
layoutSeries
encodeGroup
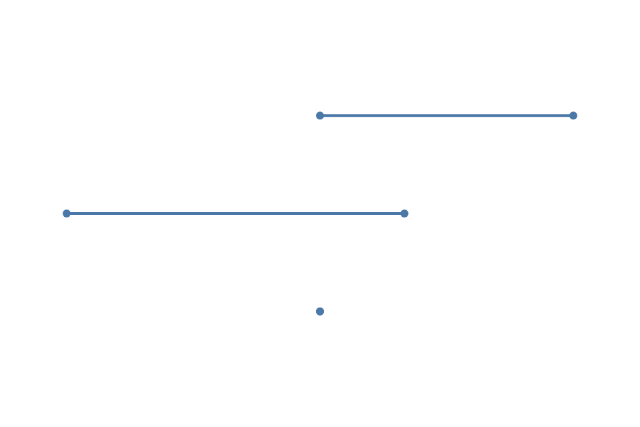
Named before and after endpoints retain their roles when values reverse.
createDumbbellPlot
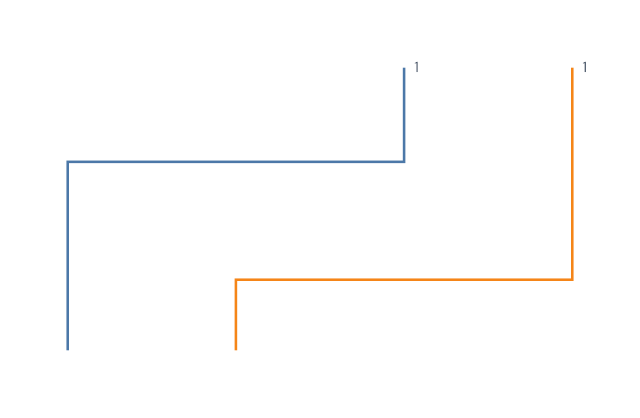
Step-after lines show cumulative probability at each observed support value.
createECDFPlot
The bar tutorial uses grouped bars as one layout of the general bar mark. The statistical tutorials compose ordinary data, marks, encodings, and guides rather than introducing a separate renderer path.
293 actions · sha256:e755591a2e5f5e2b494867583876e28020a478c5220b77bdc6ad469a6224891d