Published-release documentation · release compatibility
Density Area Recipe
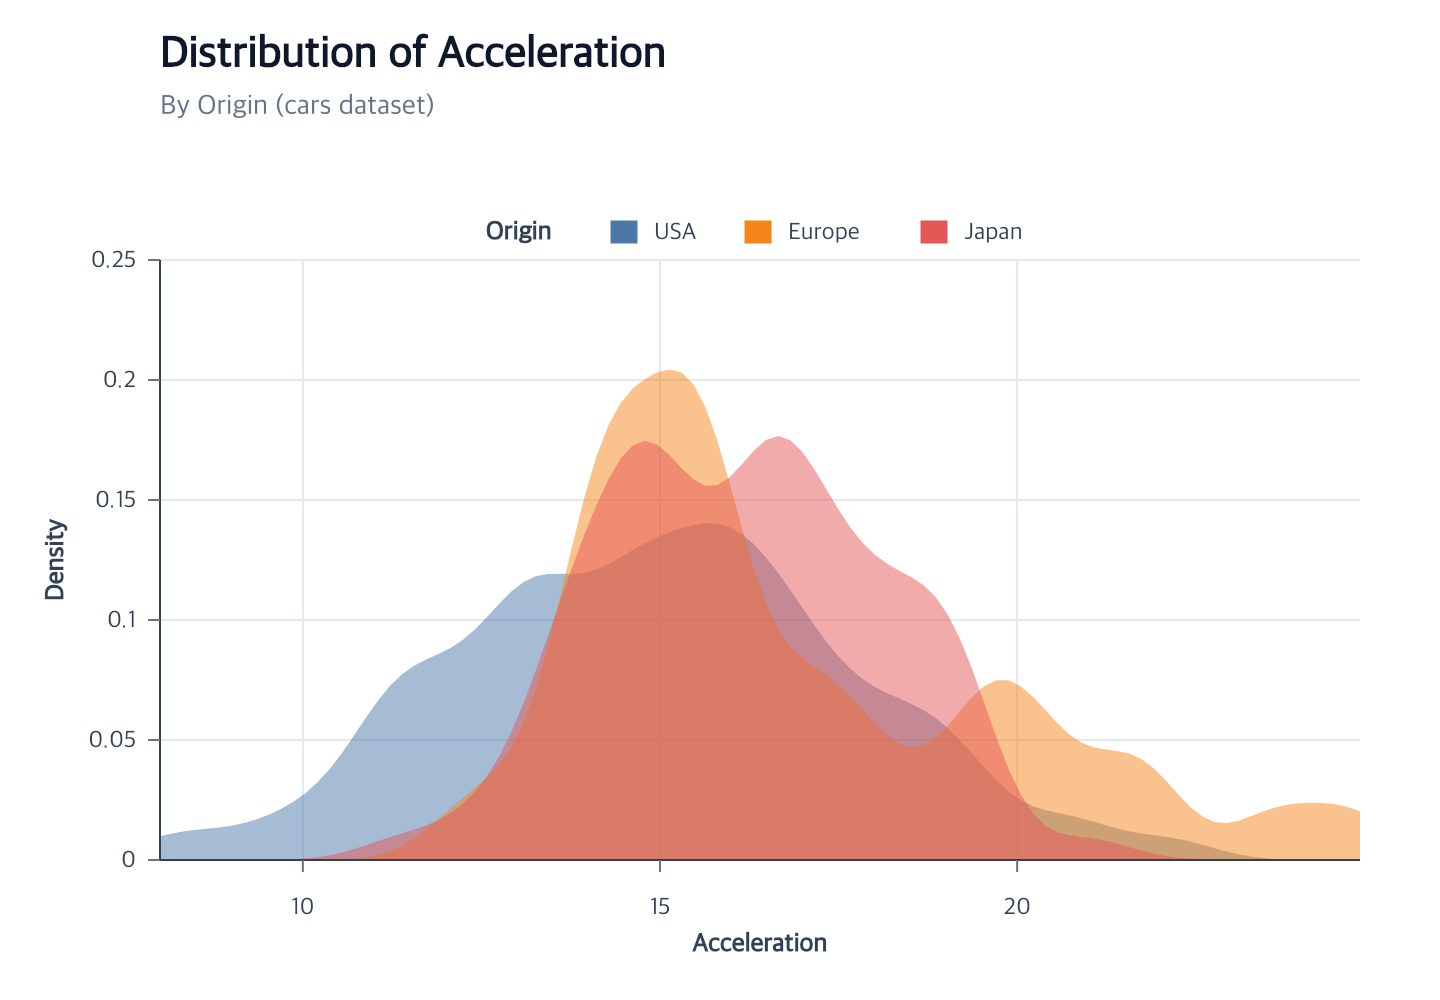
Minimal flow
Runnable: install ggaction and provide the named data array as plain row objects.
import { chart } from "ggaction";

const program = chart()
  .createCanvas({ margin: { top: 100, right: 140 } })
  .createData({ values })
  .createAreaMark()
  .encodeDensity({ field: "value", groupBy: "group" })
  .encodeColor({ field: "group" })
  .createGuides();
You must decide
- Quantitative source field
- Optional nominal
groupBy - Optional explicit bandwidth or sampling extent
- Optional kernel and unit/count normalization
- Whether density belongs on y (default) or x
The library infers
- Immutable derived dataset and deterministic output field names
- Gaussian/unit defaults, automatic bandwidth, and a shared 100-step sample grid
- Value and zero-inclusive density scales
- One baseline-closed command path per group
- Cartesian axes, horizontal grid, and a categorical legend when colored
Use createGuides({ grid: { horizontal: {}, vertical: {} } }) for both grid
directions. Legends still default to the right; pass explicit top layout
options only when that composition is intentional.
Continue
Density area tutorial · Encodings · Legends
Documentation provenance
293 actions · sha256:e755591a2e5f5e2b494867583876e28020a478c5220b77bdc6ad469a6224891d