Published-release documentation · release compatibility
Getting Started
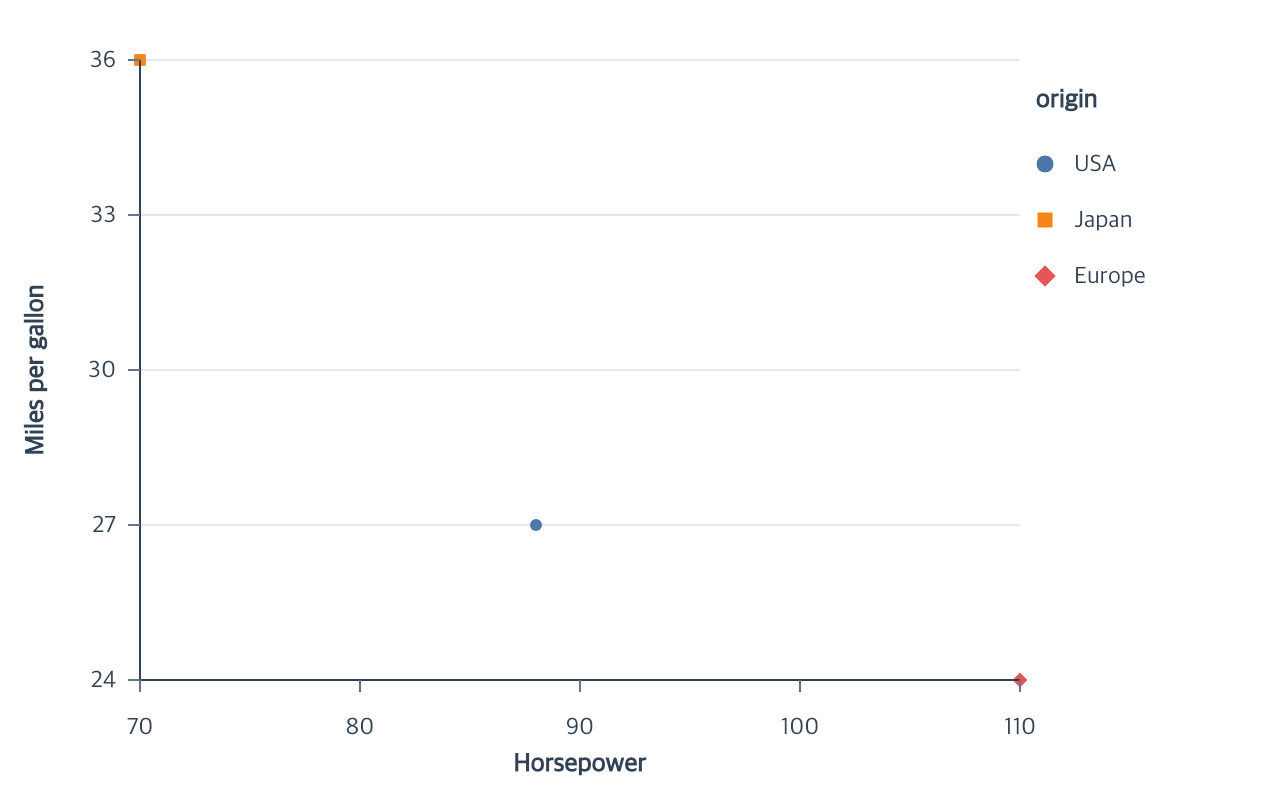
This walkthrough installs ggaction, creates a complete scatterplot from an
inline dataset, and renders it to Browser Canvas. Every action returns a new
immutable ChartProgram, so the calls can be chained.
1. Create a browser project
ggaction is an ESM package. This minimal setup uses Vite to resolve the npm
package for the browser:
mkdir ggaction-start
cd ggaction-start
npm init -y
npm install ggaction
npm install --save-dev vite
Node PNG/PDF output additionally requires npm install @napi-rs/canvas. The
optional MCP server requires npm install @modelcontextprotocol/sdk. Browser
Canvas and SVG need neither dependency.
The command installs the public ggaction package from the npm registry.
Create index.html:
<!doctype html>
<html lang="en">
  <head>
    <meta charset="UTF-8">
    <meta name="viewport" content="width=device-width, initial-scale=1.0">
    <title>ggaction scatterplot</title>
  </head>
  <body>
    <canvas id="chart" aria-label="Scatterplot of horsepower versus mileage by origin">
      Scatterplot of horsepower versus mileage by origin.
    </canvas>
    <script type="module" src="/main.js"></script>
  </body>
</html>
2. Build the program
Create main.js:
import { chart, render } from "ggaction/basic";

const cars = [
  { horsepower: 88, mpg: 27, origin: "USA" },
  { horsepower: 70, mpg: 36, origin: "Japan" },
  { horsepower: 110, mpg: 24, origin: "Europe" }
];

const program = chart()
  .createCanvas({
    width: 640,
    height: 400,
    margin: { top: 30, right: 130, bottom: 60, left: 70 }
  })
  .createData({ values: cars })
  .createScatterPlot({
    x: "horsepower",
    y: "mpg",
    color: "origin",
    shape: "origin",
    guides: {
      axes: {
        x: { title: { text: "Horsepower" } },
        y: { title: { text: "Miles per gallon" } }
      }
    }
  });

const canvas = document.querySelector("#chart");
render(program, canvas.getContext("2d"));
createScatterPlot uses the current dataset to create the point mark, x and y
positions, scales, and applicable guides. Matching nominal color and shape
encodings also create a composite legend and a redundant visual cue, so origin
is recognizable without color alone. The right margin reserves room for that
legend.
Pass data when more than one dataset could apply, or id when a later edit
must name this mark. To understand how these calls remain immutable and
inspectable, continue with
ChartProgram,
semantic and graphical state,
and action traces.
This walkthrough uses the creation-focused ggaction/basic entry. Import from
ggaction instead when the program needs editing, selection, composition,
Polar or Parallel coordinates, or statistical layers.
3. Run it
npx vite
Open the local URL printed by Vite. The browser draws the chart into the Canvas
created in index.html.
Package entries and compatibility
| Import | Environment | Use |
|---|---|---|
ggaction |
Modern ESM browsers and Node.js 20+ | Complete chart authoring and Browser Canvas rendering |
ggaction/basic |
Modern ESM browsers and Node.js 20+ | Smaller creation path for scatter, line, bar, histogram, and heatmap charts |
ggaction/extension |
Modern ESM browsers and Node.js 20+ | Wrapped action registration and public primitive authoring |
ggaction/inspection |
Modern ESM browsers and Node.js 20+ | Dataset schemas, action preflight, immutable diffs, and concrete-result inspection |
ggaction/persistence |
Modern ESM browsers and Node.js 20+ | Editable and render-only snapshot serialization |
ggaction/accessibility |
Modern ESM browsers and Node.js 20+ | Final visual-data export for host accessibility surfaces |
ggaction/diagnostics |
Modern ESM browsers and Node.js 20+ | Structured action error details |
ggaction/png |
Node.js 20+ only | PNG file output through the native Canvas adapter |
ggaction/pdf |
Node.js 20+ only | Single-page vector PDF file output |
ggaction/svg |
Modern ESM browsers and Node.js 20+ | Complete SVG document string output |
ggaction/scene |
Browser or Node.js 20+ | Read transition scenes and draw native Canvas scenes |
All entries include TypeScript declarations. The package does not publish
CommonJS entry points. Import ggaction/png and ggaction/pdf only from Node
code; the browser-safe entries, including ggaction/svg, do not load filesystem
or native output modules.
The installed package also provides the Node-only ggaction-mcp executable for
local, read-only language-model authoring support. It is not imported by any
browser entry. See Local MCP for LLM Chart Authoring for setup and
the one-tool workflow.
The release artifact is tested by installing its exact tarball into fresh JavaScript and TypeScript consumer projects. It is also tested in a browser and across the supported Node release matrix.
Runnable repository examples
Use the
generated repository example index
for complete runnable modules. Browse the
chart gallery for visual examples,
or use
the Quarto and Observable JS example
when authoring an .qmd document.
Next
Learn how the same chart stays editable across authoring levels, then choose from every complete chart family.
Use Troubleshooting when inference or layout cannot make one safe choice. Render the same program to a file with PNG or vector PDF output.
Documentation provenance
293 actions · sha256:e755591a2e5f5e2b494867583876e28020a478c5220b77bdc6ad469a6224891d