Published-release documentation · 281 actions; release compatibility · contract 5520b0fa9525
Repair missing observations
Restore an omitted time key, impute its measure, and recompute a trailing window when new source observations arrive.
Prerequisites
Use the Getting Started browser module setup, install the full
ggaction entry, and provide <canvas id="chart"></canvas>. This complete example
includes its data and imports. These APIs require ggaction 0.0.15 or later;
check the documentation version for release compatibility.
Decision sequence: line chart → data transform actions → mark rebind.
Complete program
import { chart, hconcat } from "ggaction";
import { render } from "ggaction";

export function createMissingObservationsWorkflow() {
  const rows = [{ t: 1, value: 2 }, { t: 3, value: 6 }];
  function derive(program, source, suffix) {
    return program
      .createCompleteData({ id: `complete${suffix}`, source, key: "t", values: [1, 2, 3] })
      .createImputedData({ id: `imputed${suffix}`, source: `complete${suffix}`,
        fields: "value", sortBy: [{ field: "t" }], method: "linear" })
      .createWindowData({ id: `window${suffix}`, source: `imputed${suffix}`,
        sortBy: [{ field: "t" }], operations: [
          { op: "movingMean", field: "value", as: "mean", frame: { preceding: 1 } }
        ] });
  }
  const before = derive(chart()
    .createCanvas({ width: 420, height: 300, margin: 65 })
    .createData({ id: "raw", values: rows }), "raw", "Before")
    .createLinePlot({ id: "trend", data: "windowBefore", x: "t", y: "mean" });
  const after = derive(before.createData({ id: "replacement", values: [
    { t: 1, value: 4 }, { t: 3, value: 8 }
  ] }), "replacement", "After")
    .bindMarkData({ target: "trend", data: "windowAfter" });
  return hconcat({ programs: [
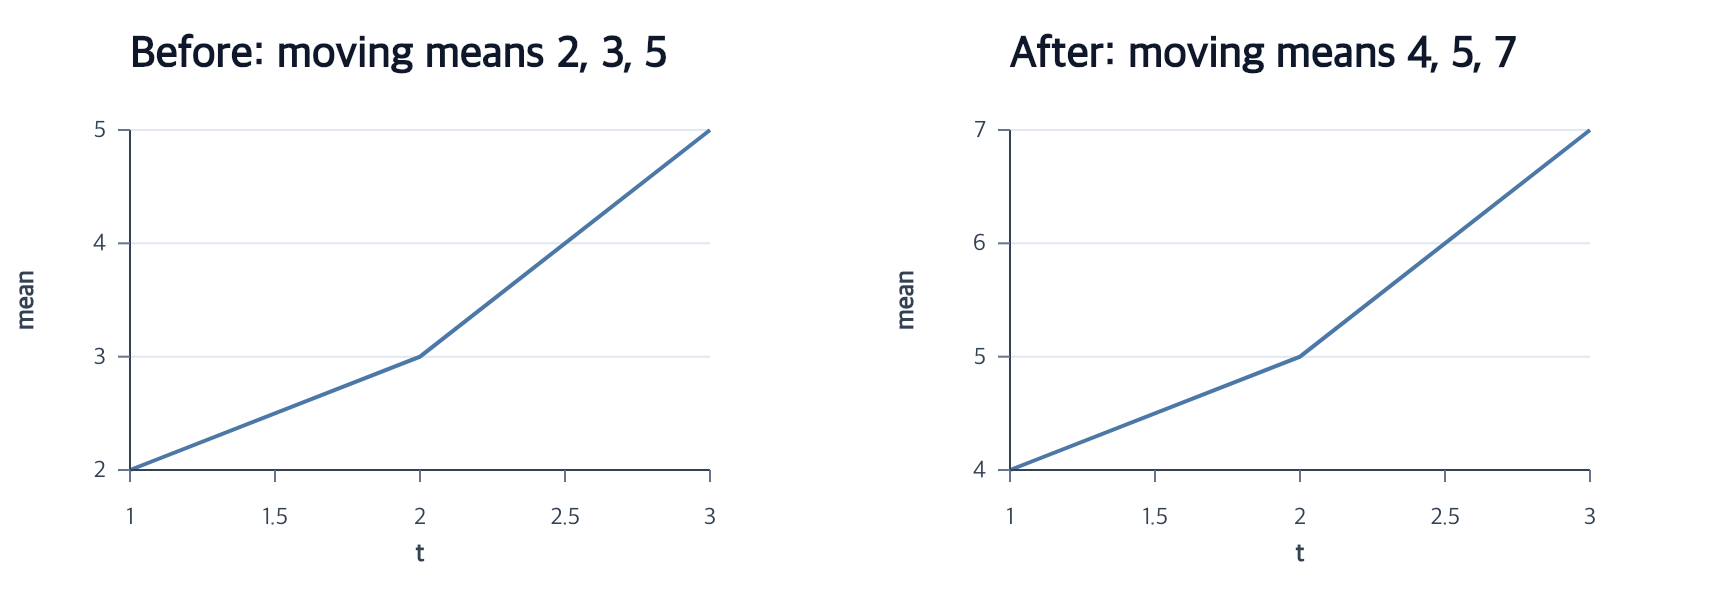
    before.createTitle({ text: "Before: moving means 2, 3, 5" }),
    after.createTitle({ text: "After: moving means 4, 5, 7" })
  ], gap: 20 });
}

const program = createMissingObservationsWorkflow();
render(program, document.querySelector("#chart").getContext("2d"));
Expected result
The source has two rows: (t=1,value=2) and (t=3,value=6). Complete produces three rows with a null at t=2; linear imputation produces [2,4,6]; a preceding-one-row mean produces [2,3,5]. Replacement values [4,8] produce [4,6,8], then [4,5,7]. The first program and its original rows stay unchanged.
Boundaries and failure behavior
Completion adds keys; imputation fills cells and does not add rows. Each observed group/key must be unique. Linear imputation uses position distance, not index distance. Source rows are immutable: there is no general edit-source-data action. Create the replacement, rebuild its derivation, then bind an eligible independent mark. To change a transform decision on the same source, use its focused editor with dependents: "recompute".
Related
Authoring conventions · Data policies · Complete action reference