Published-release documentation · release compatibility
Horizon Chart Recipe
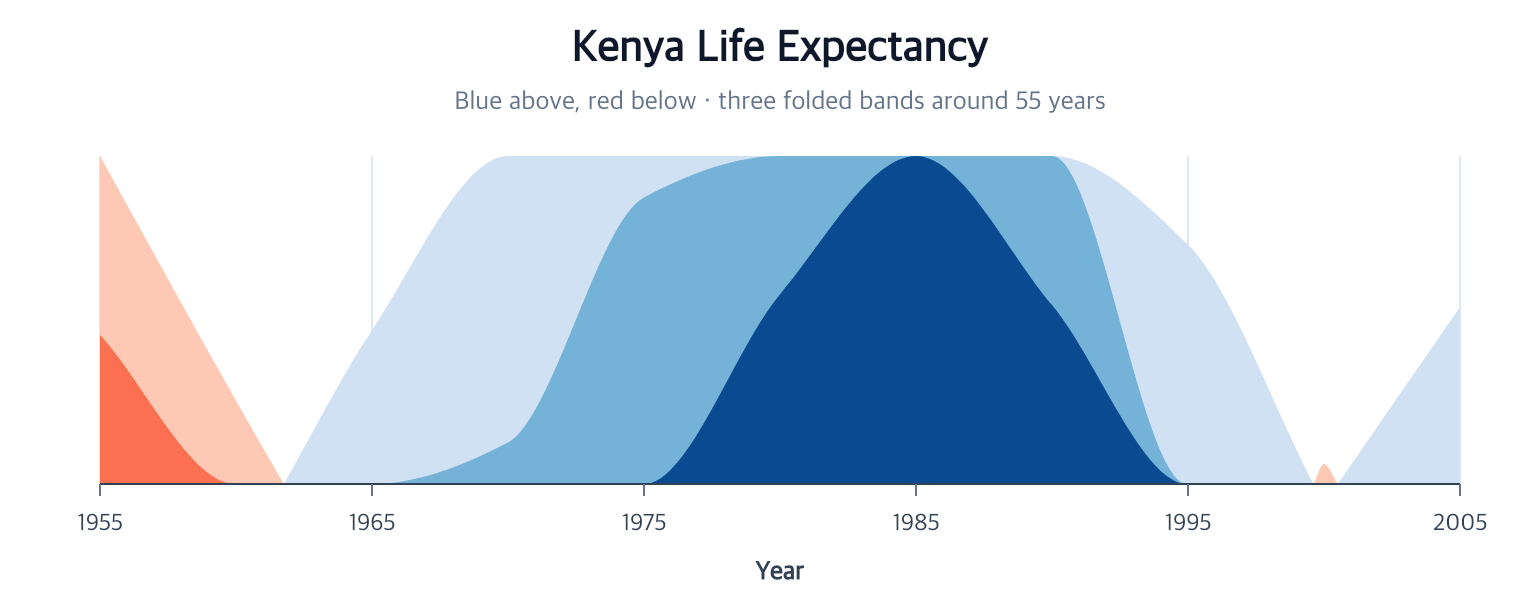
Minimal flow
Runnable: install ggaction and provide the named data array as plain row objects.
import { chart } from "ggaction";

const program = chart()
  .createCanvas({ margin: { top: 60, right: 60, bottom: 90, left: 60 } })
  .createData({ values })
  .createAreaMark({ curve: "monotone" })
  .encodeHorizon({ x: "time", y: "value" })
  .createGuides();
You must decide
values contains finite numeric value and ordered numeric or ISO-date
time values, with one observation per time. For example, use monthly dates
such as "2024-01-01". The bottom margin accommodates their automatic labels.
- The ordered quantitative or temporal x field
- The quantitative y field
- A baseline when zero is not meaningful
The library infers
- The current area target and source dataset when unambiguous
- Three bands, shared automatic extent, and blue/red palettes
- Immutable namespaced output data and ordinary closed path graphics
- An x axis and x grid, without a misleading folded y axis or band legend
Use editHorizon({ bands, baseline, extent, palette }) to create a revised
immutable result. Use resolve: "independent" only when group-local amplitude
comparison is intentional.
Continue
Horizon tutorial · Encodings · Area marks
Documentation provenance
293 actions · sha256:e755591a2e5f5e2b494867583876e28020a478c5220b77bdc6ad469a6224891d