Published-release documentation · release compatibility
Error Bar Recipe
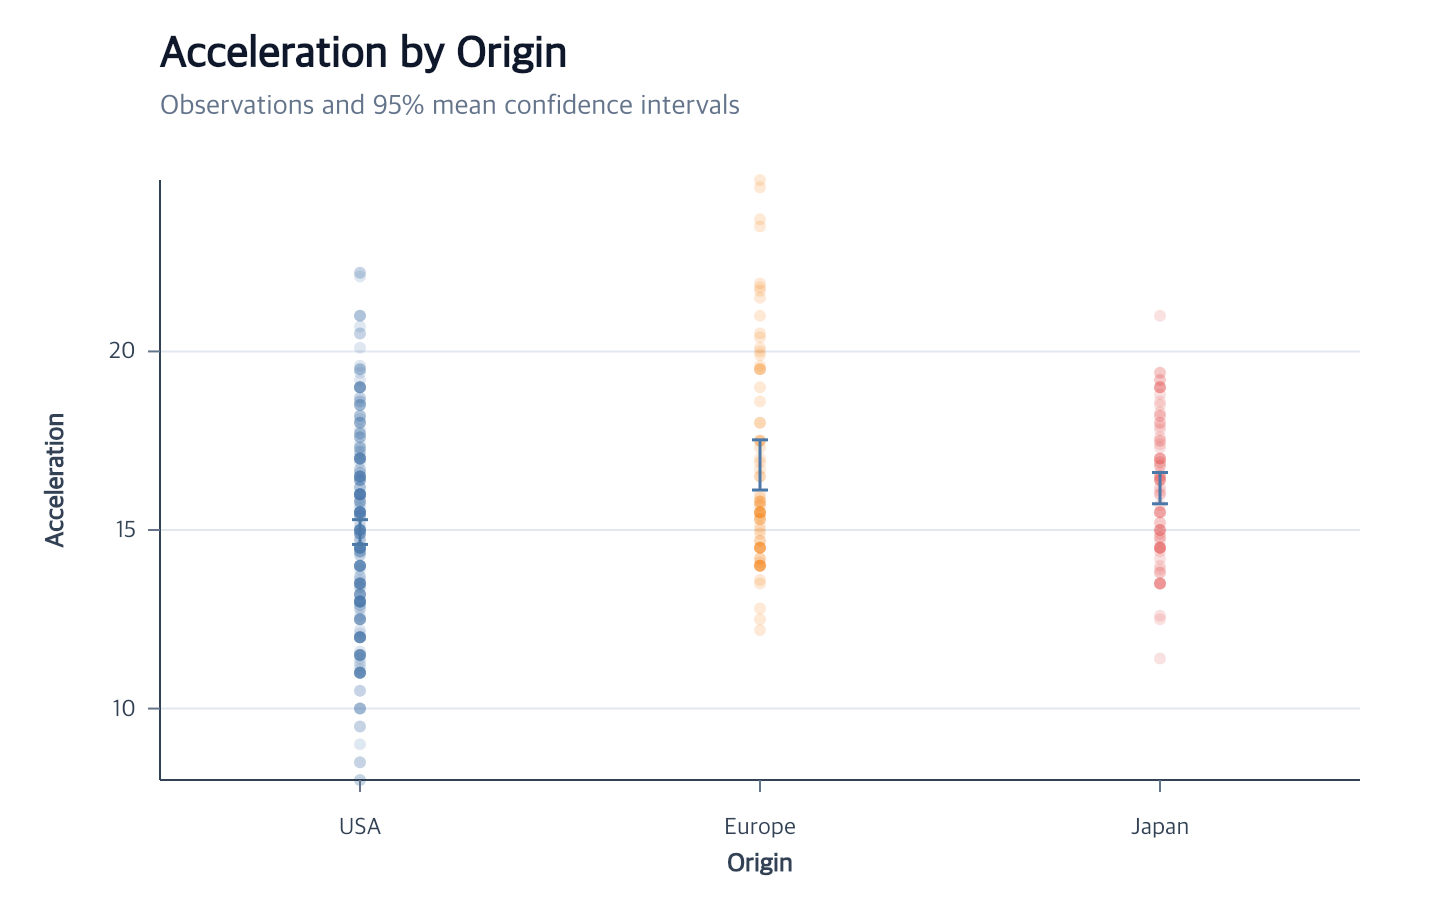
Minimal flow
Runnable: install ggaction and provide the named data array as plain row objects.
import { chart } from "ggaction";

const program = chart()
  .createCanvas()
  .createData({ values })
  .createErrorBar({
    x: { field: "group", fieldType: "nominal" },
    y: { field: "value" }
  })
  .createGuides();
You must decide
- Independent nominal, ordinal, or temporal x field
- Quantitative y field
The library infers
- Current dataset and Cartesian coordinate
- Mean with a two-sided 95% Student-t confidence interval
- One immutable summary row per first-appearance group
- Vertical main rules, 8px caps, ordinal/temporal x, and quantitative y
- Axes, horizontal grid, and statistical axis title
When one compatible layer is already encoded, call createErrorBar() without
options to reuse its fields, data, coordinate, and scales.
Continue
Error-bar tutorial · Error-bar API
Documentation provenance
293 actions · sha256:e755591a2e5f5e2b494867583876e28020a478c5220b77bdc6ad469a6224891d