Published-release documentation · release compatibility
Advanced Axis Components
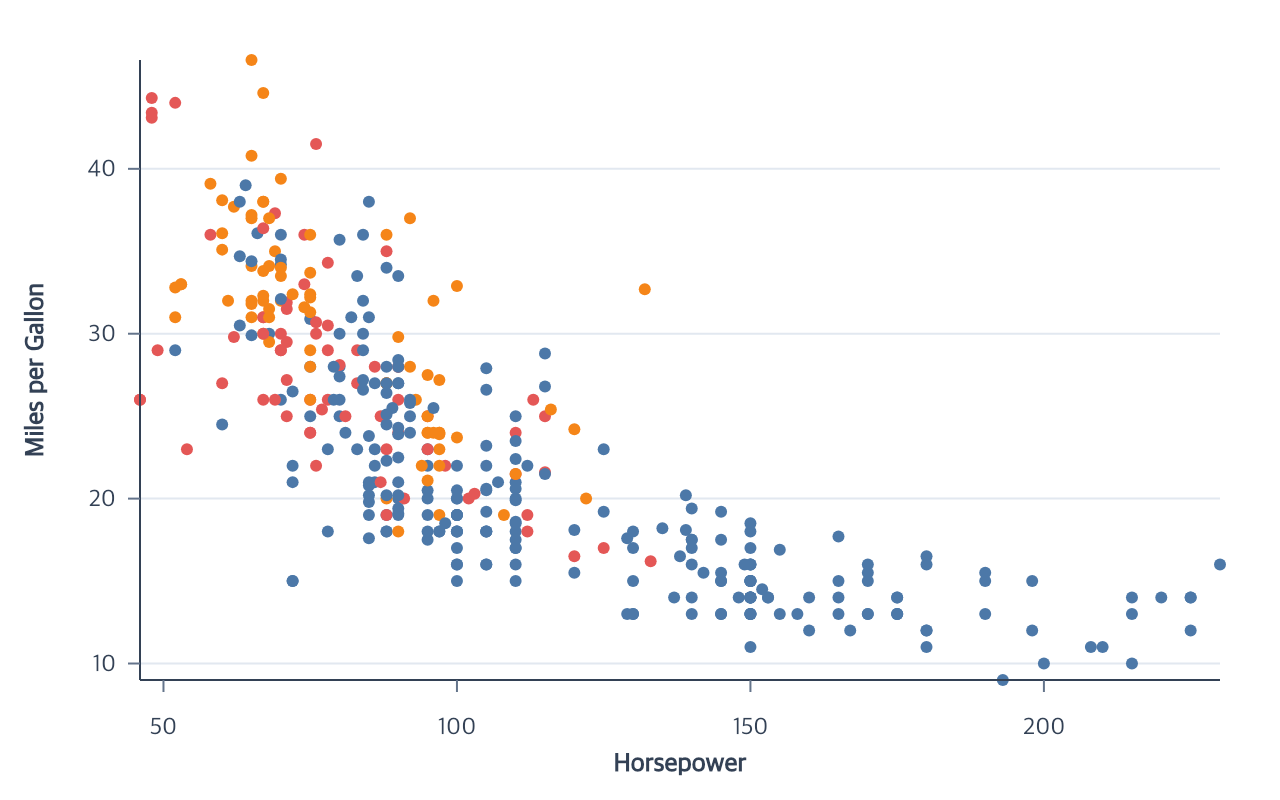
Use these actions when a complete createAxes call is not sufficient. All
component actions require a resolved compatible quantitative, time, band, or point scale and Canvas
bounds. x supports bottom and top; y supports left and right.
Complete single-channel axes
Contextual fragment. Use an ES module with the imports, data, and prepared resource state described in this section. Caller-provided receivers:
program. Resolve these names from setup in this fragment or section; alternatives branch from the same base.
program.createXAxis({
  scale: "x",
  line: { lineWidth: 1 },
  ticksAndLabels: {
    count: 5,
    ticks: { length: 6 },
    labels: { fontSize: 12 }
  },
  title: { text: "Horsepower" }
});
Complete Cartesian and Polar creators call the enabled component actions as
trace children. Use line: false, ticksAndLabels: false, or title: false
to omit components; at least one must remain enabled. The complete editors
update existing components atomically and accept false for line, ticks,
labels, ticksAndLabels, or title to remove them. Restore missing components
with their focused create actions. See the
shared optional component rules.
| Axis family | Create | Edit | Editable components |
|---|---|---|---|
| Cartesian complete axis | createXAxis / createYAxis / createAxes |
editXAxis / editYAxis |
line, ticks, labels, ticksAndLabels, title, position |
| Polar complete axis | createThetaAxis / createRadialAxis / createAxes |
editThetaAxis / editRadialAxis |
line, ticks, labels, ticksAndLabels, title, radial angle and radial title position |
| Parallel dimension axes | createAxes / createParallelAxes / createParallelAxis |
editParallelAxis / removeParallelAxis / removeParallelAxes |
line, ticks, labels, title from each stored dimension |
Create also accepts coordinate, an existing coordinate ID consumed by the
selected channel and scale. createAxes supplies this automatically and stores
it on the semantic guide.
Lines
Contextual fragment. Use an ES module with the imports, data, and prepared resource state described in this section. Caller-provided receivers:
program. Resolve these names from setup in this fragment or section; alternatives branch from the same base.
program.createXAxisLine({
  scale: "x",
  position: "bottom",
  color: "#334155",
  lineWidth: 1
});

program.editXAxisLine({ color: "black", lineWidth: 2 });
Create options are scale, position, color, and lineWidth. Edit options
omit scale. Endpoints are inferred from the resolved scale range and Canvas
bounds; concrete endpoints are not accepted.
Ticks
Contextual fragment. Use an ES module with the imports, data, and prepared resource state described in this section. Caller-provided receivers:
program. Resolve these names from setup in this fragment or section; alternatives branch from the same base.
program.createXAxisTicks({ count: 5, length: 6 });
program.createYAxisTicks({ values: [10, 20, 30, 40] });
program.editXAxisTicks({ length: 8, color: "black" });
| Option | Meaning |
|---|---|
scale |
Create-only scale ID; defaults to channel |
position |
x: bottom/top; y: left/right |
count |
Positive requested tick density; default 5 except inferred binned x boundaries |
values |
Exact finite data-space values or timestamps; mutually exclusive with count |
length |
Non-negative tick length; default 6 |
color |
Stroke color; default #64748b |
lineWidth |
Non-negative width; default 1 |
When both count and values are omitted for a binned histogram x scale,
ticks default to the inferred bin boundaries. Passing either option disables
that inference.
Labels
Contextual fragment. Use an ES module with the imports, data, and prepared resource state described in this section. Caller-provided receivers:
program. Resolve these names from setup in this fragment or section; alternatives branch from the same base.
program.createXAxisLabels({ format: { decimals: 1 } });
program.editYAxisLabels({ offset: 16, fontSize: 13 });
Labels accept scale on creation plus position, count, values, offset,
format, color, fontSize, fontFamily, fontWeight, rotation, maxWidth,
wrap, lineHeight, overlap, and labelMap. Format is
"auto", { decimals: nonNegativeInteger }, a closed numeric string, or a
validated time directive sequence. Default offsets are 18 for x and 12 for y;
default font size is 12.
| Scale | Explicit format strings |
|---|---|
| Quantitative (linear/log/sqrt/pow/symlog) | .0f–.12f, .0%–.12%, .0e–.12e |
| Time | UTC %Y, %m, %d, %b directives plus literals; %% is a literal percent |
| Discrete band/point | use "auto"; labelMap changes display text without changing category identity |
Automatic time labels select year, month, day, hour, minute, or second
precision from the resolved domain span, then minimally refine that precision
when distinct tick values would collide. This handles UTC month lengths, leap
days, and sub-day intervals without changing explicit format strings.
Composite formats such as %b %Y, %Y-%m, and %Y/%m/%d are accepted when
every directive is supported. Unknown or dangling directives and incompatible
format/scale pairs are rejected before graphics are changed.
Labels reuse existing tick values when count/values are omitted. Conflicting tick and label configurations produce an error.
Ticks and labels together
Contextual fragment. Use an ES module with the imports, data, and prepared resource state described in this section. Caller-provided receivers:
program. Resolve these names from setup in this fragment or section; alternatives branch from the same base.
program.createXAxisTicksAndLabels({
  count: 5,
  ticks: { length: 6 },
  labels: { offset: 18, fontSize: 12 }
});

program.editYAxisTicksAndLabels({
  values: [10, 20, 30, 40],
  labels: { color: "black" }
});
Shared options are scale (create only), position, and either count or
values. Nested ticks accepts length, color, and lineWidth; nested
labels accepts the same text style, format, rotation, wrapping, overlap, and
label-map options as standalone Cartesian labels. Its count/values belong to
the shared ticks-and-labels request. See axis label layout.
Titles
A summary of row counts without an input field infers the title count.
Other summaries retain their operation and source field, such as mean(value).
An explicit title always takes precedence.
ECDF guides use the original measure name and Cumulative probability instead
of generated output field names; cumulative-count outputs use Cumulative count.
Contextual fragment. Use an ES module with the imports, data, and prepared resource state described in this section. Caller-provided receivers:
program. Resolve these names from setup in this fragment or section; alternatives branch from the same base.
program.createXAxisTitle({ text: "Horsepower" });
program.editXAxisTitle({ text: "Engine horsepower", at: "start" });
| Option | Meaning |
|---|---|
text |
Non-empty title; inferred from one connected field/aggregate when omitted |
scale |
Create-only scale ID; defaults to channel |
position |
x: bottom/top; y: left/right |
at |
start, center, end, or an in-domain finite number |
offset |
Non-negative distance from the plot |
rotation |
Finite radians, or { value, unit: "degrees" | "radians" } |
color |
Text fill |
fontSize |
Positive size |
fontFamily |
Non-empty family |
fontWeight |
String or finite number |
Default title placement is centered. x uses offset 42 and rotation 0. y uses
offset 52 with rotation -Math.PI / 2 on the left or Math.PI / 2 on the
right. When labels require a tight Canvas margin, an inferred rotated y title larger than the default title size reserves a
quarter of the title font size beyond its estimated text box for font ink.
Explicit offsets keep their exact placement. An explicit rotation remains unchanged when the position is edited.
The legacy numeric form remains radians. For a unit-visible call, use for
example rotation: { value: -90, unit: "degrees" }; the stored concrete title
rotation is normalized to radians. Radial-axis angle remains a separate
degree-valued placement option rather than a text rotation.
Cartesian and Polar axis typography follows the shared Canvas font-weight policy.
Top/right components extend outward and require sufficient top/right Canvas margin. Component edits and Canvas/scale rematerialization preserve the chosen edge, values, formats, and appearance.
Scale or Canvas rematerialization recomputes existing component geometry while preserving configured appearance.
Statistical axis titles retain their source meaning after row-preserving filters, including filtered box categories.
Documentation provenance
293 actions · sha256:e755591a2e5f5e2b494867583876e28020a478c5220b77bdc6ad469a6224891d