Recipe
Program composition
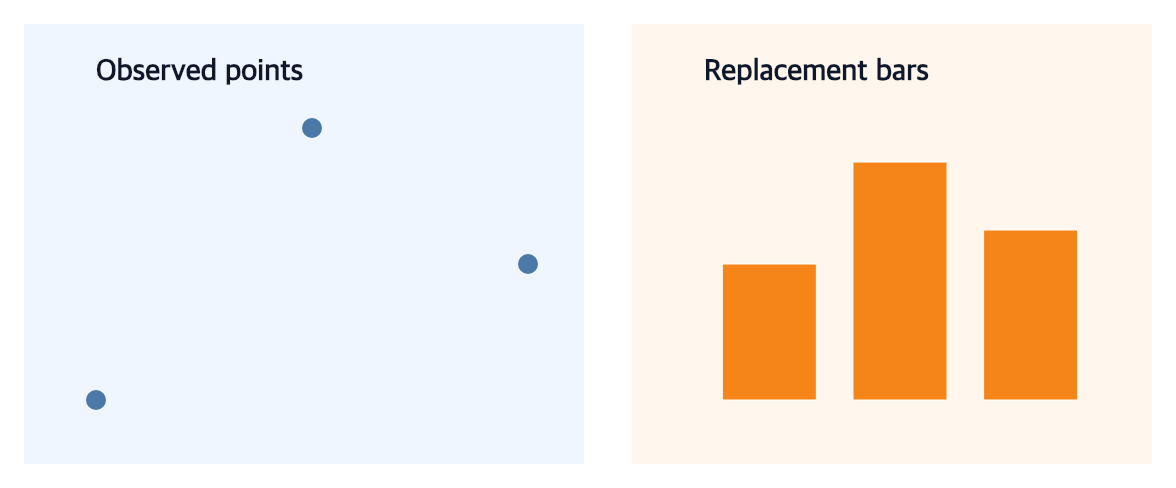
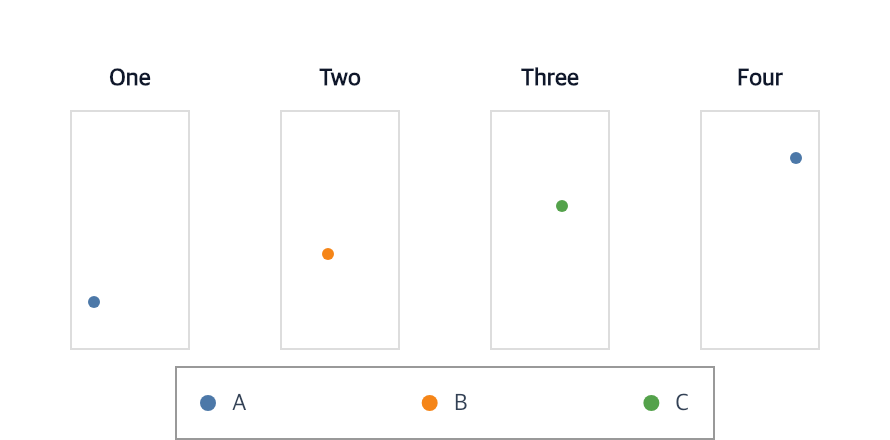
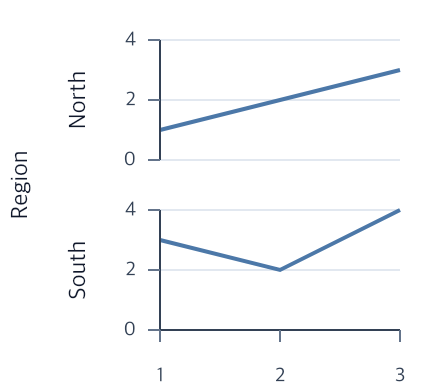
Compare distinct child panels, edit their layout, and replace one stable slot.
hconcat
editCompositionLayout
replaceCompositionChild
View full size
Published-release documentation · release compatibility
This catalog includes every maintained public chart example. Start with the curated gallery when you want a shorter representative set.
Compare distinct child panels, edit their layout, and replace one stable slot.
hconcat
editCompositionLayout
replaceCompositionChild
View full size
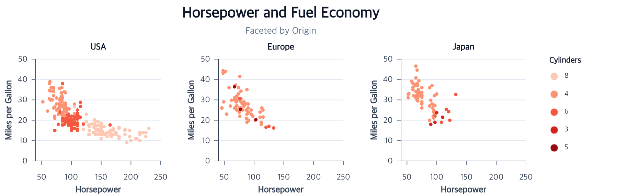
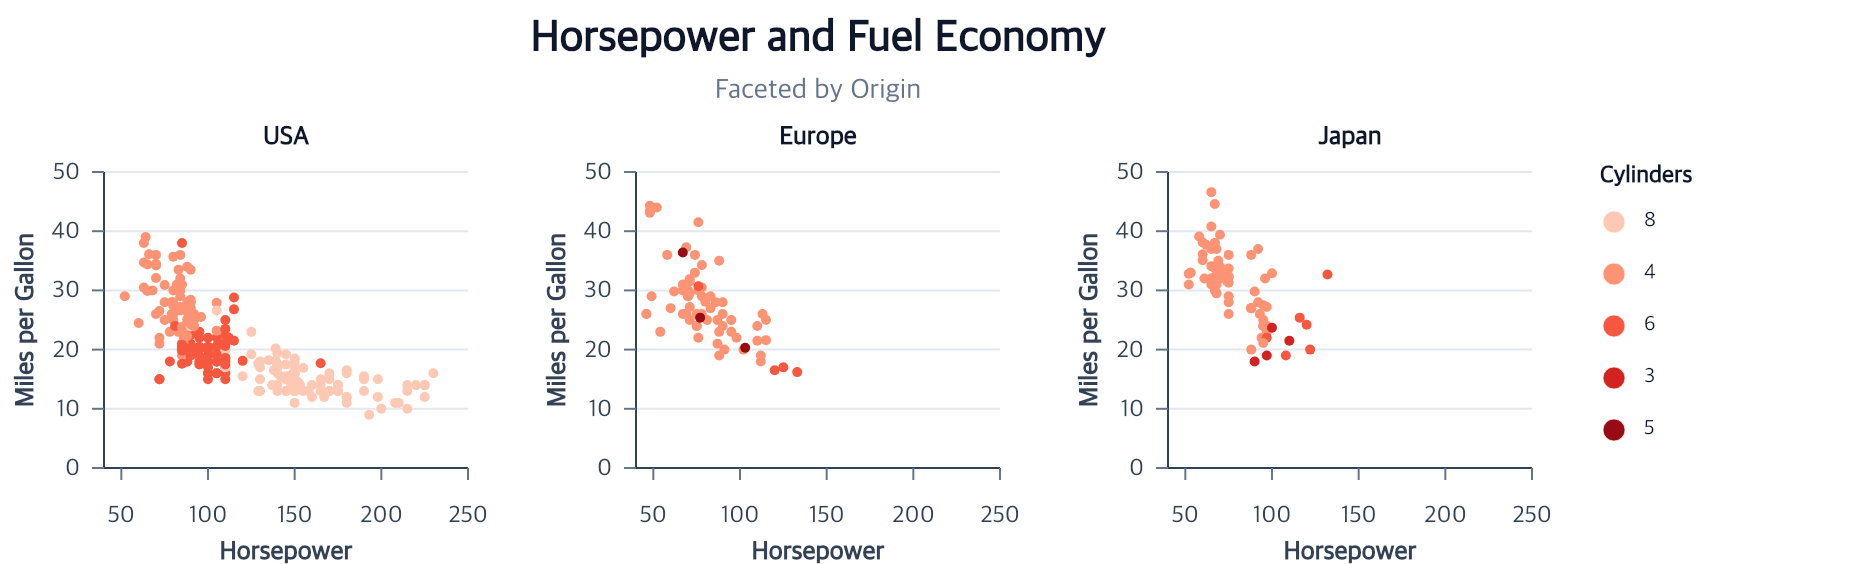
Repeat a complete point or bar chart by field value.
facet
editFacetHeaders
editCompositionLayout
View full size
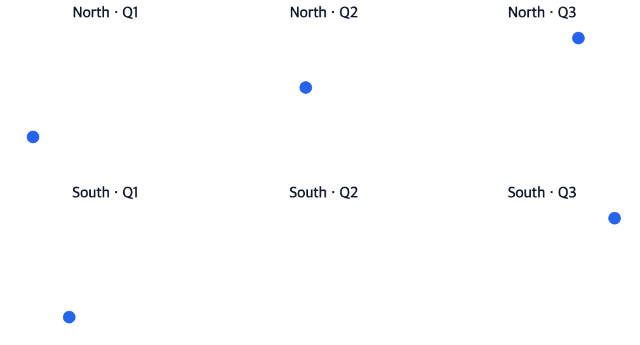
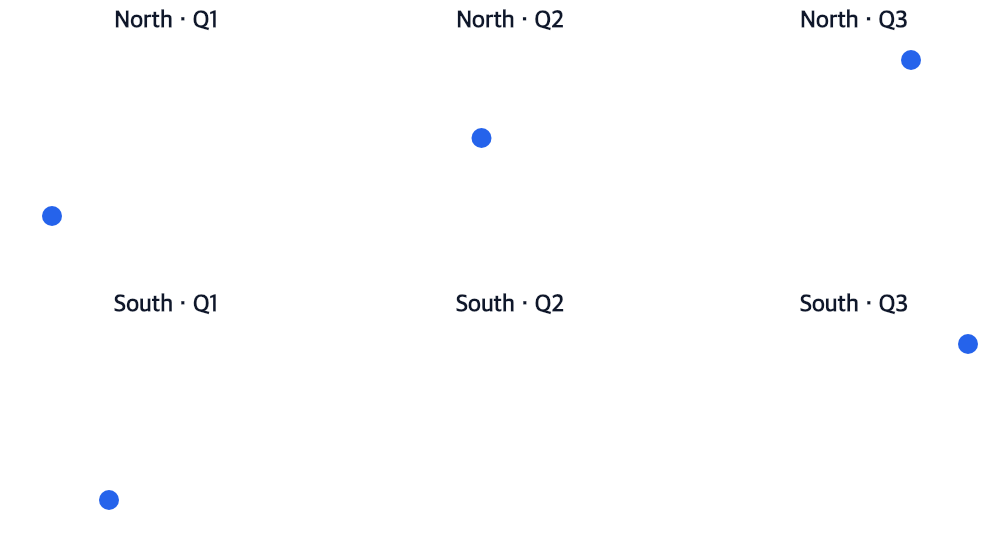
Cross two fields into an observed or complete grid with stable cell coordinates.
facetGrid
editFacetSource
editCompositionLayout
View full size
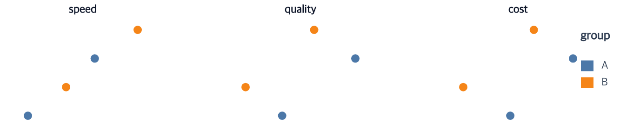
Repeat one positional encoding across fields with explicit scale and guide policies.
repeatCharts
editFacetSource
editCompositionLayout
View full size
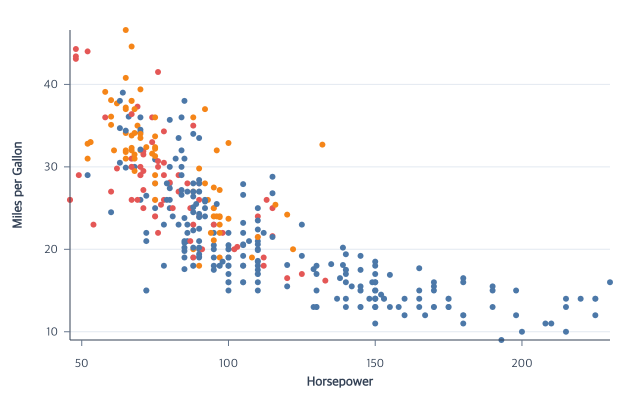
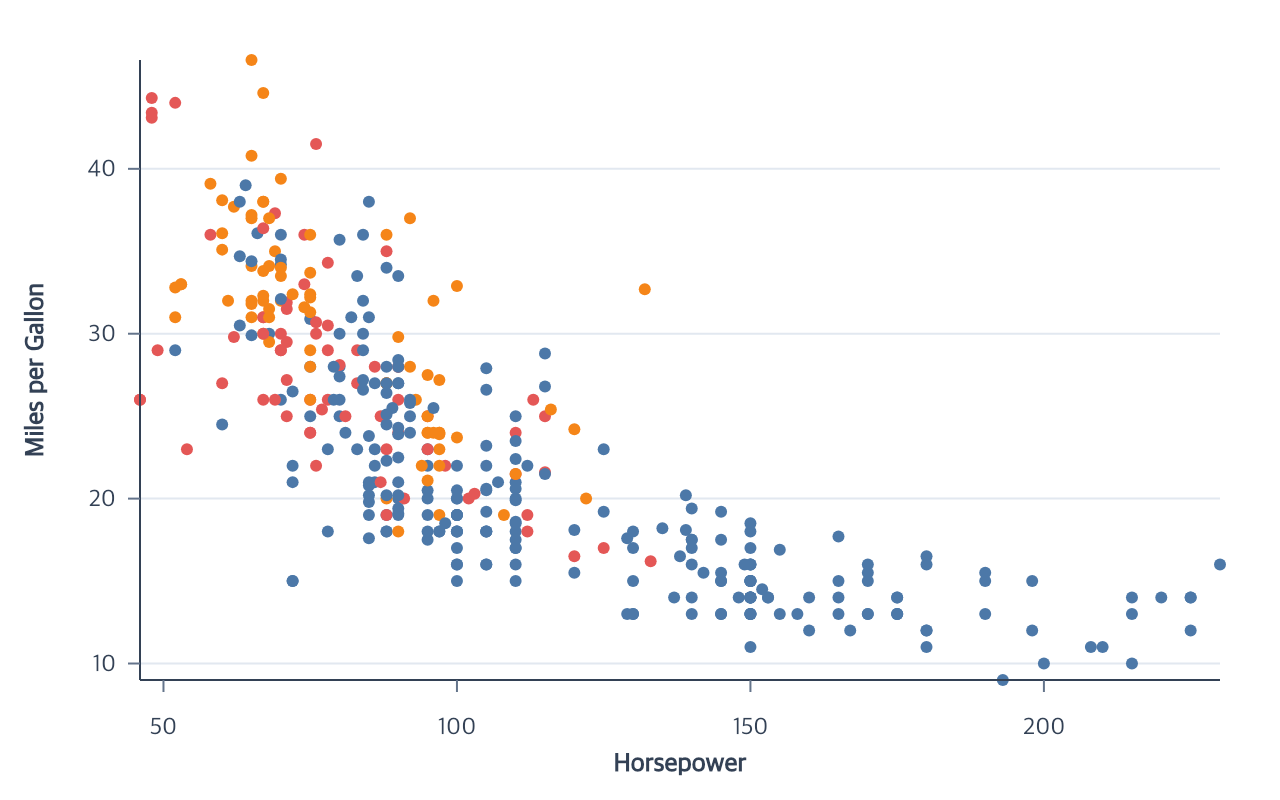
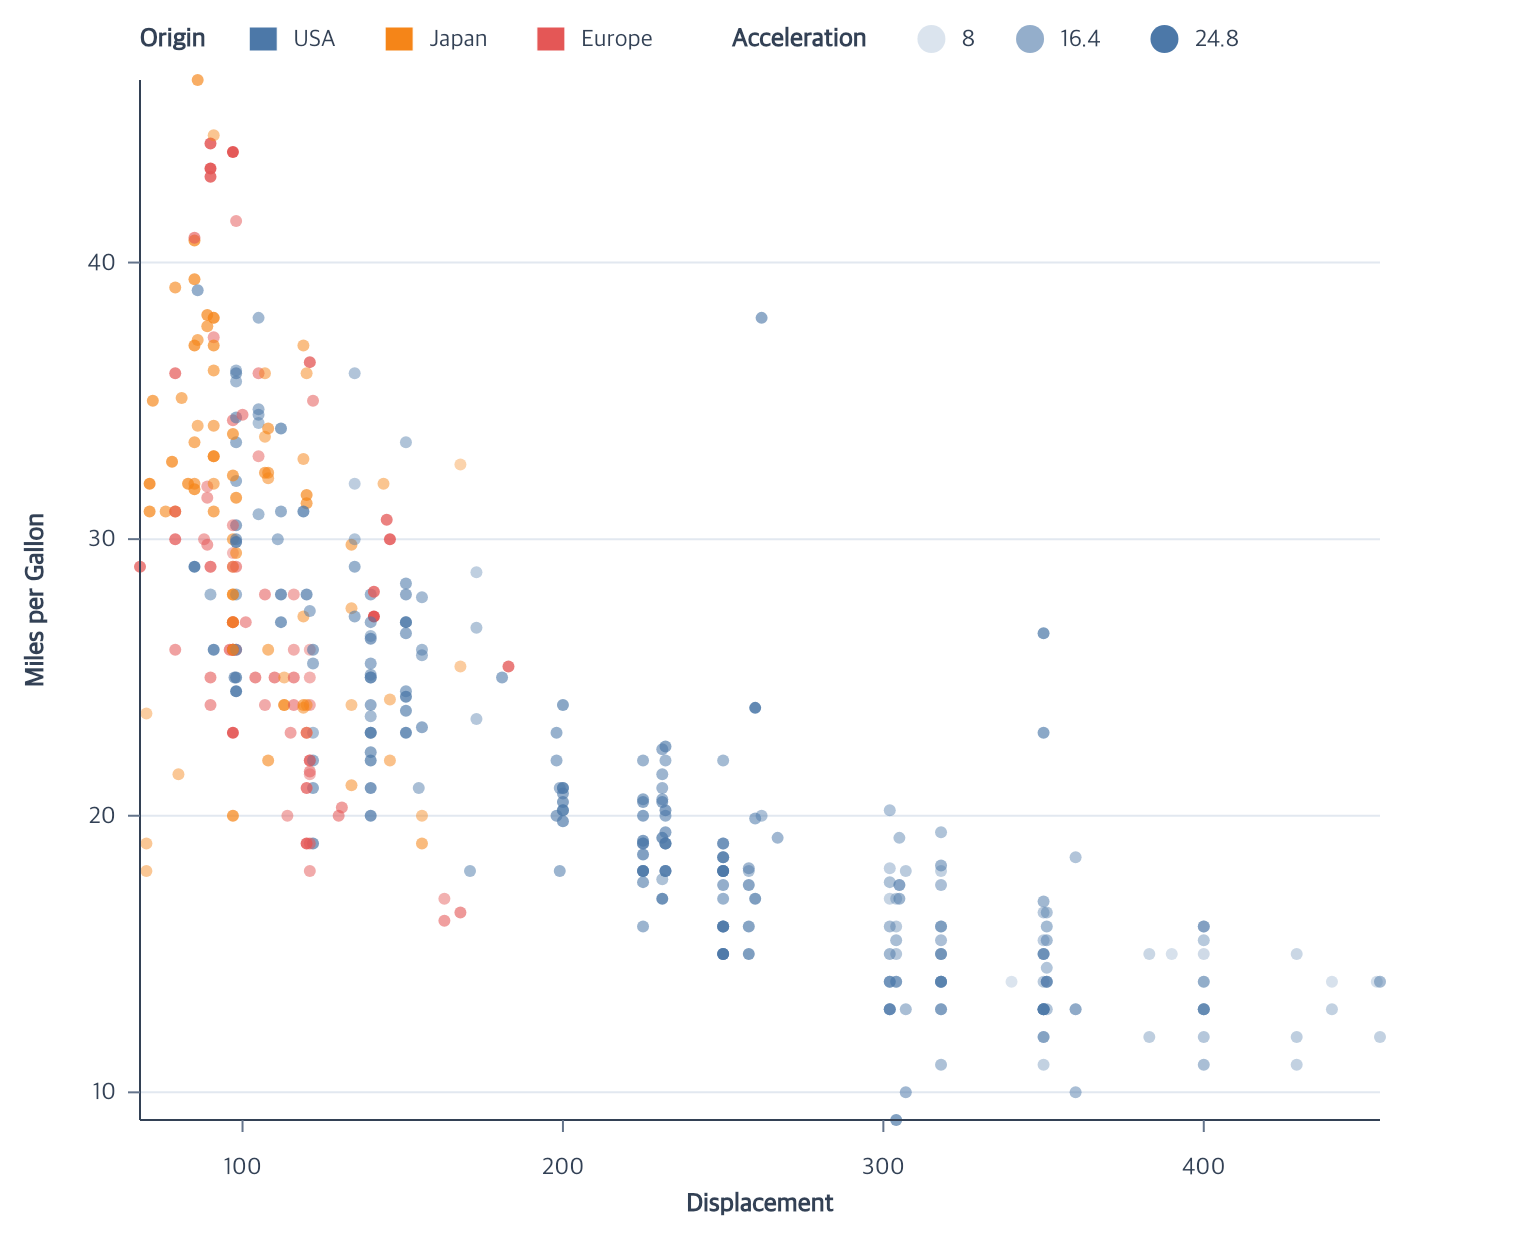
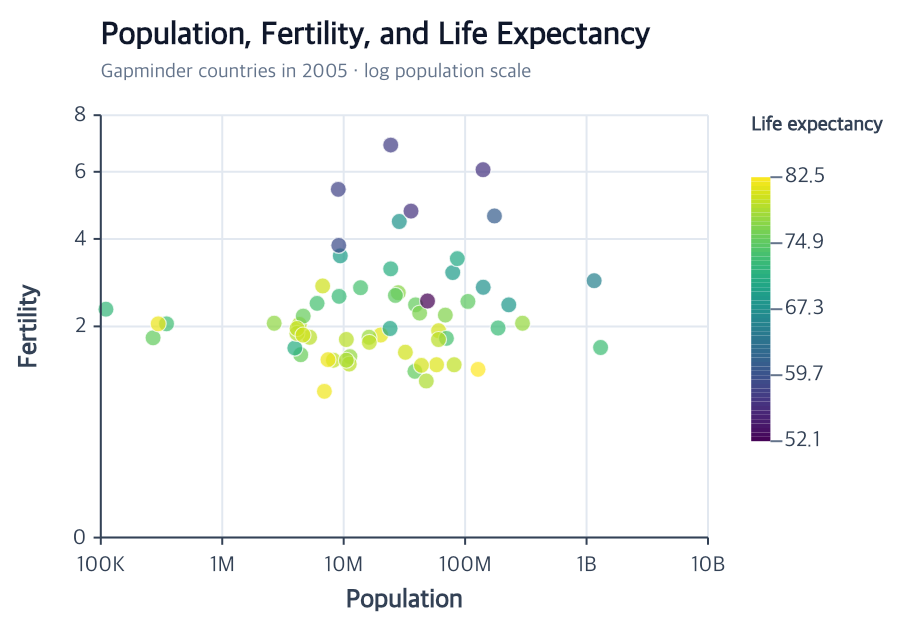
Compare two quantitative fields and encode a category with color.
createScatterPlot
View full size
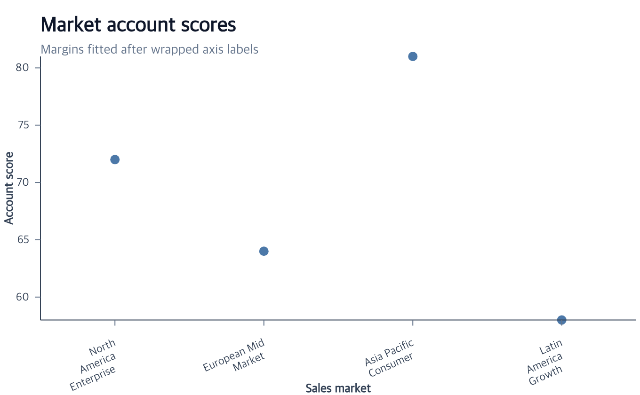
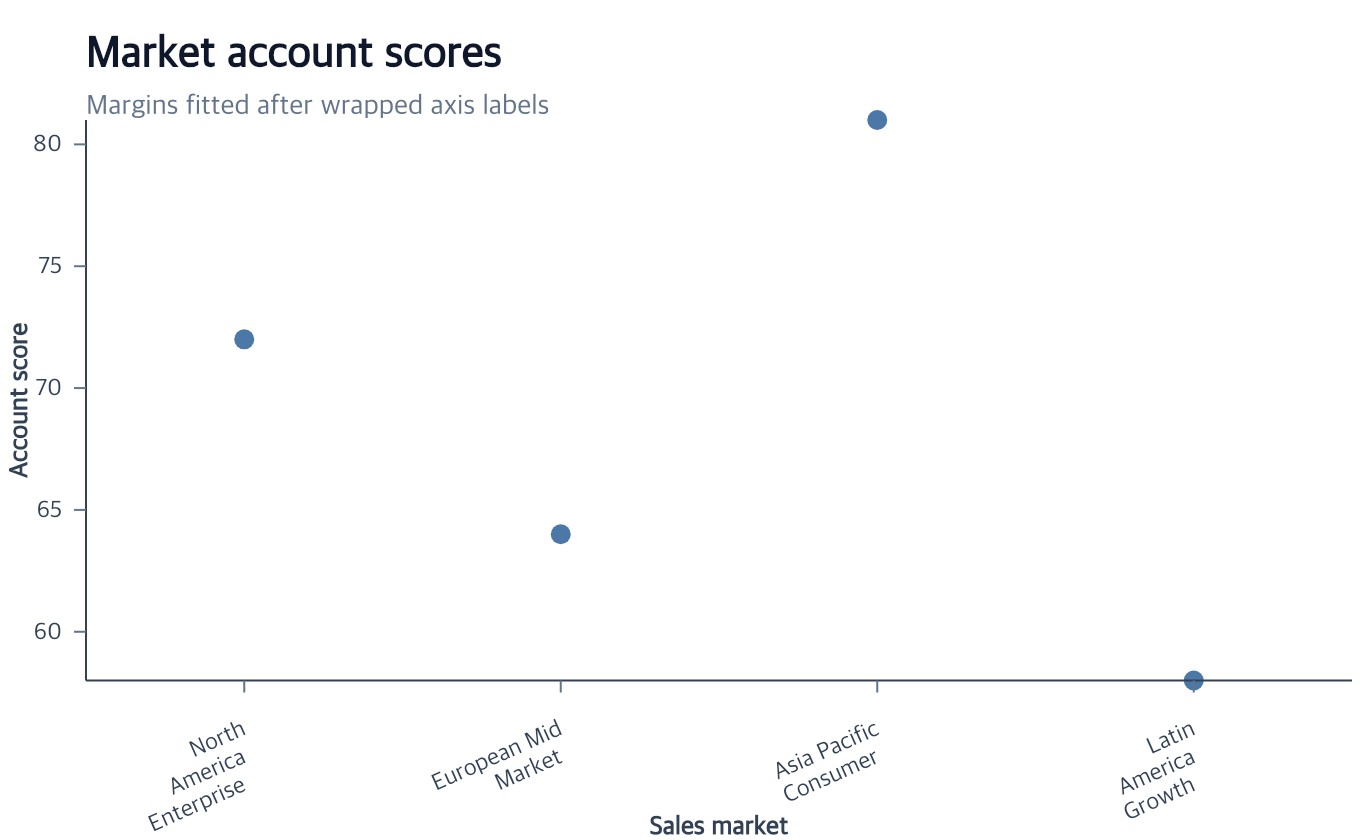
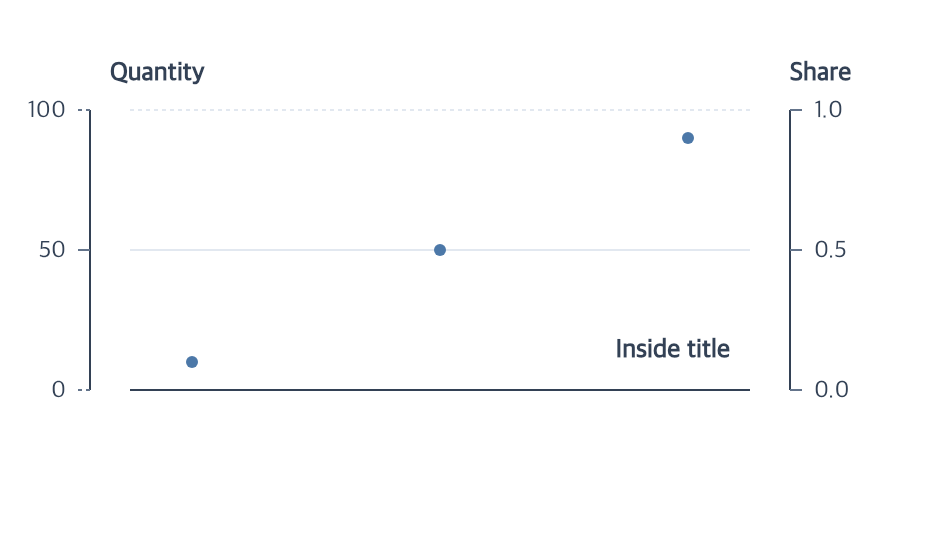
Fit chart margins after laying out long Cartesian axis labels.
createXAxis
View full size
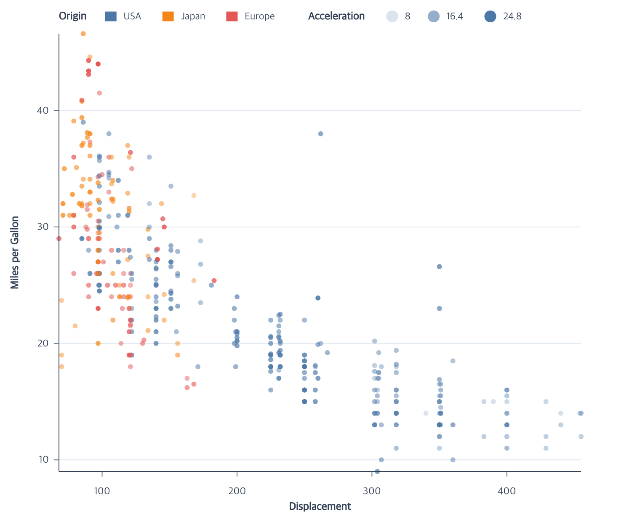
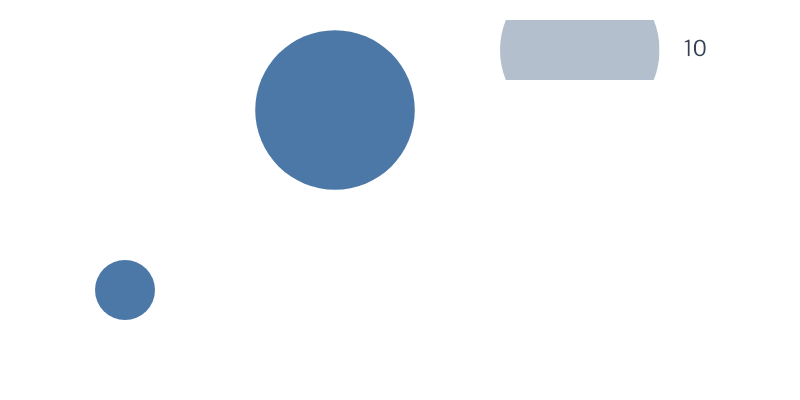
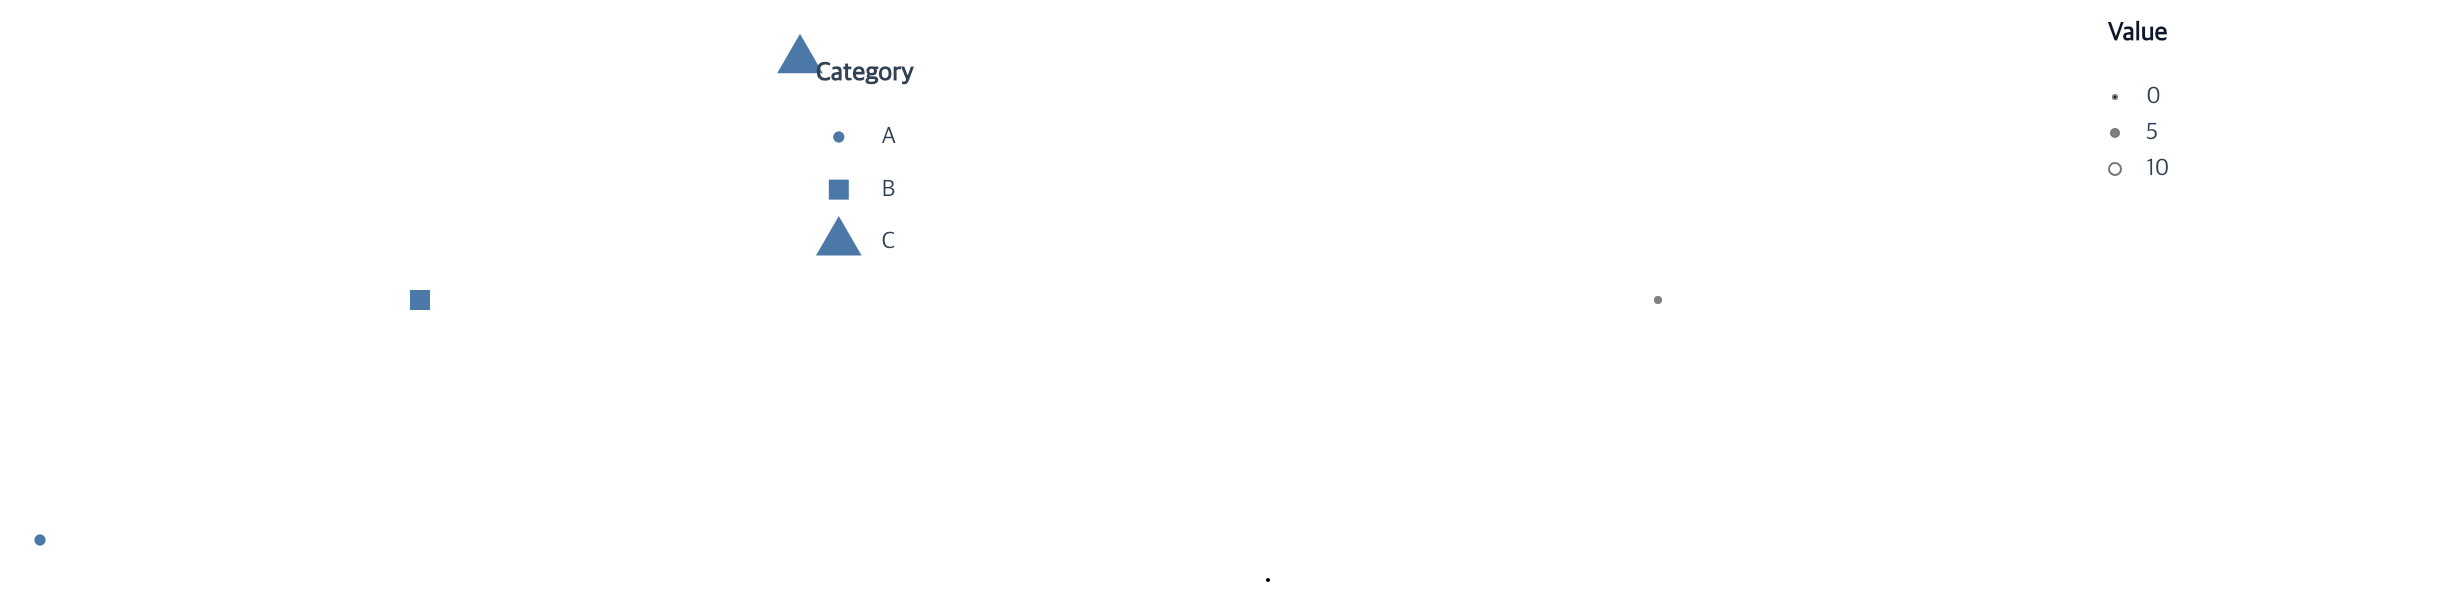
Place categorical and sampled opacity legends on one aligned horizontal reading line.
createLegend
editLegend
View full size
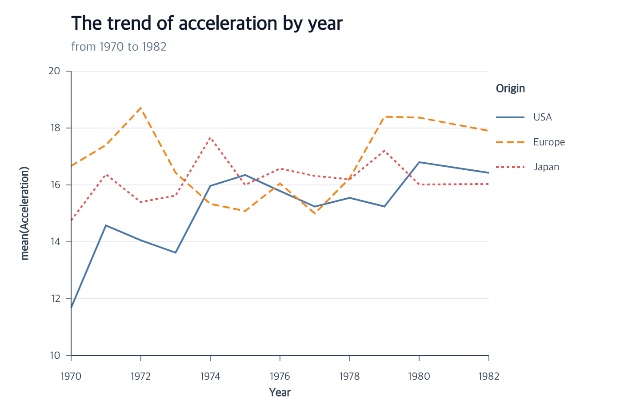
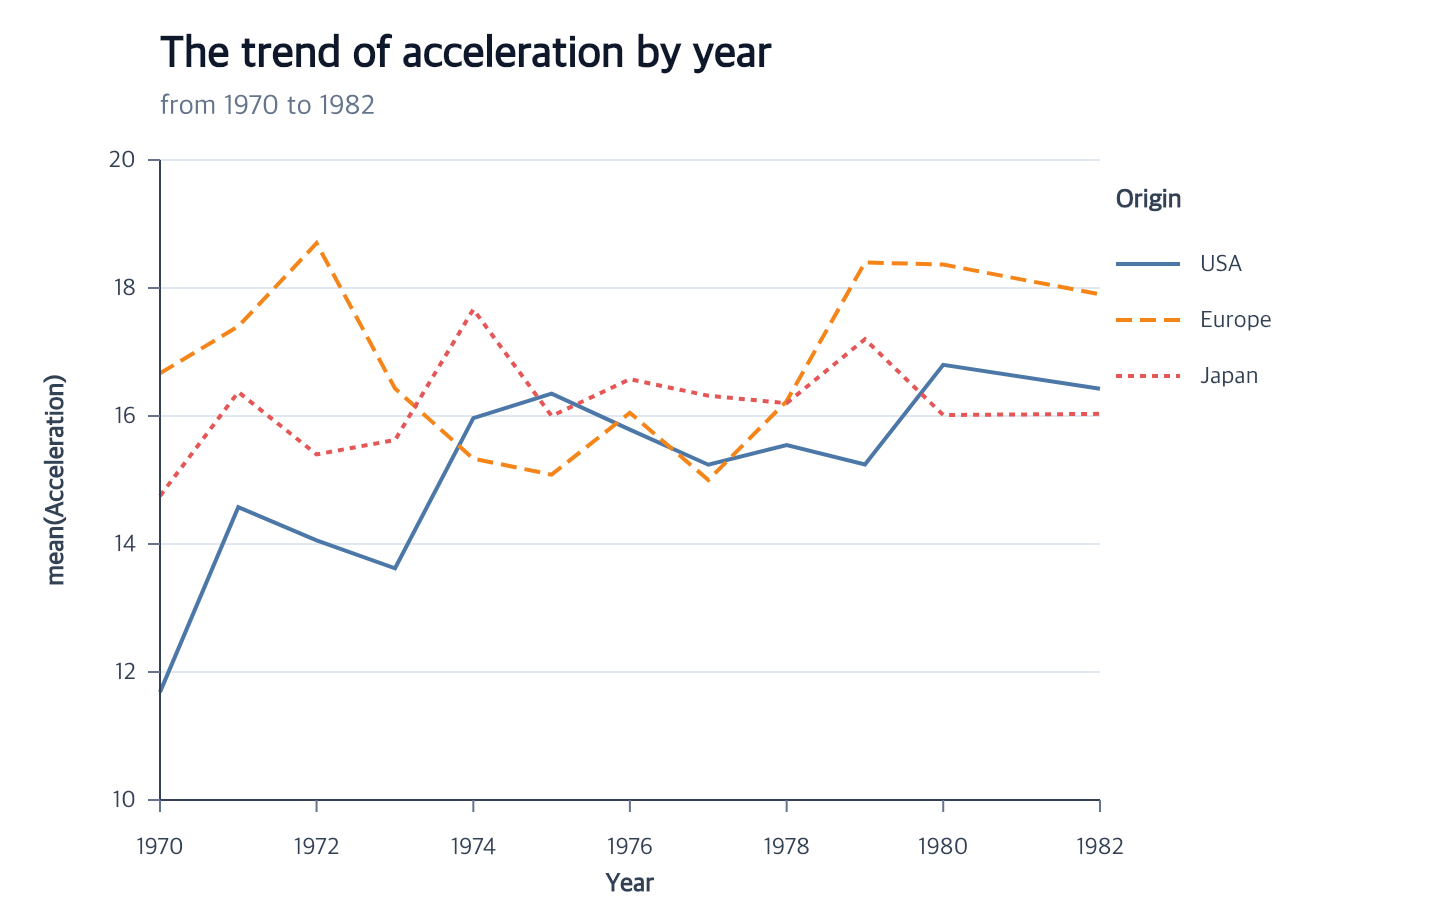
Aggregate values over time and split the result into series.
createLinePlot
View full size
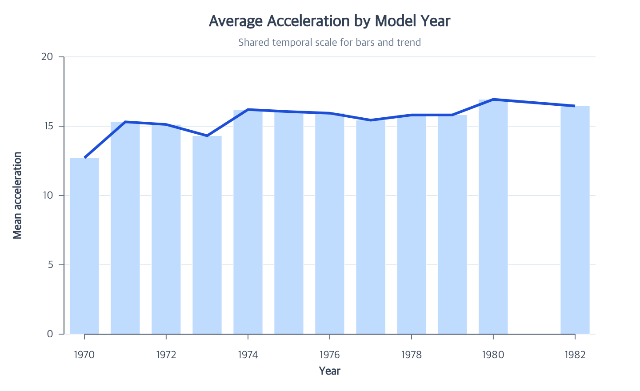
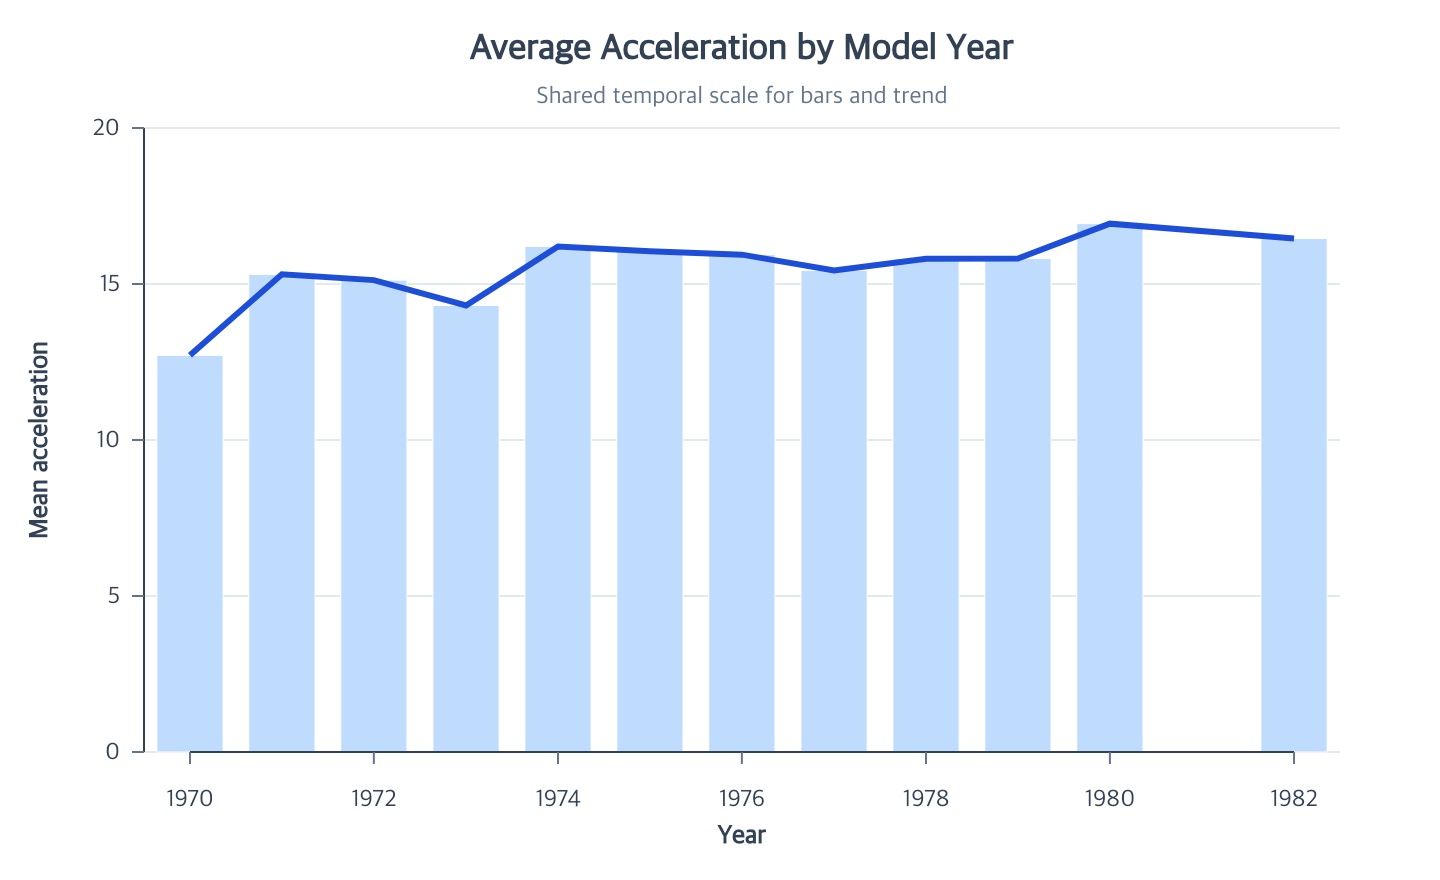
Layer compatible marks without repeating the line position encodings.
createBarMark
encodeX
encodeY
createLineMark
View full size
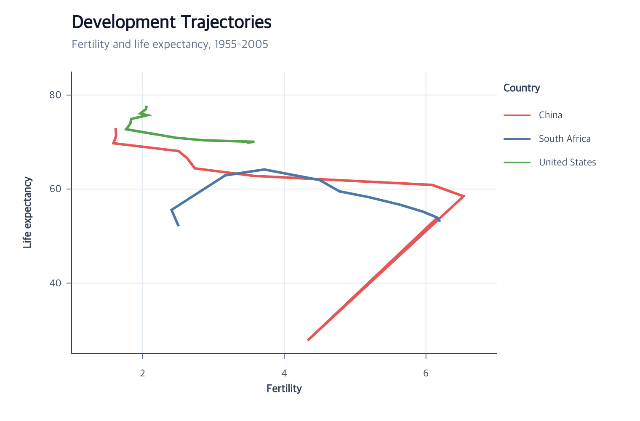
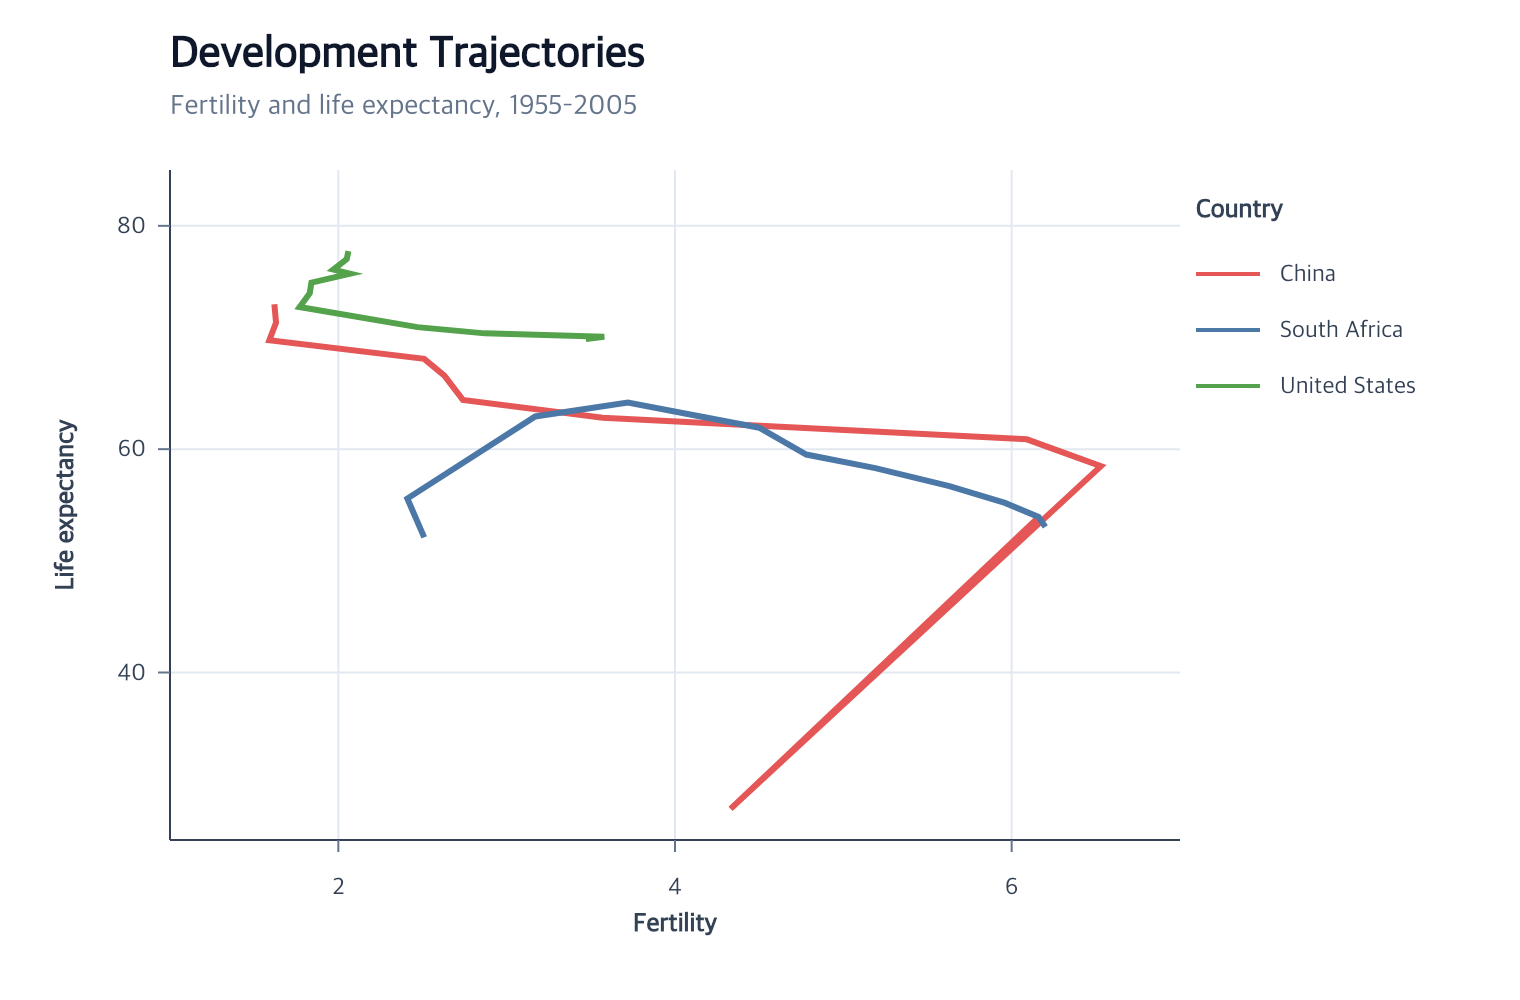
Connect repeated and non-monotonic positions by a separate quantitative order field.
createLineMark
encodePathOrder
removePathOrder
View full size
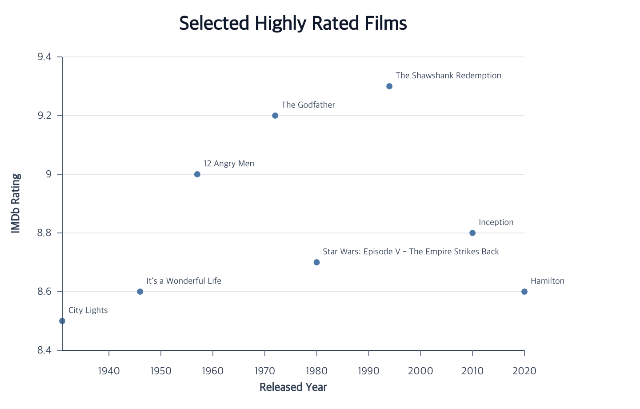
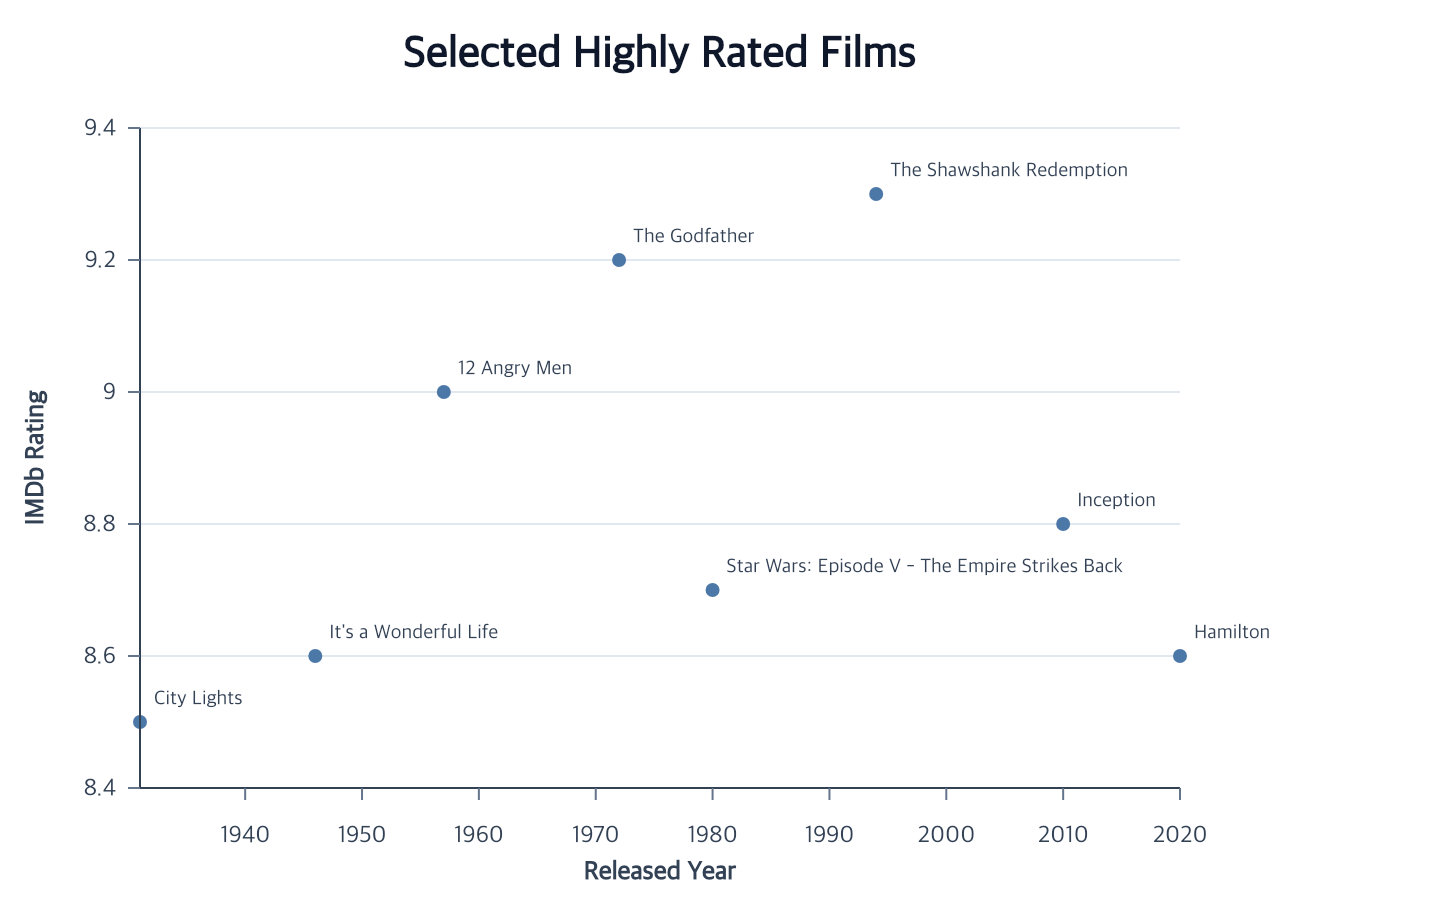
Attach readable data labels to final point, bar, or rule items.
createTextMark
encodeText
editTextMark
View full size
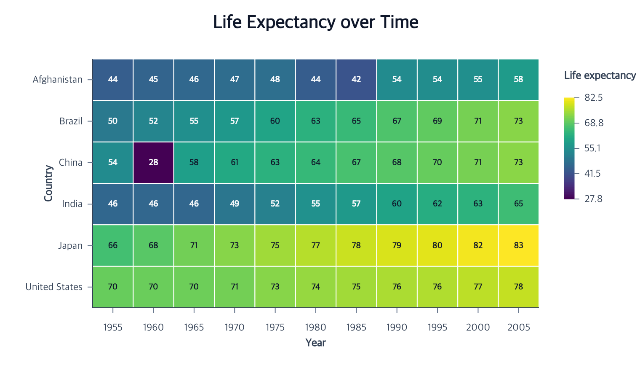
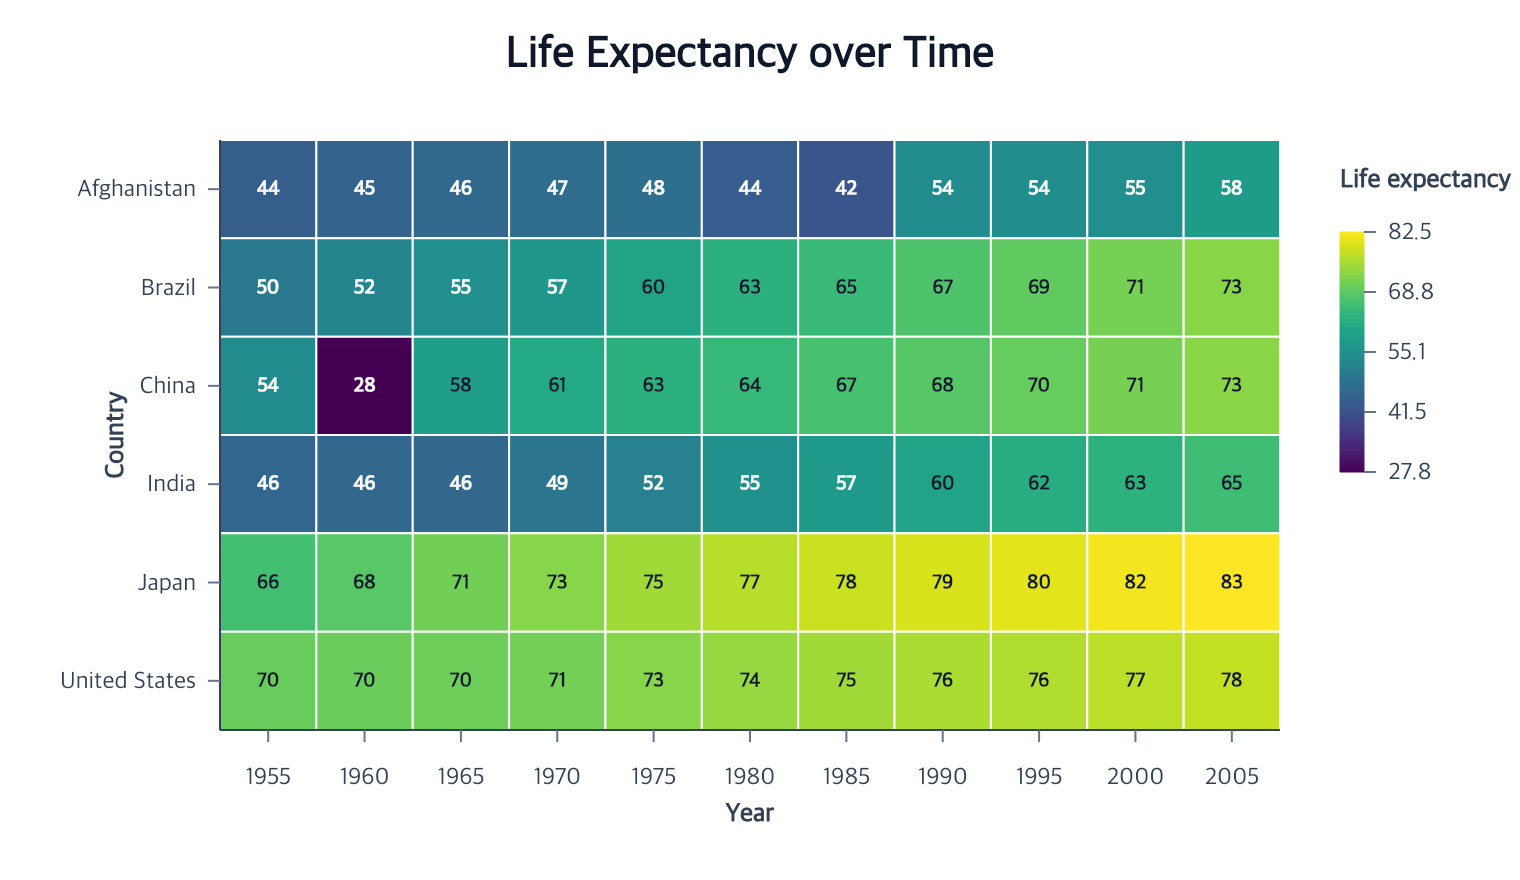
Map two discrete fields to cells and a quantitative field to color.
createHeatmap
createTextMark
encodeText
View full size
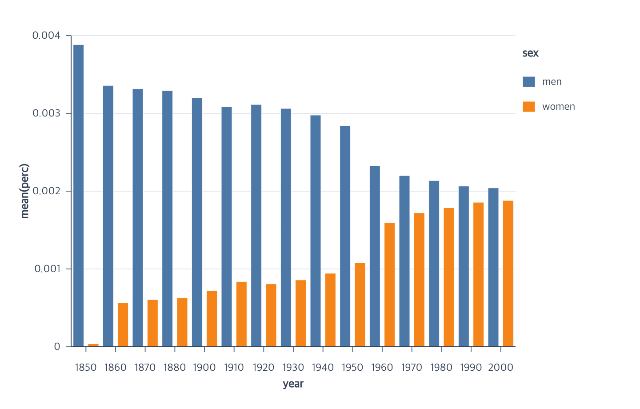
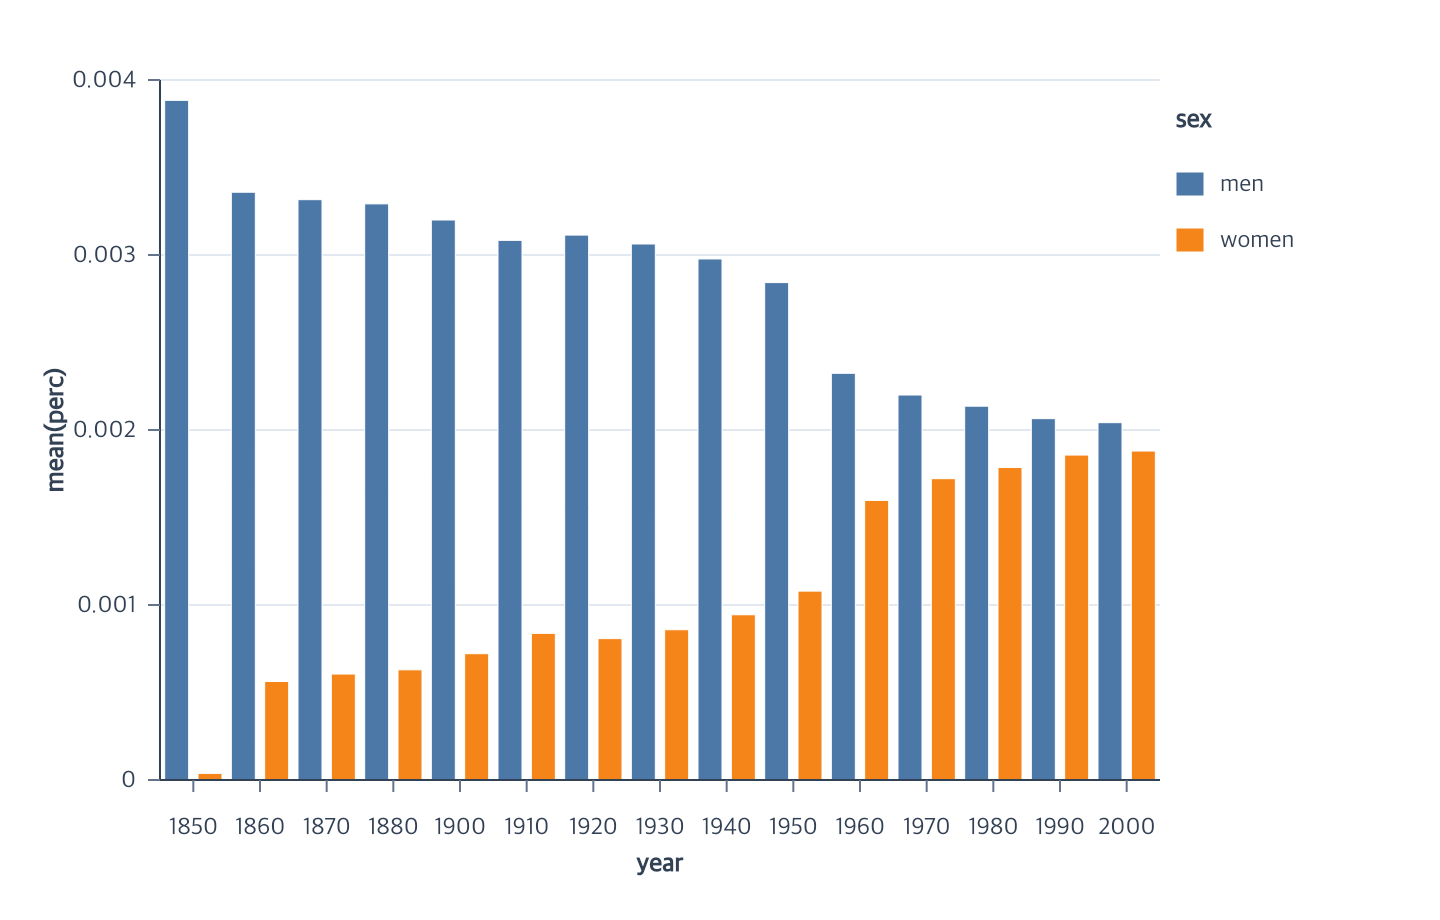
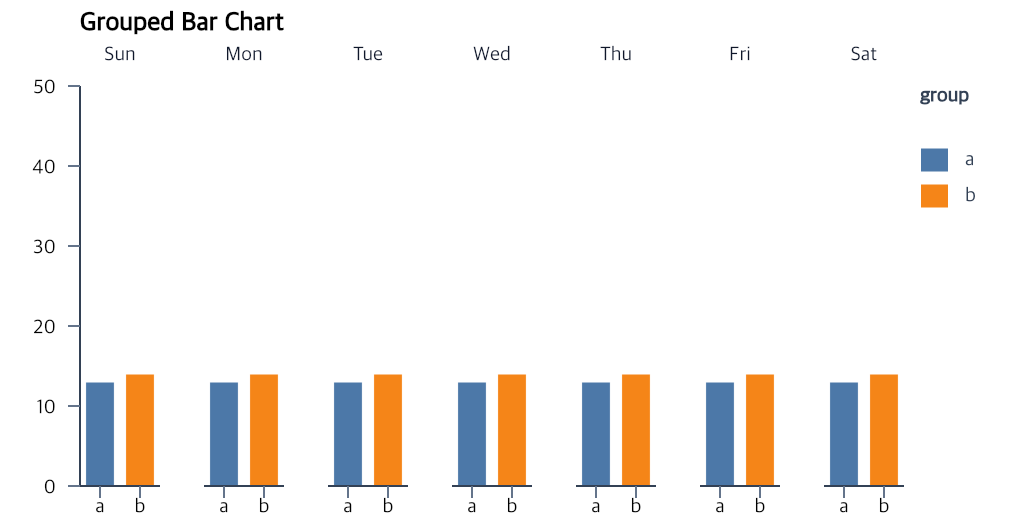
Aggregate ordinal categories and arrange nominal groups side by side.
createBarPlot
View full size
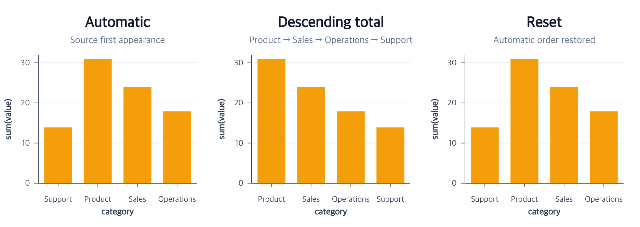
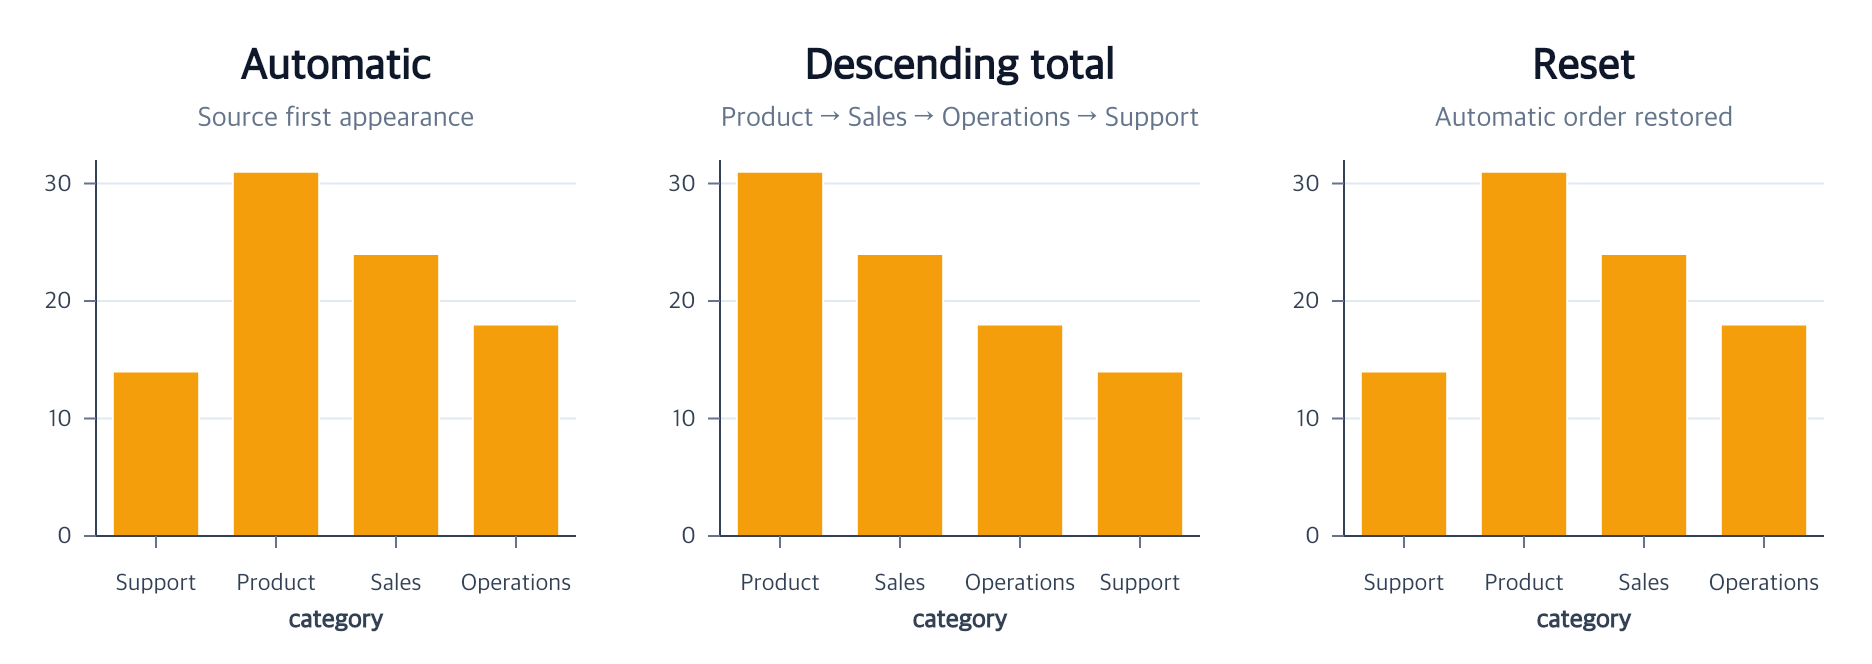
Order categorical x or y positions explicitly or from a stable aggregate summary.
orderCategories
removeCategoryOrder
View full size
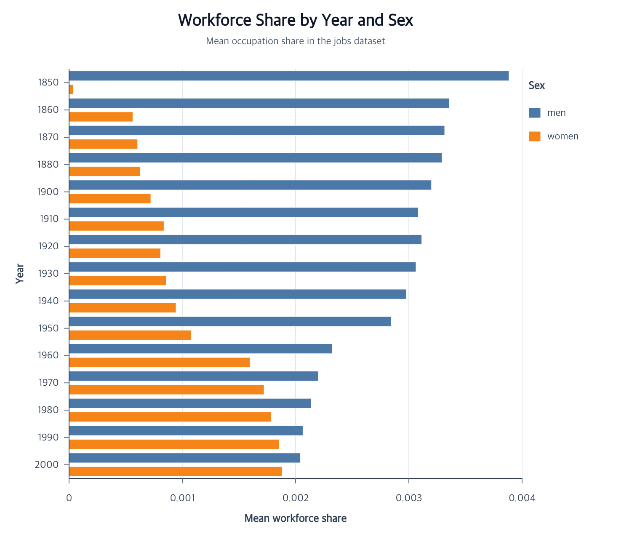
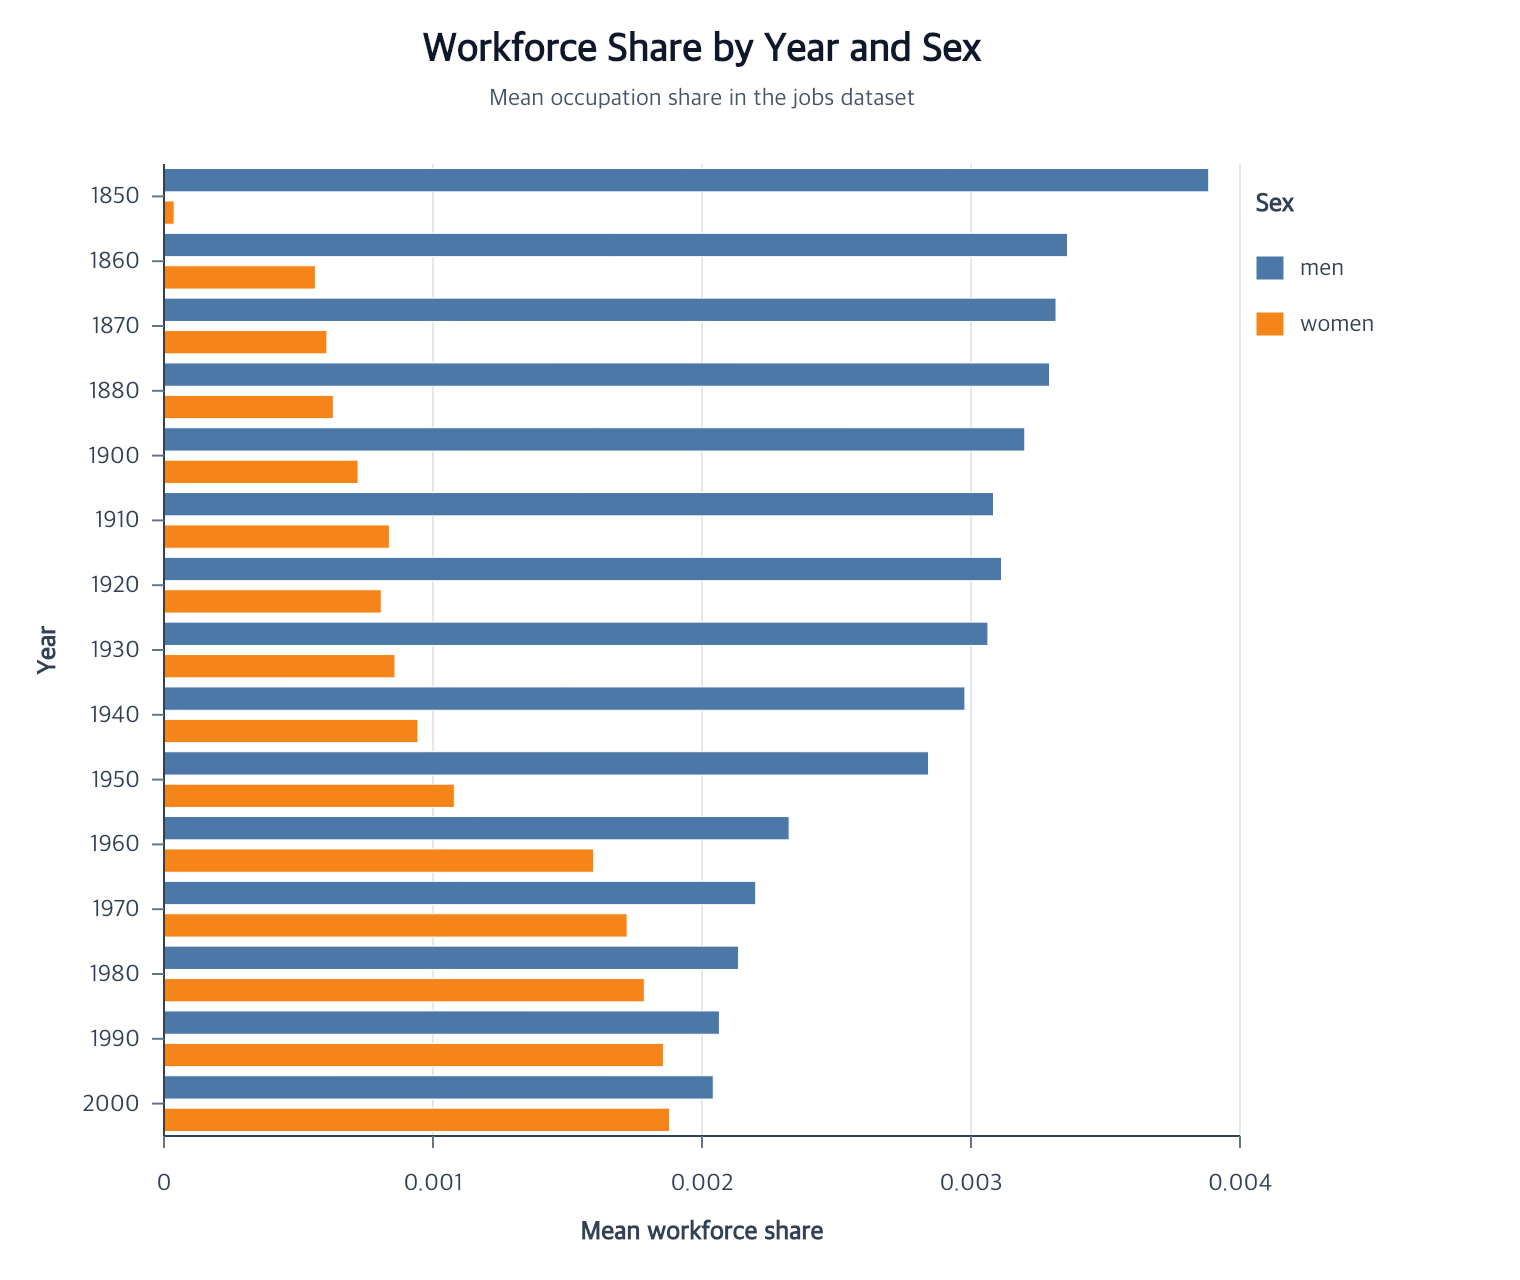
Compare grouped aggregate values with a horizontal measure axis.
createBarMark
encodeX
encodeY
encodeColor
View full size
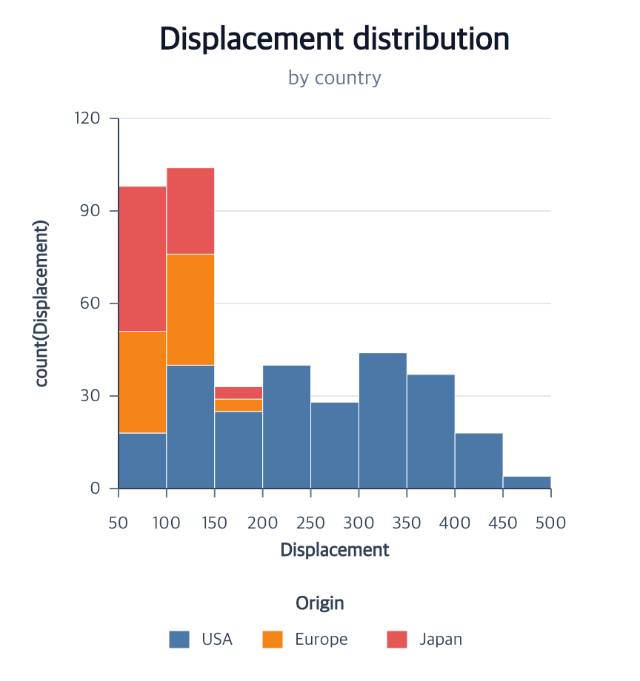
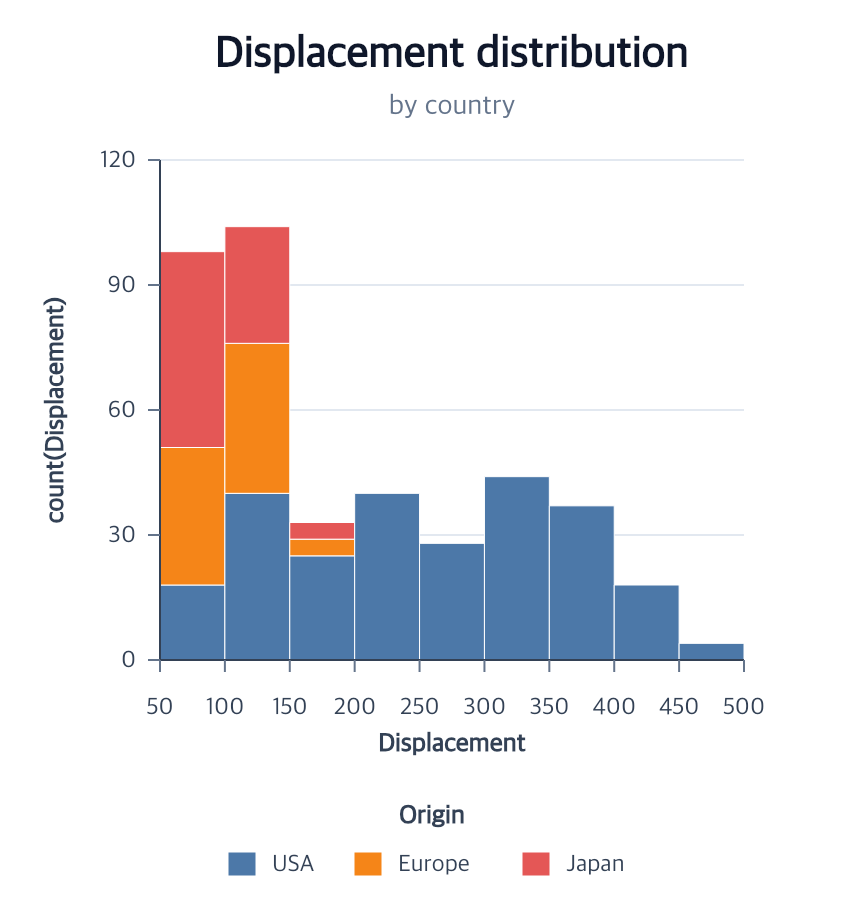
Bin a quantitative field and count category partitions.
createHistogram
View full size
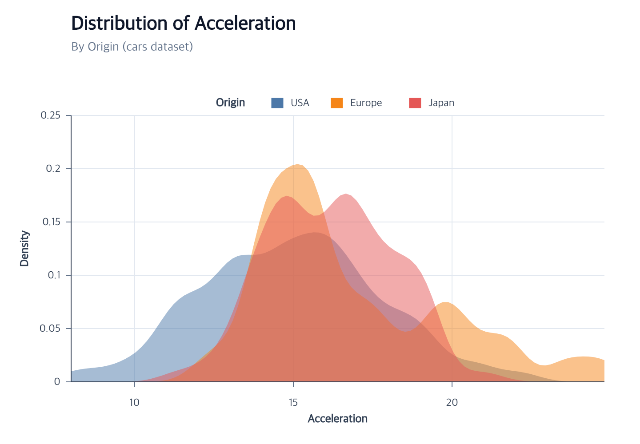
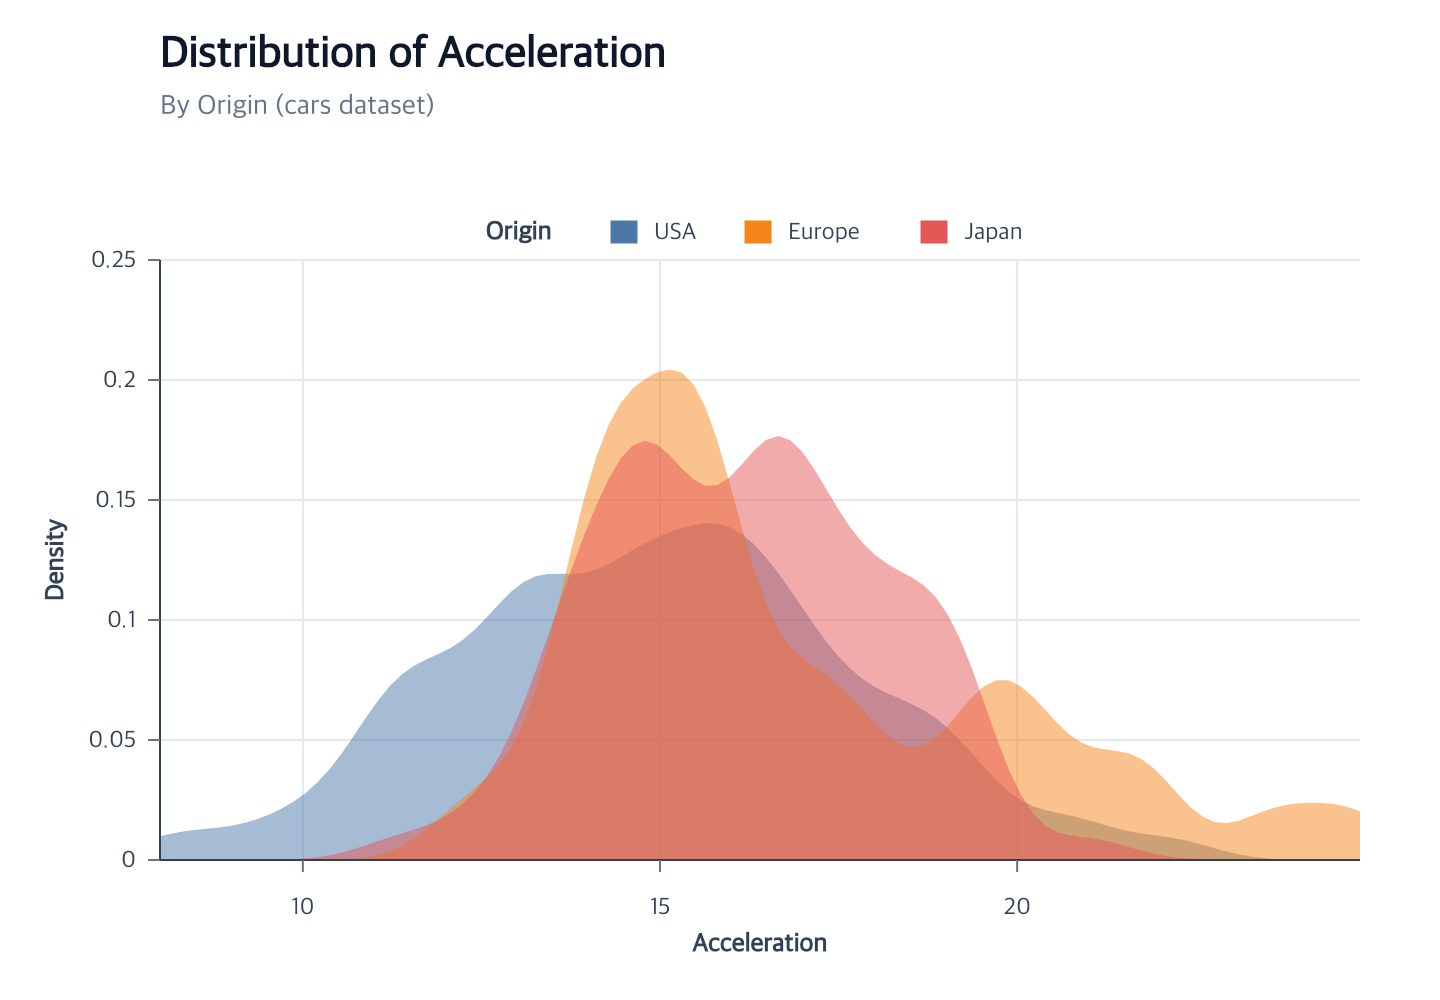
Estimate grouped distributions and draw baseline-closed areas.
createAreaMark
encodeDensity
encodeColor
View full size
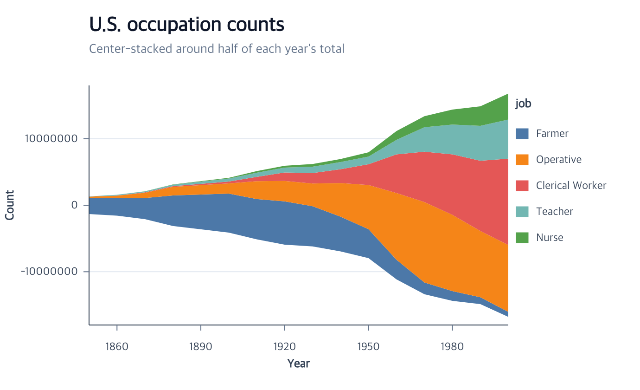
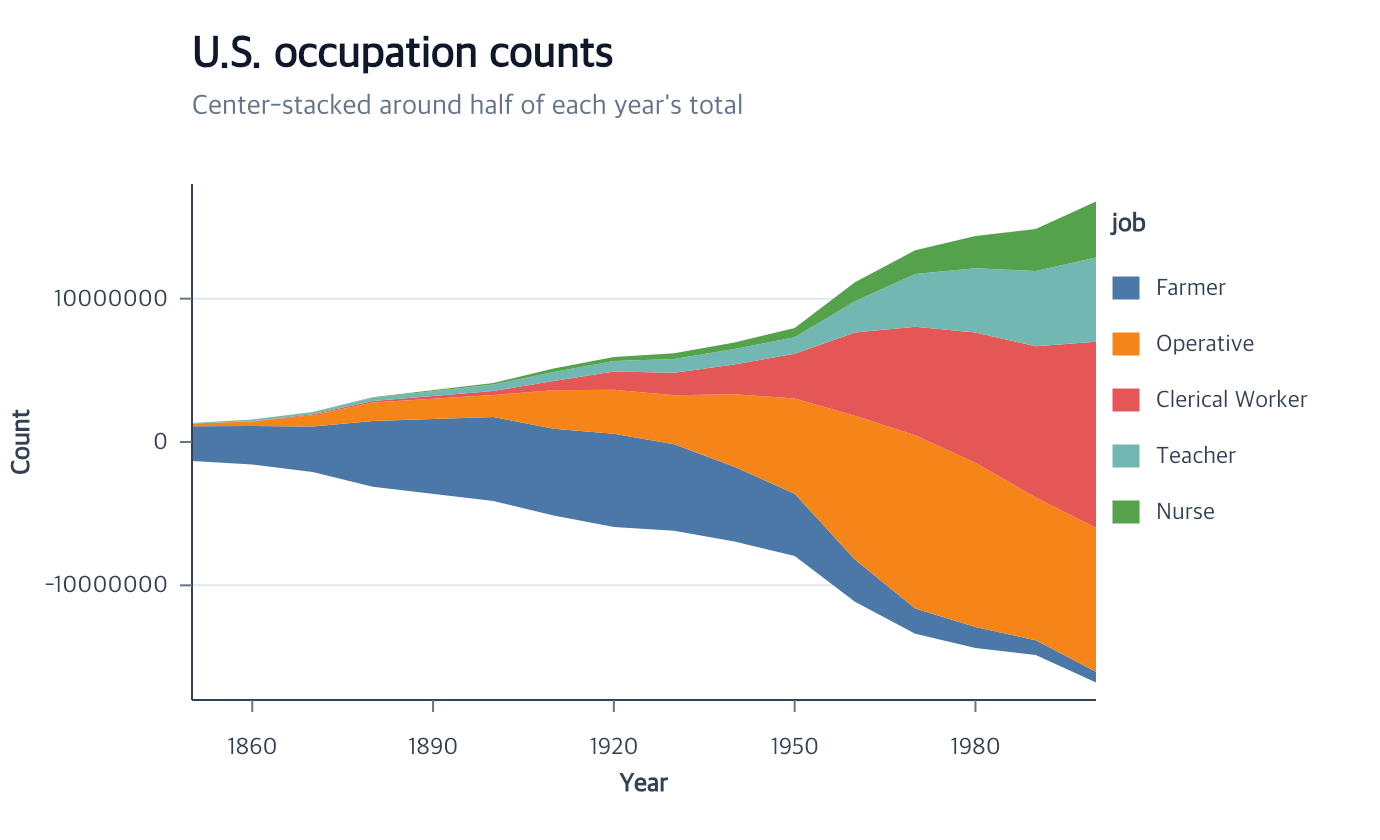
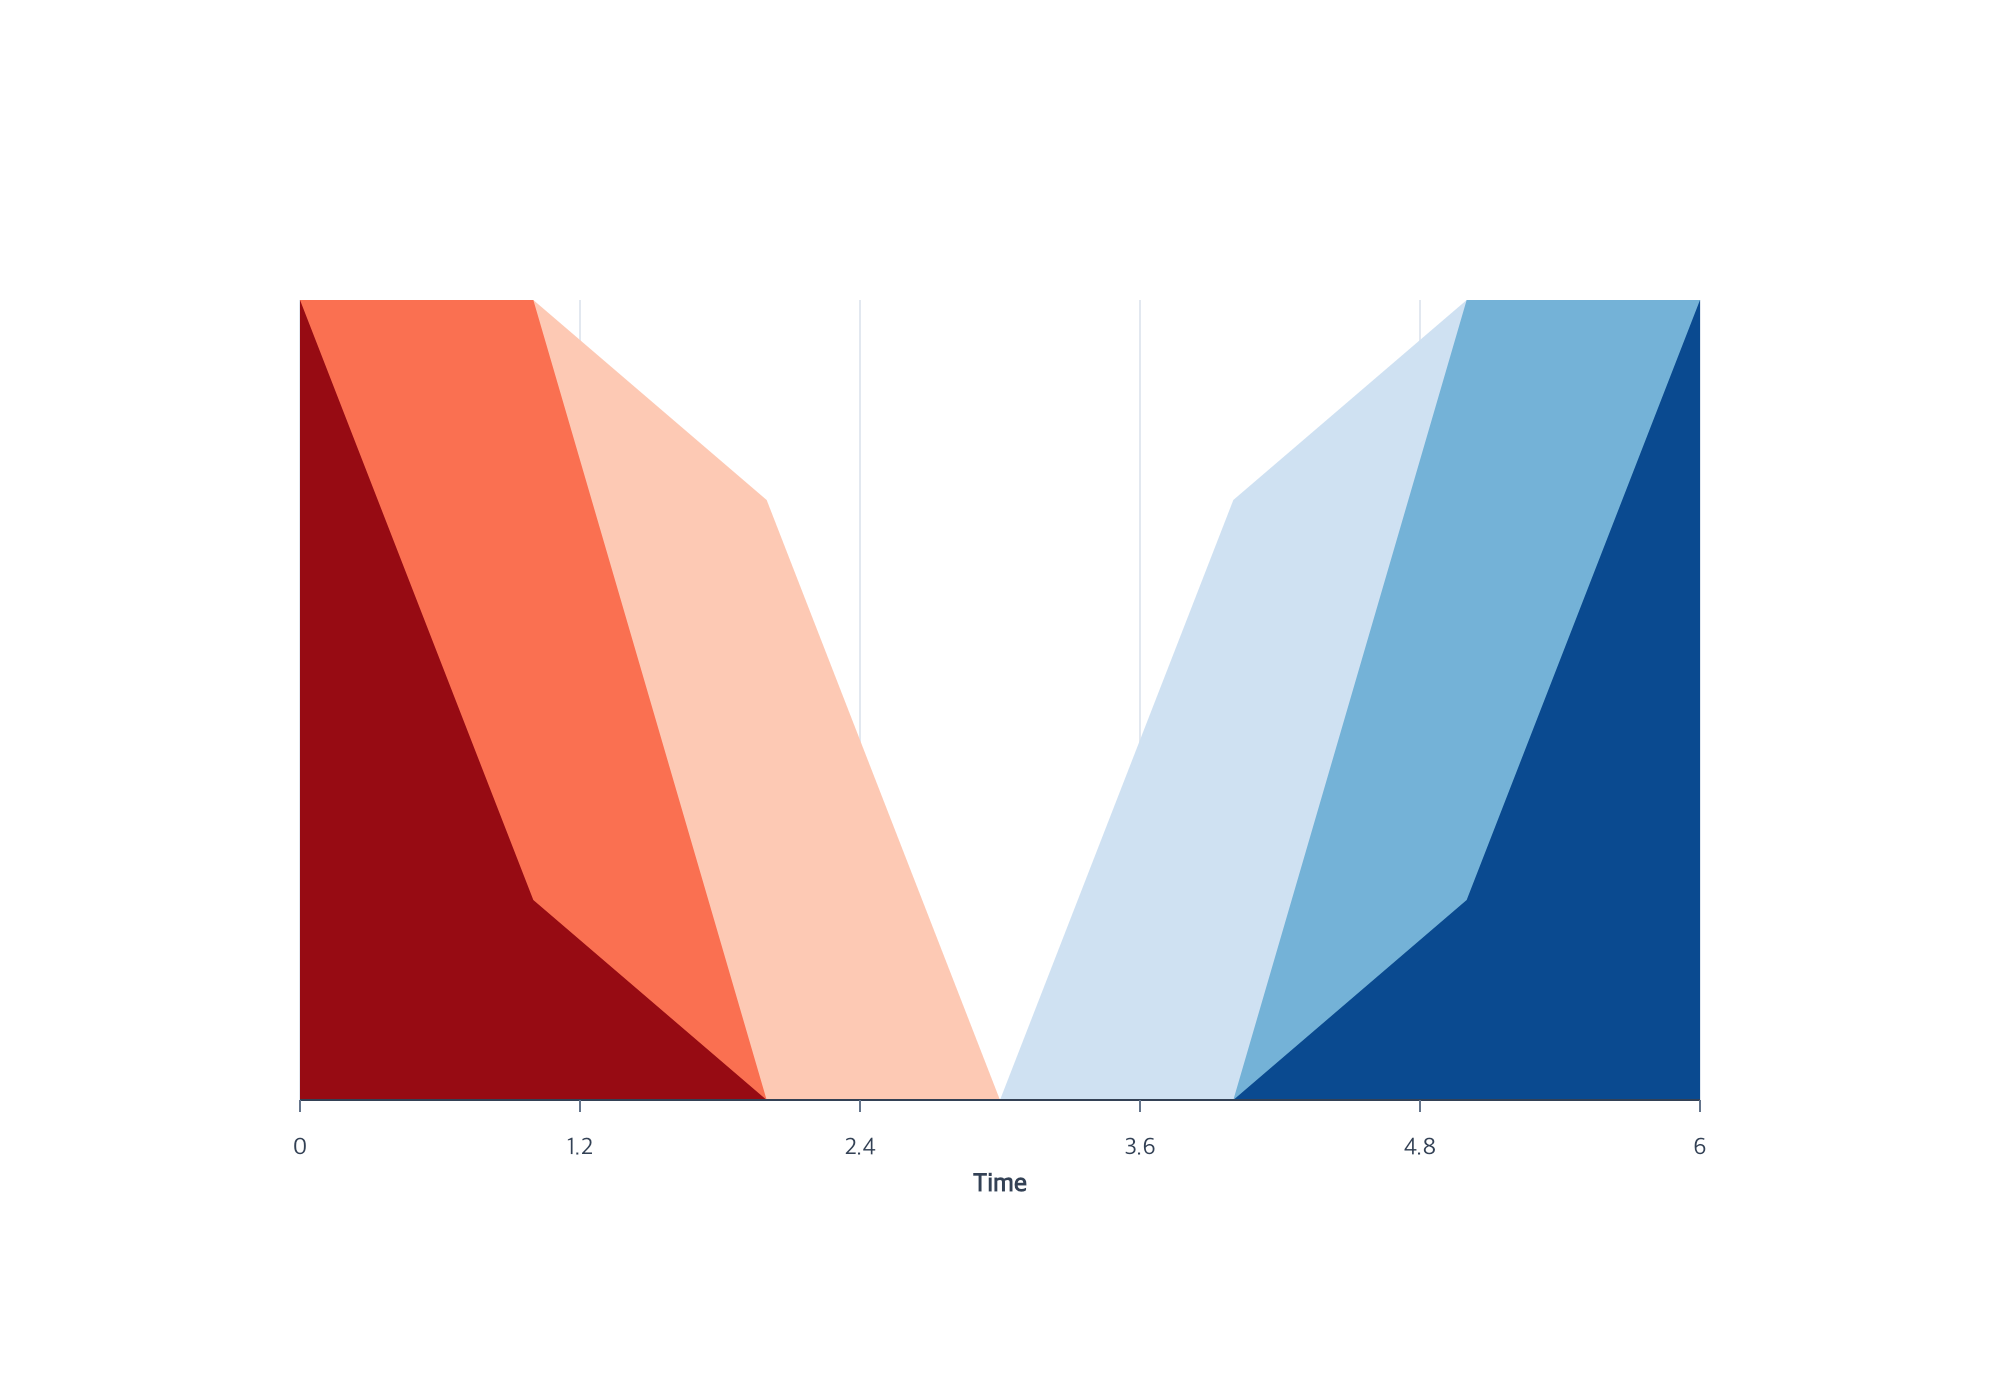
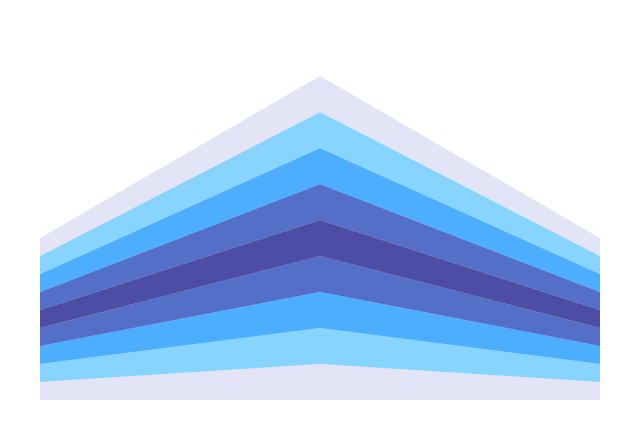
Preserve series thickness while centering each time partition around zero.
createAreaMark
encodeX
encodeY
encodeColor
View full size
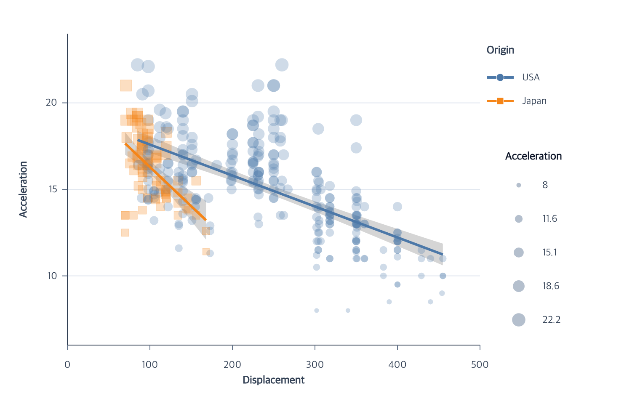
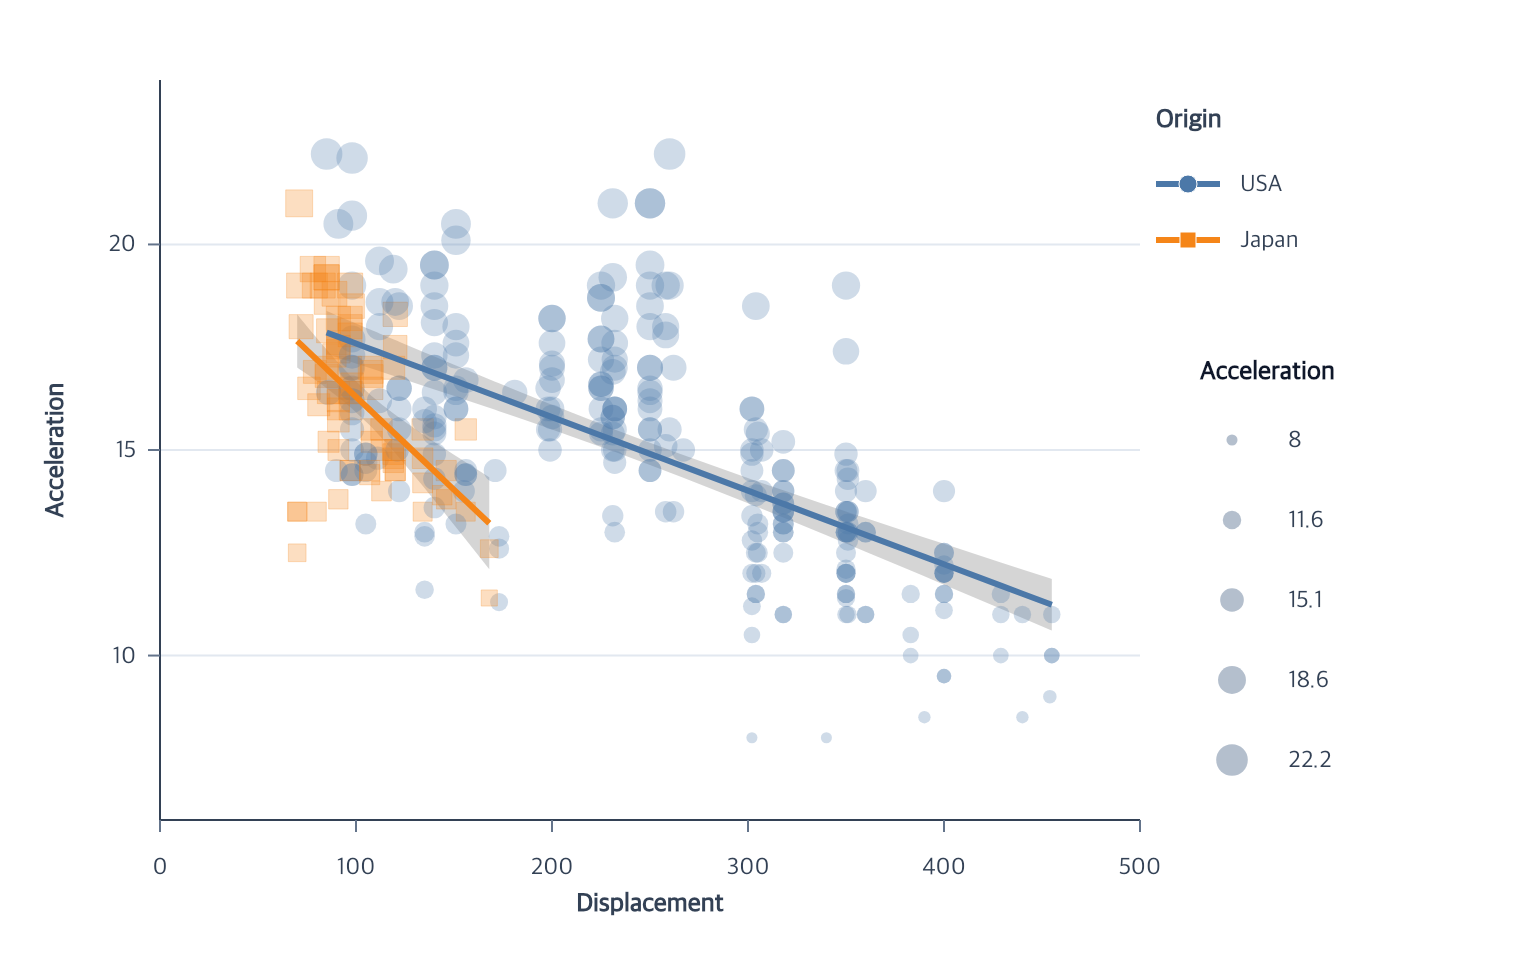
Layer observations, grouped fits, and confidence bands.
createPointMark
createRegression
View full size
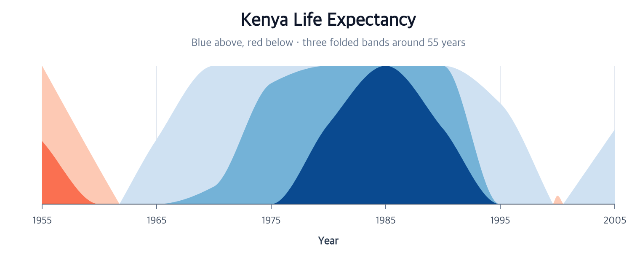
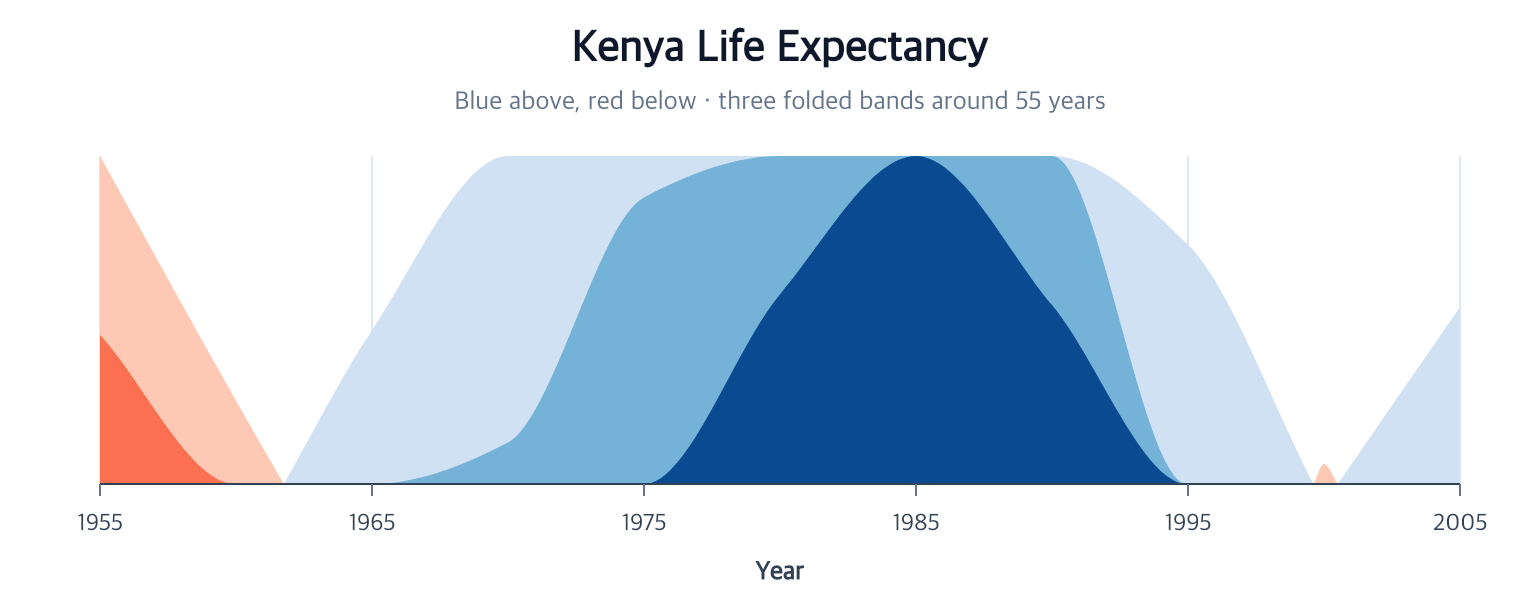
Compress a long time series by folding values above and below a baseline.
createAreaMark
encodeHorizon
editHorizon
View full size
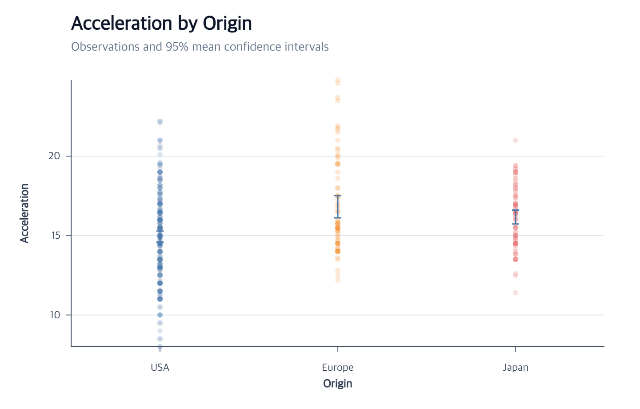
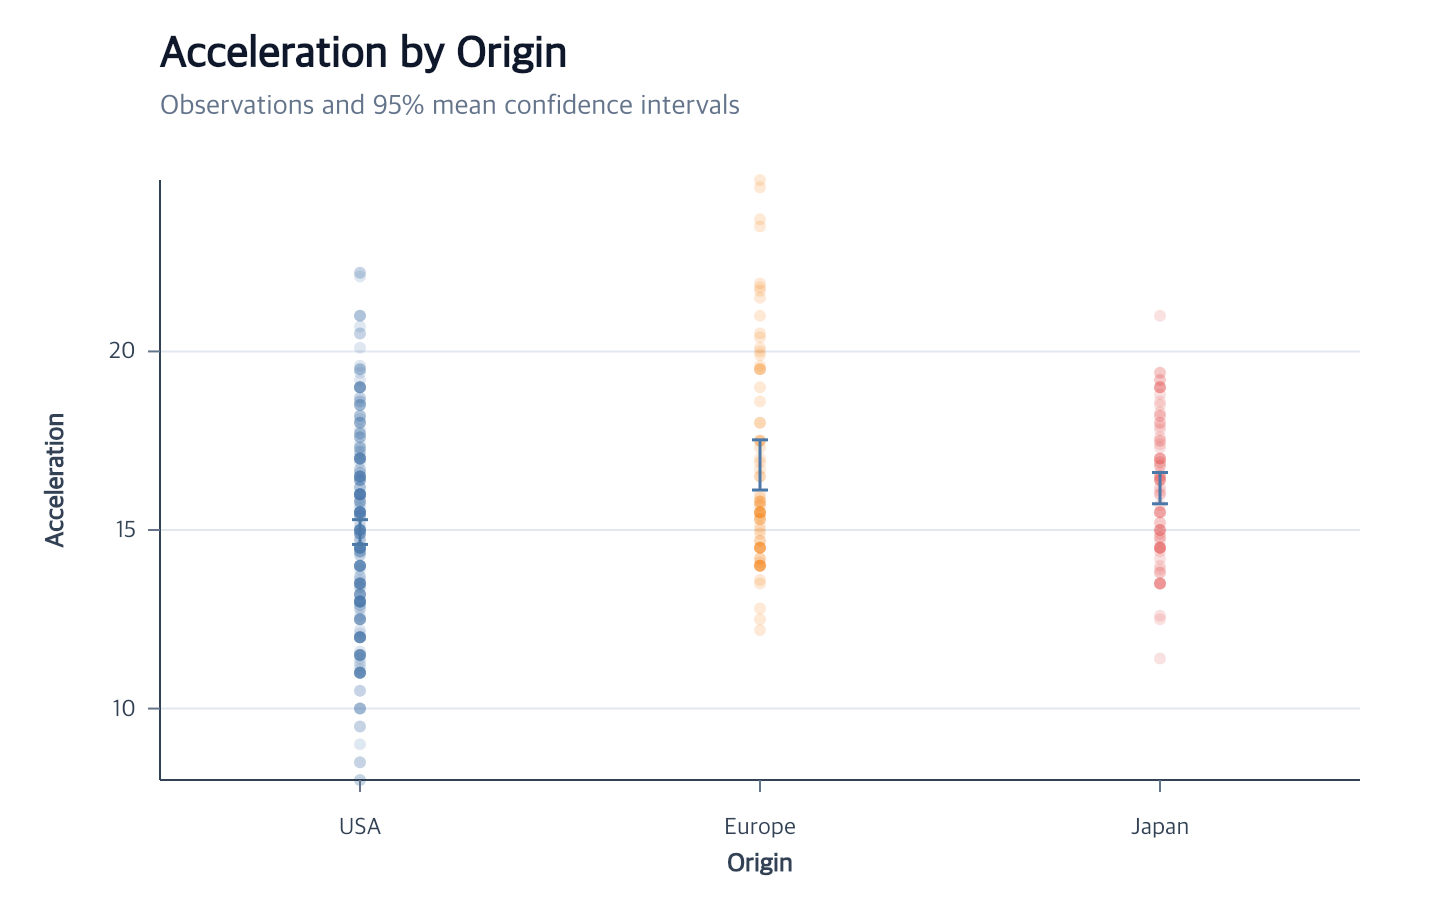
Keep observations visible while summarizing group uncertainty.
createErrorBar
View full size
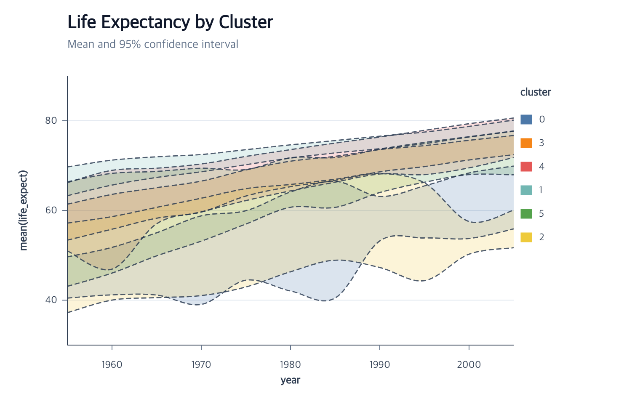
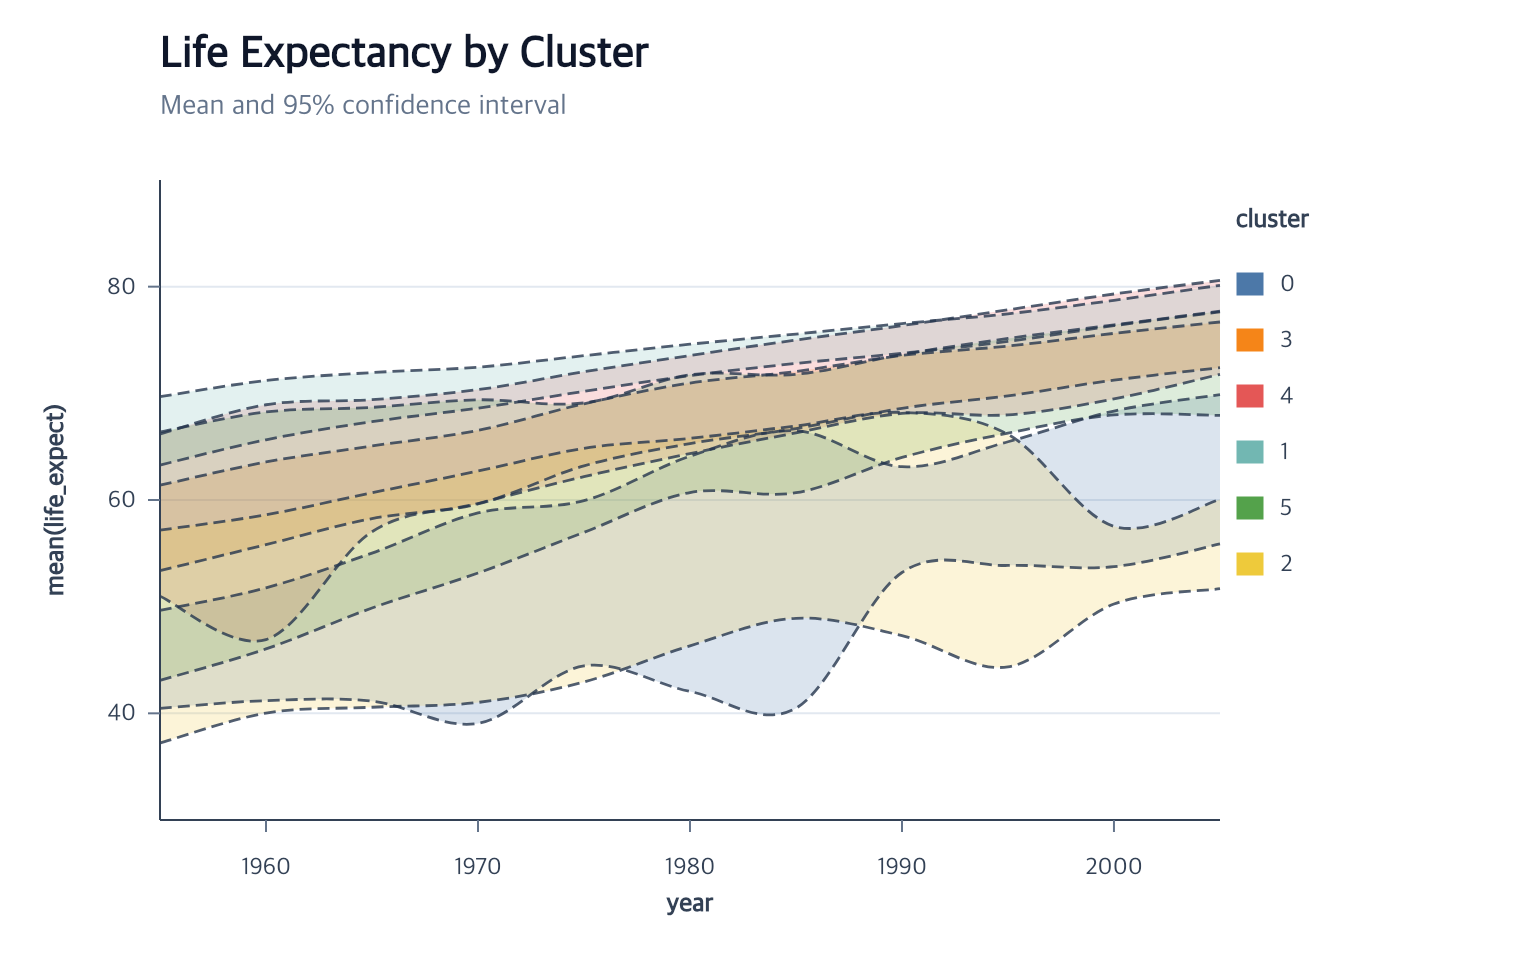
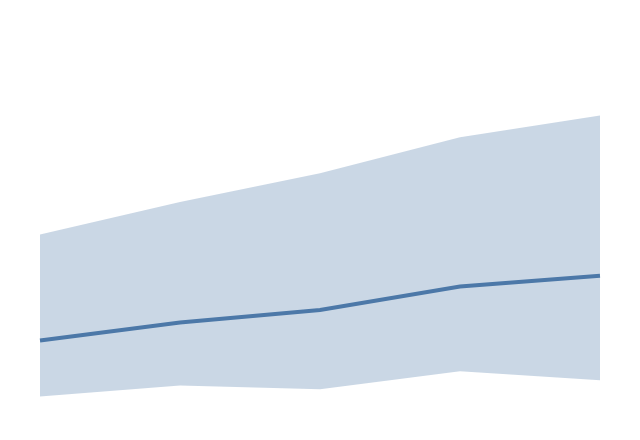
Show interval ribbons with explicit lower and upper boundaries.
createErrorBand
View full size
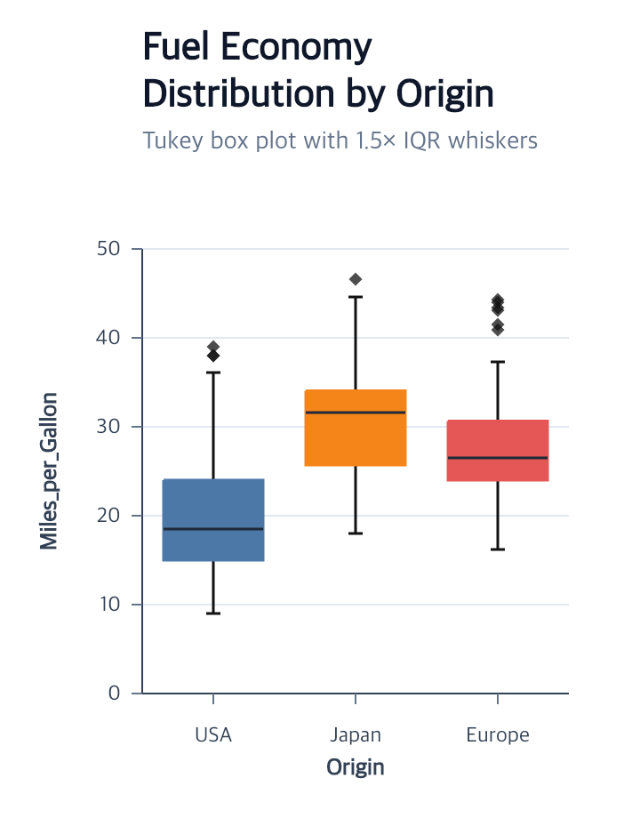
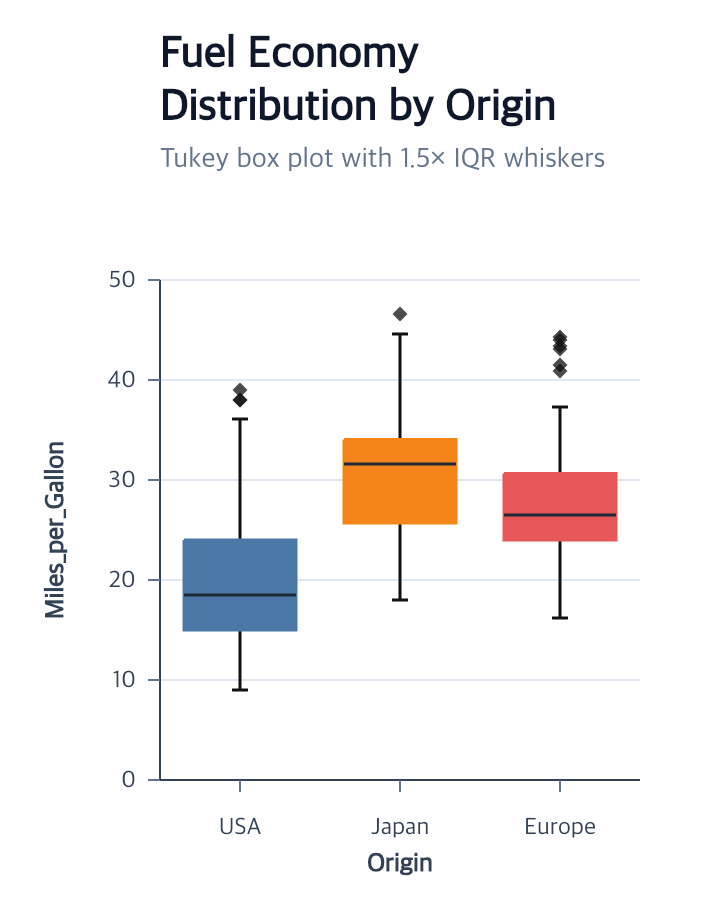
Compose quartiles, whiskers, medians, and outlier points.
createBoxPlot
View full size
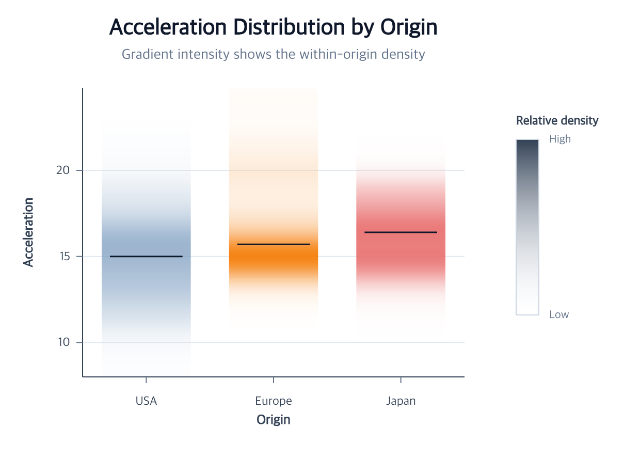
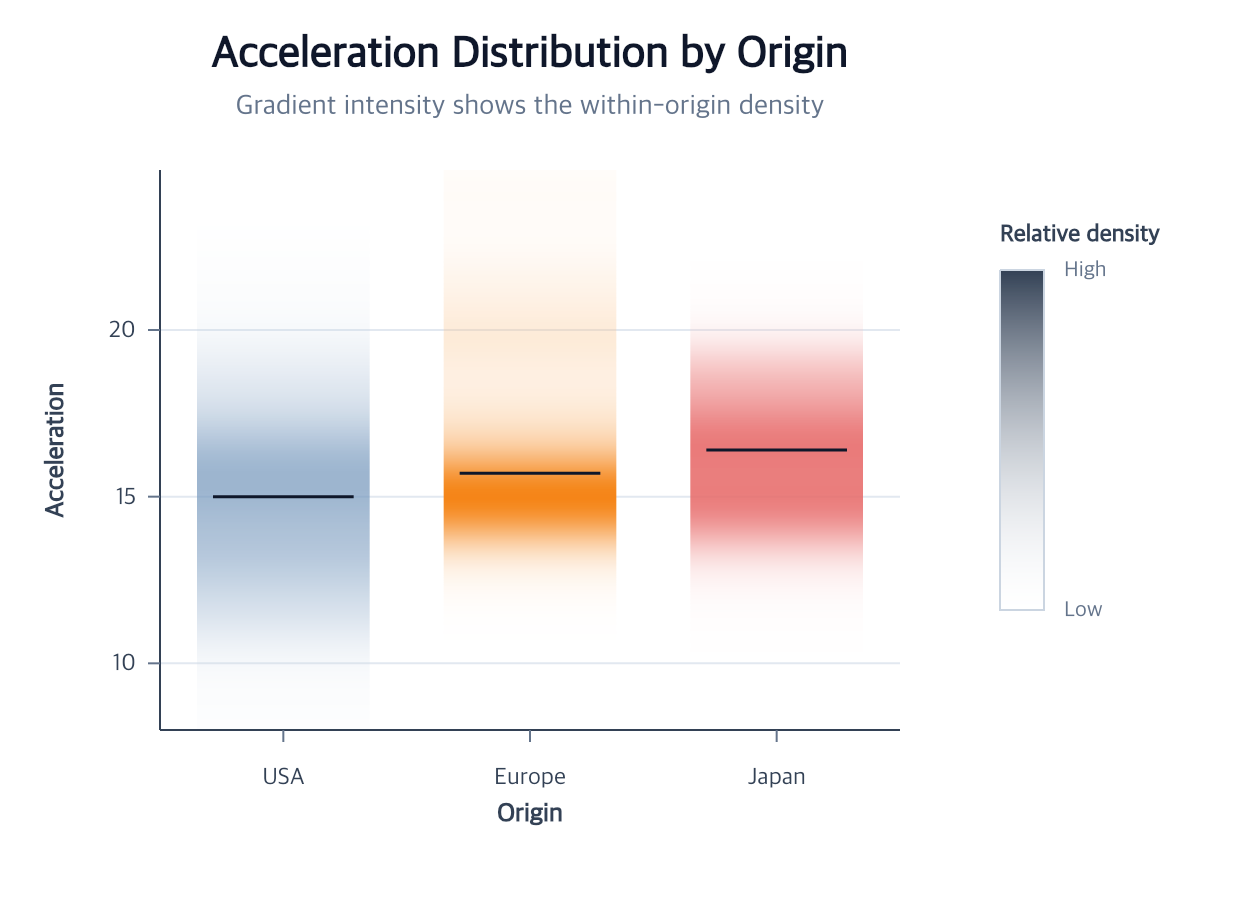
Compare complete distribution shapes across categories in a compact strip.
createGradientPlot
editGradientPlot
View full size
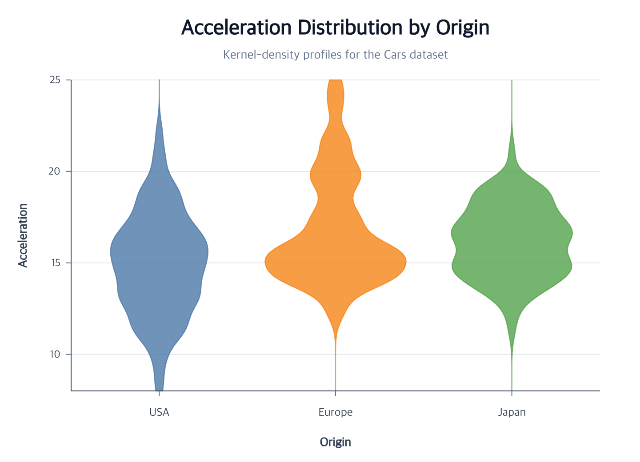
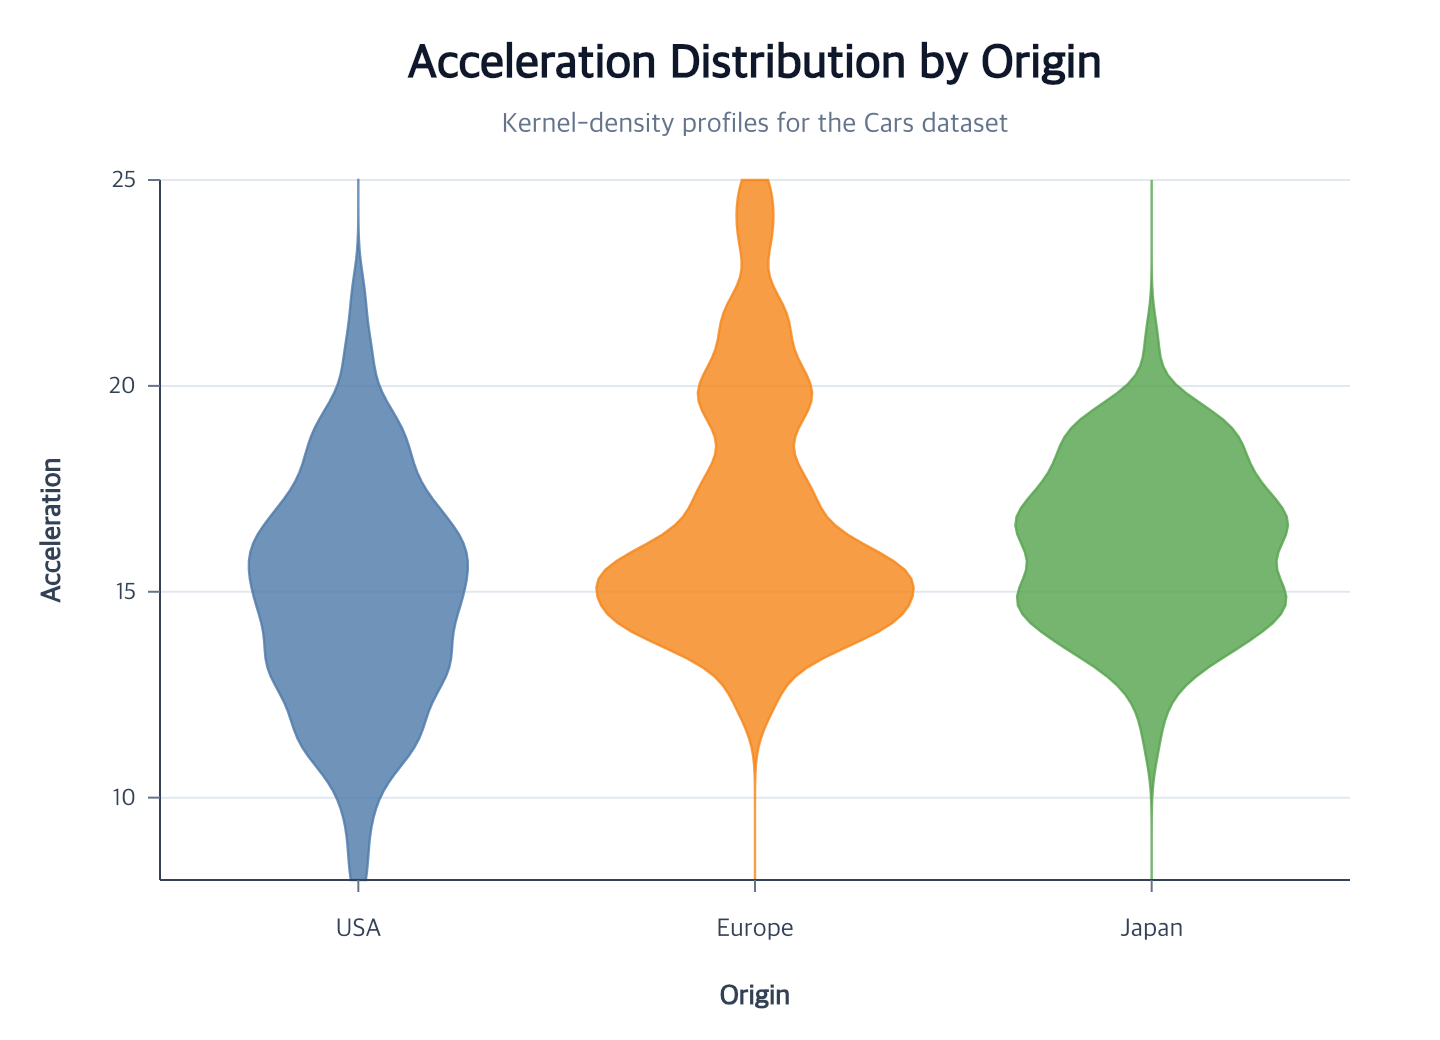
Compare complete distribution shapes across categories with symmetric or split density areas.
createViolinPlot
editDensity
View full size
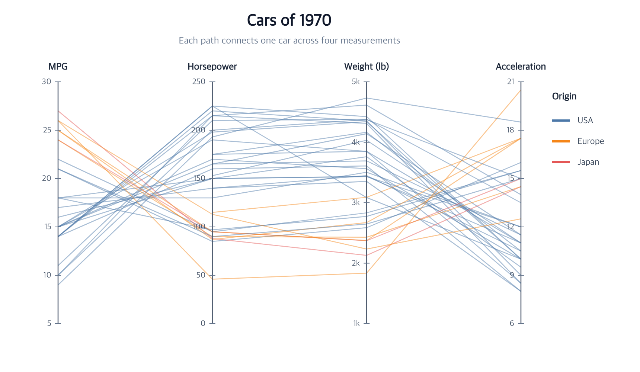
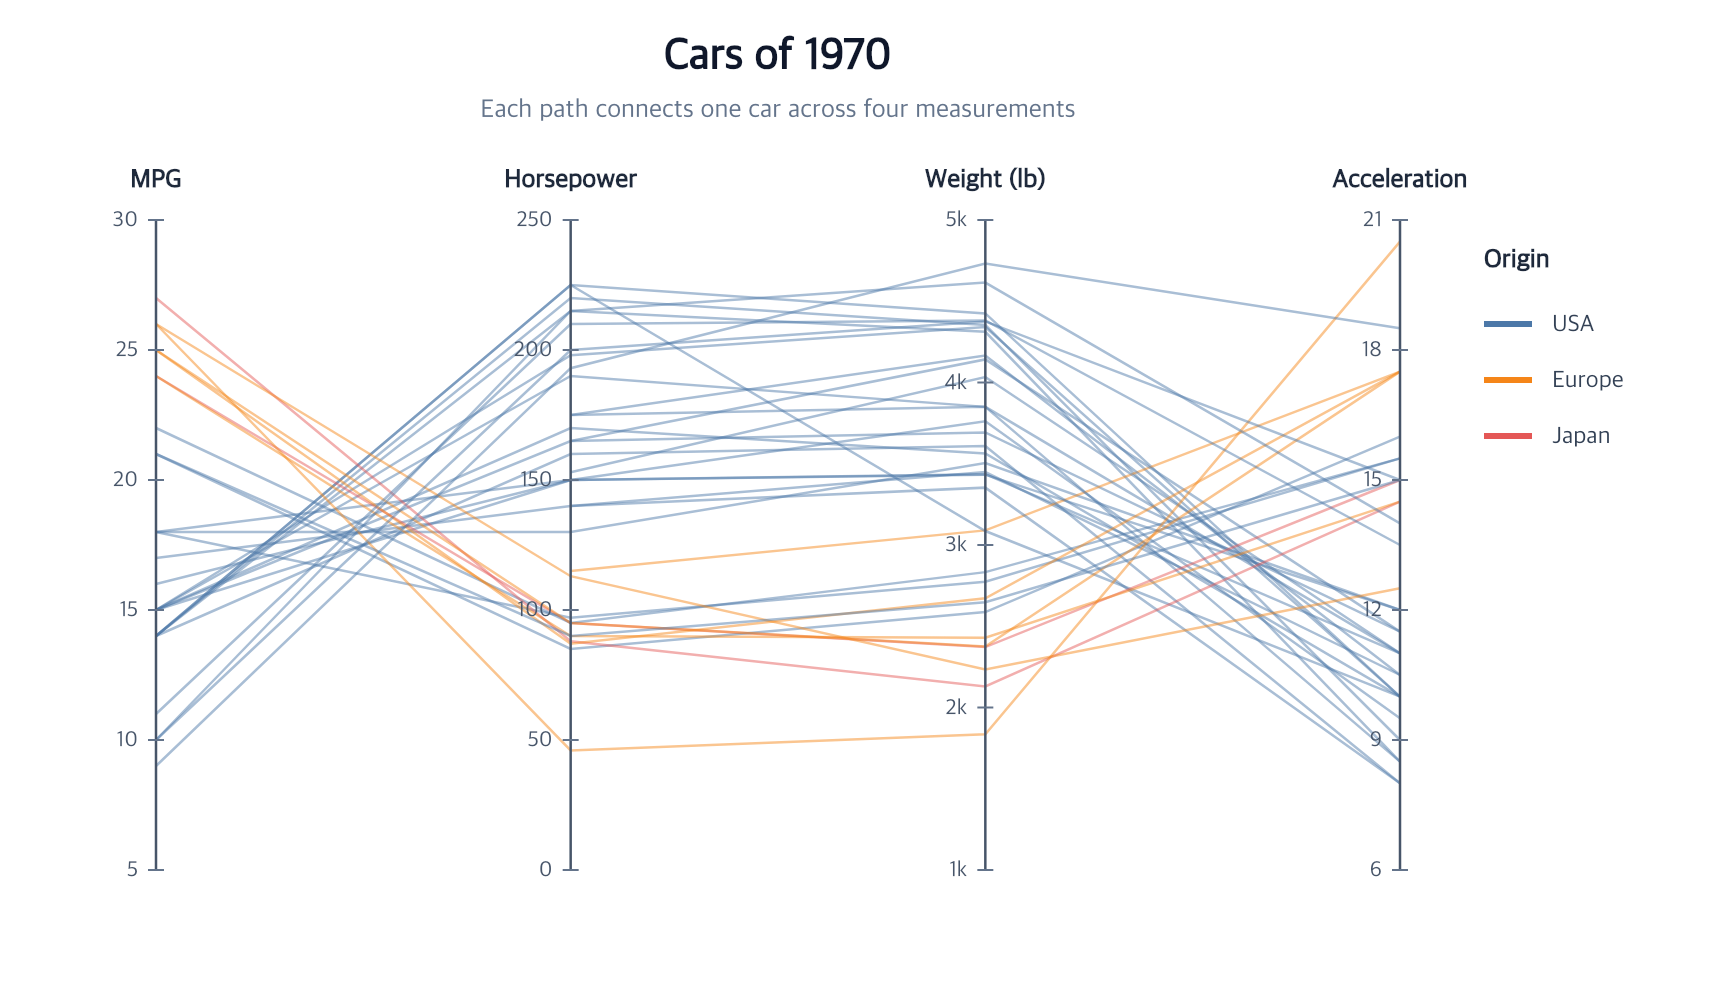
Compare multivariate row profiles while retaining row-level identity.
createParallelCoordinates
encodeParallelCoordinates
View full size
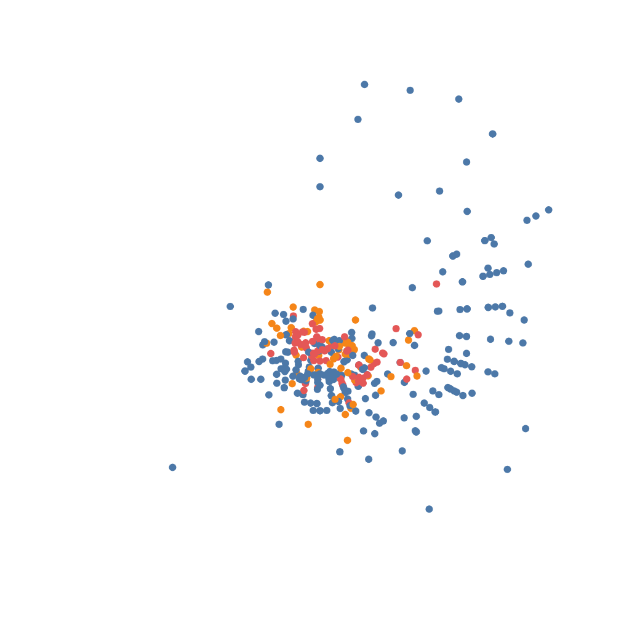
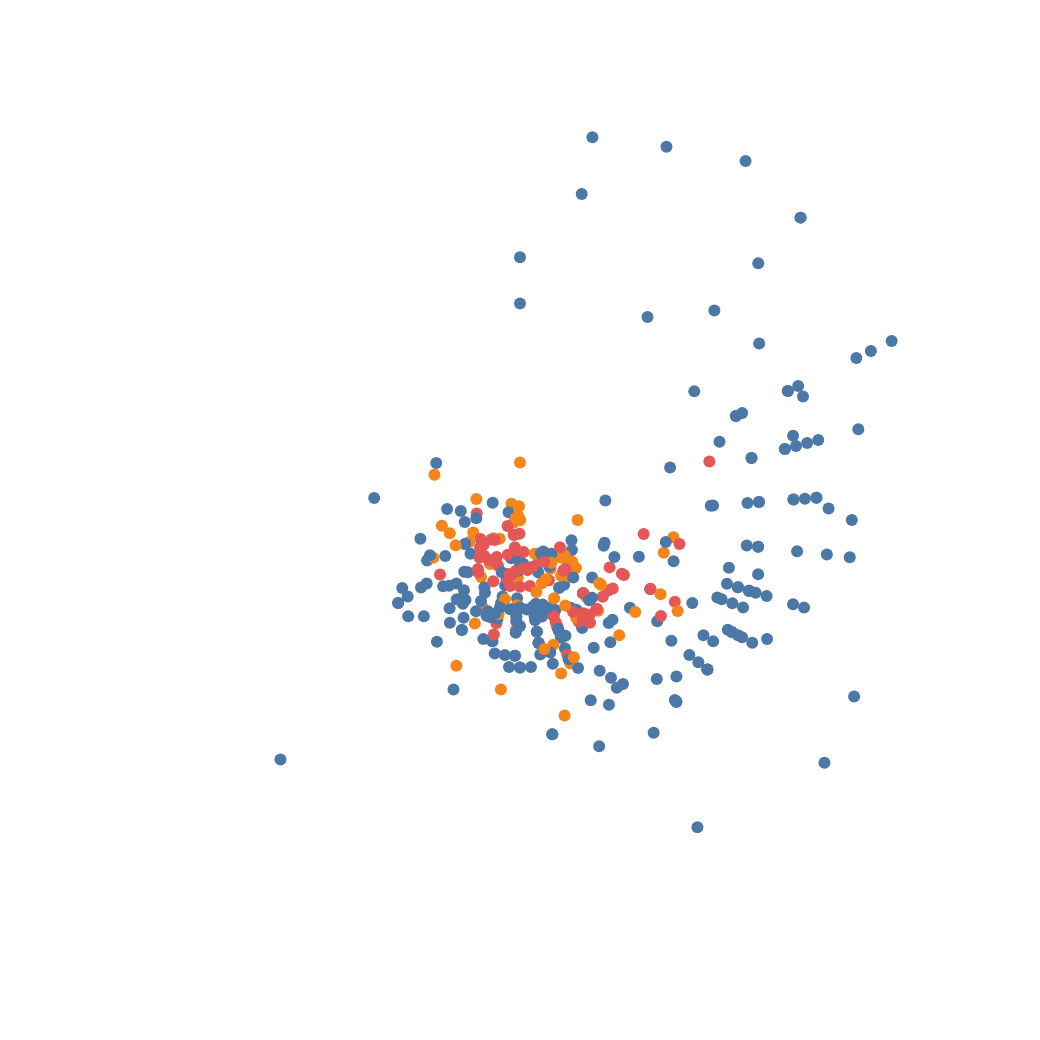
Map quantitative fields to clockwise angle and radial distance.
encodeTheta
encodeR
encodePointRadius
View full size
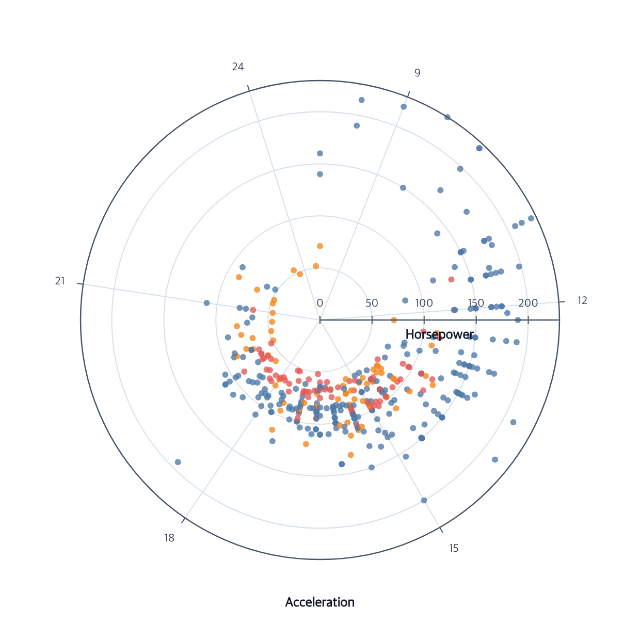
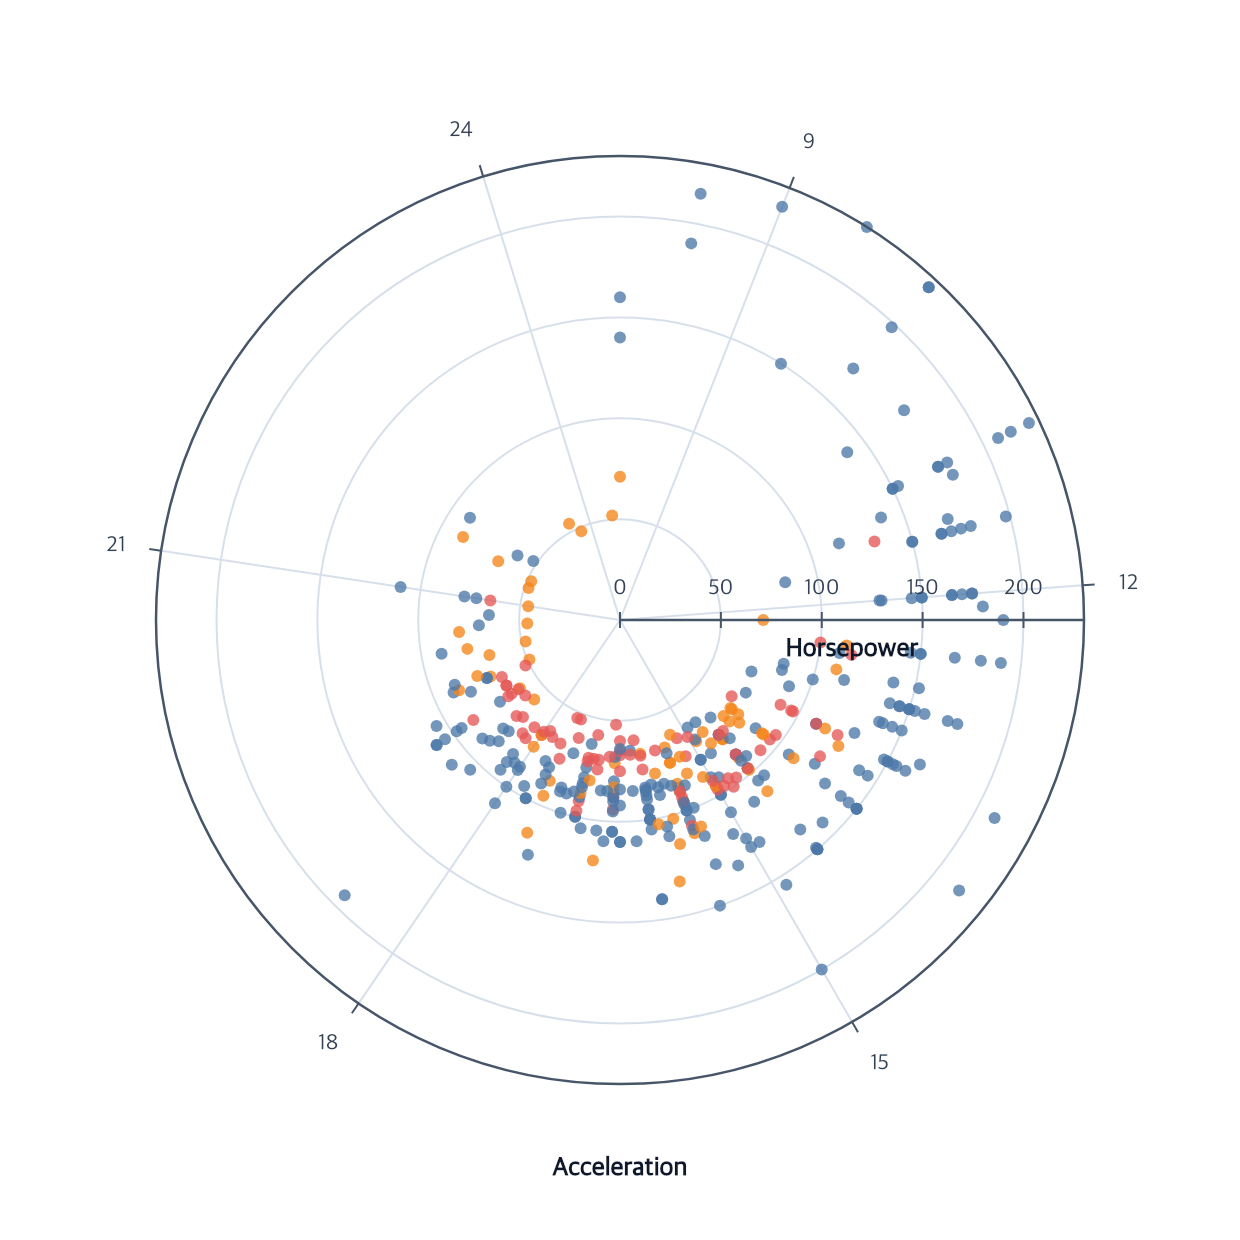
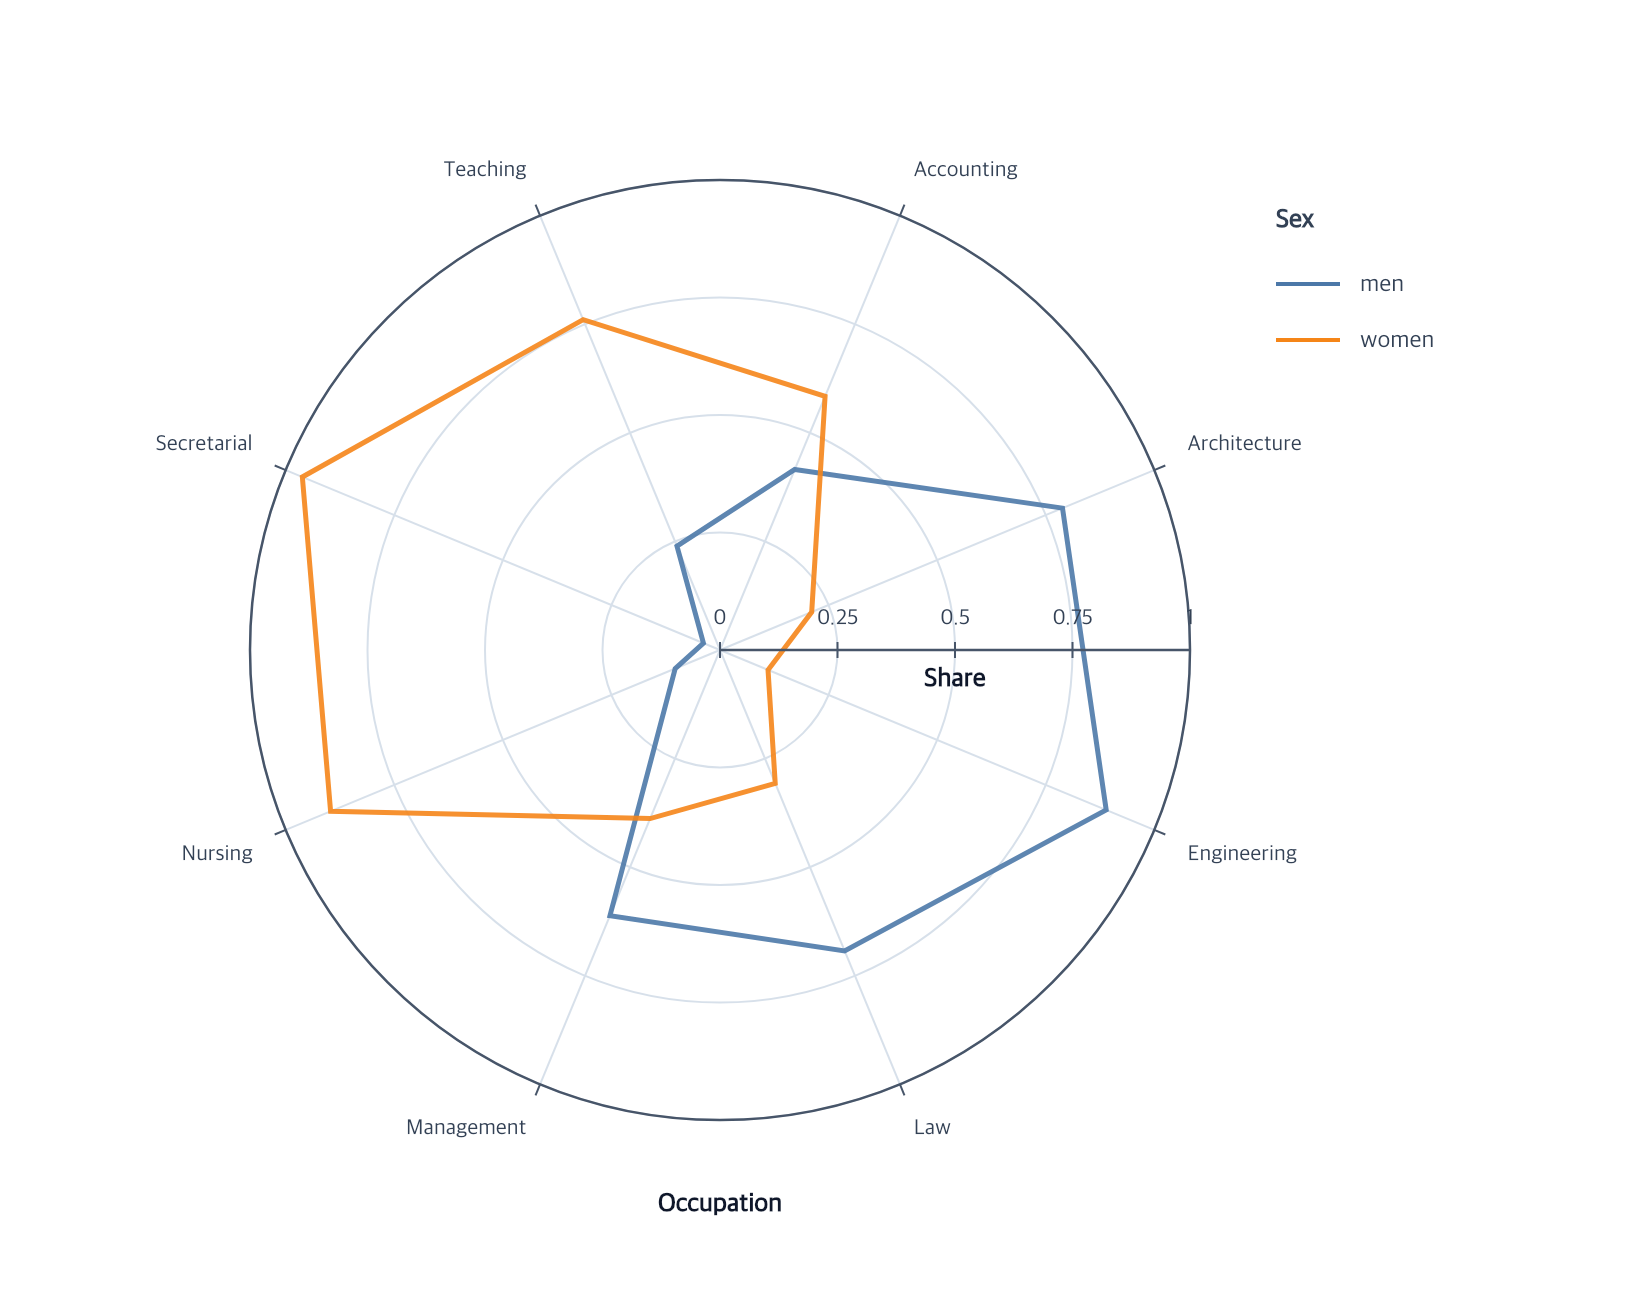
Read angle and radial mappings with aligned axes, labels, and grids.
createGuides
editRadialAxis
View full size
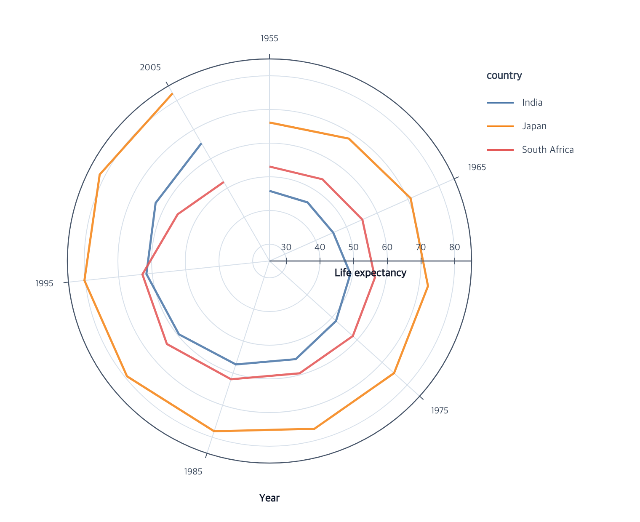
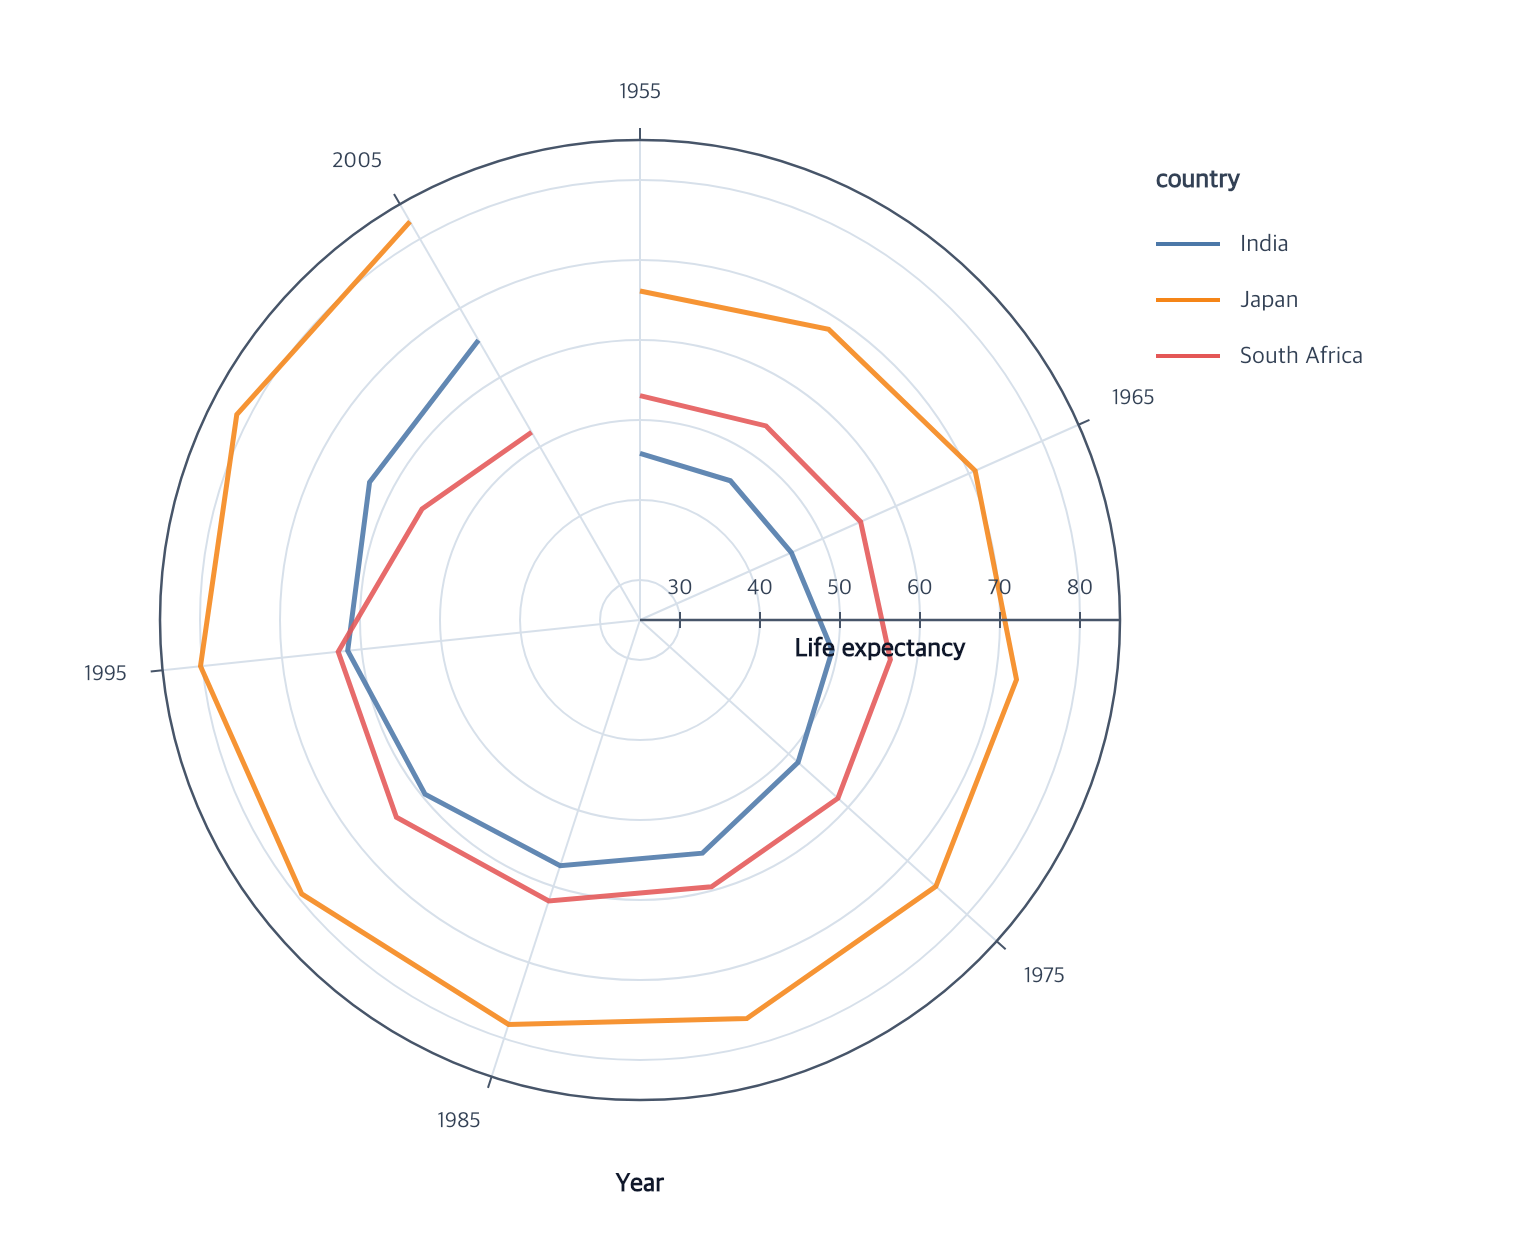
Connect ordered angle and radial values as grouped open paths.
createLineMark
encodeTheta
encodeR
View full size
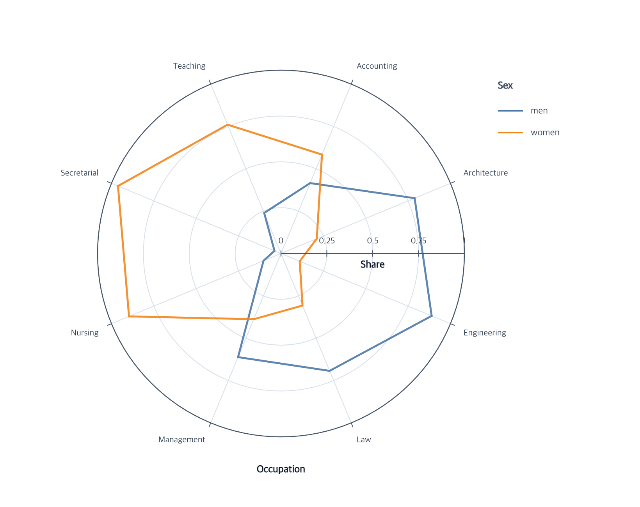
Close nominal-angle series without duplicating the first observation.
createLineMark
View full size
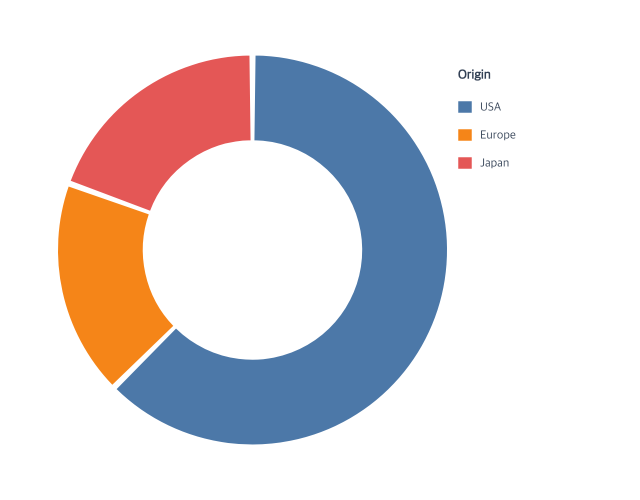
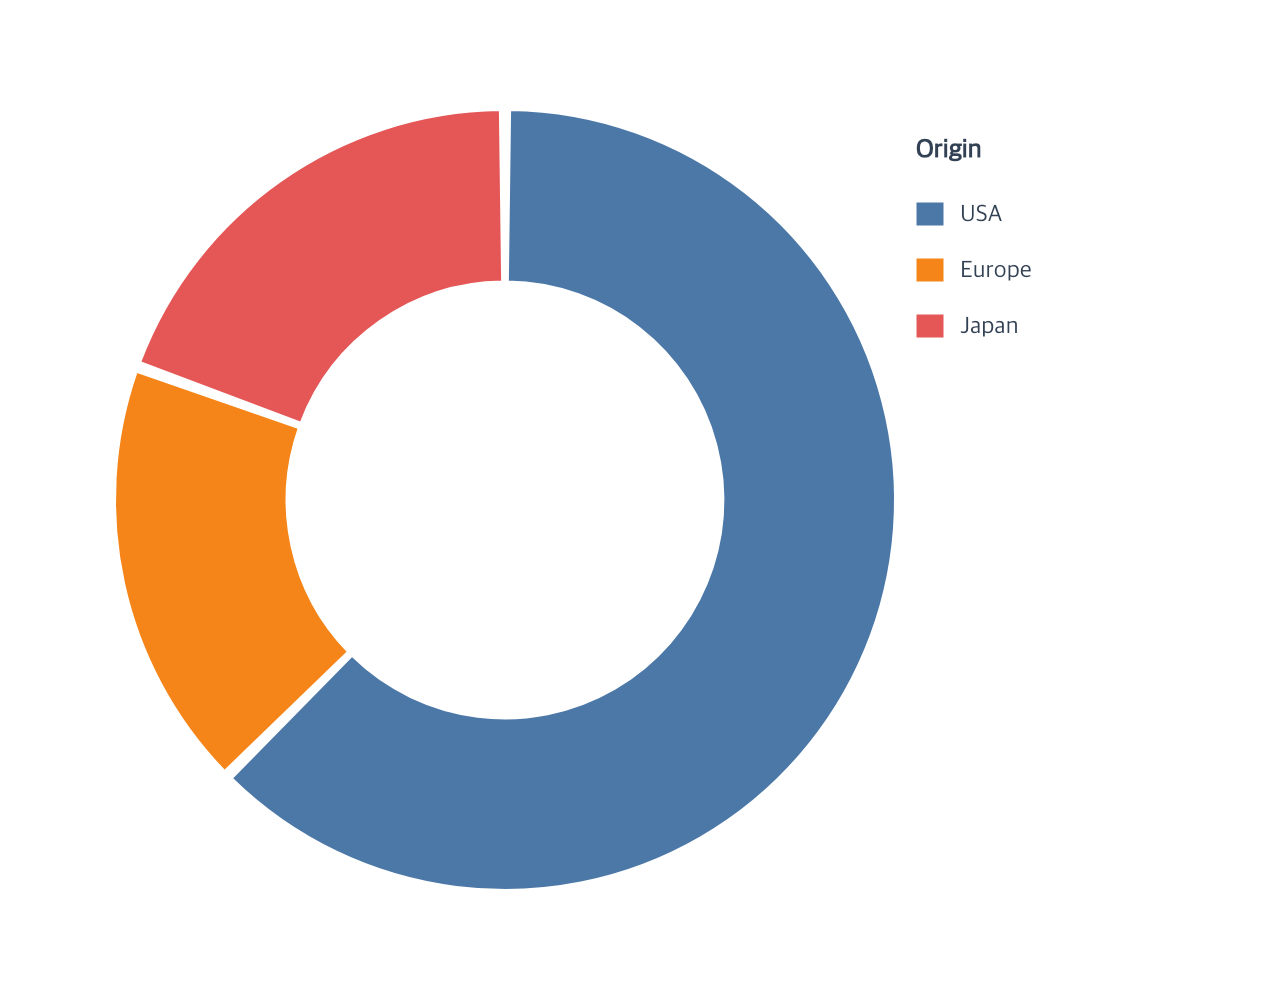
Build proportional sectors with an inferred categorical color legend.
createArcMark
encodeTheta
encodeColor
View full size
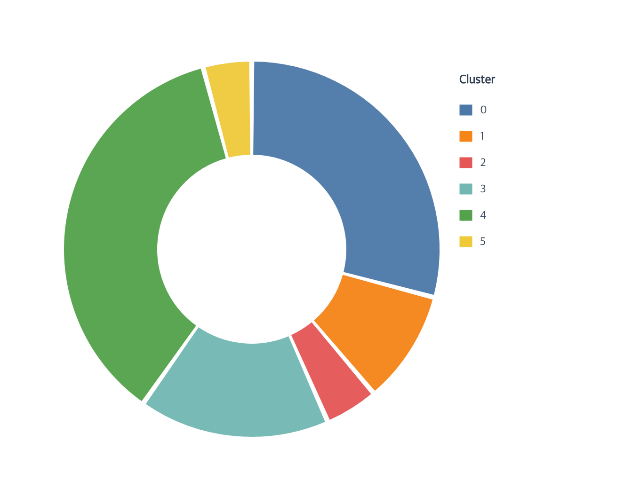
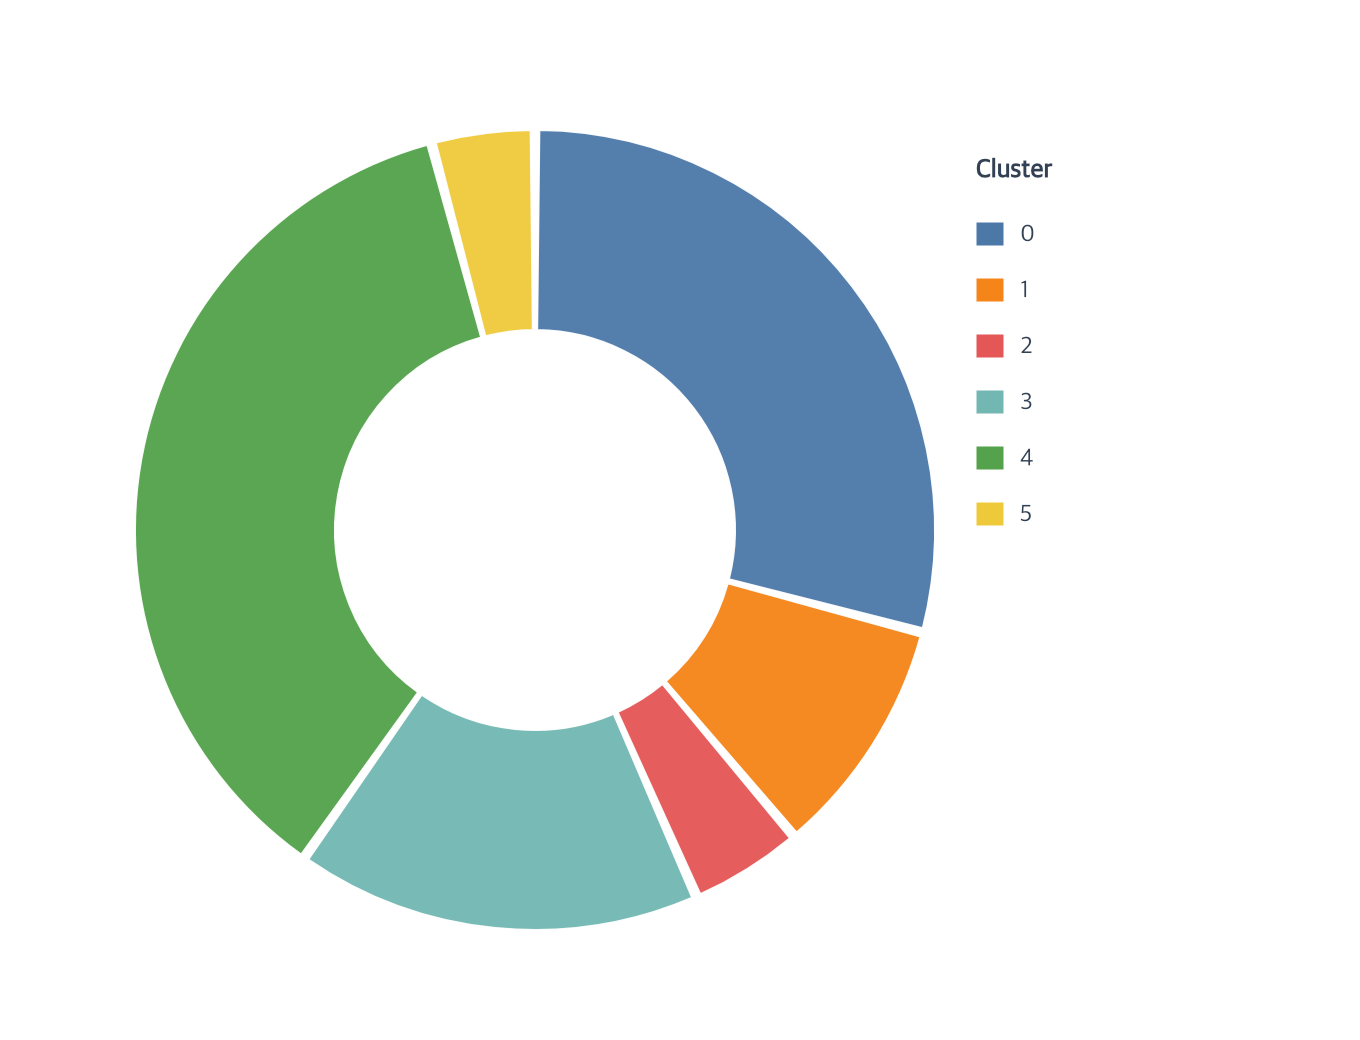
Partition a full revolution by category-level sums without expanding rows.
createArcMark
encodeTheta
encodeColor
View full size
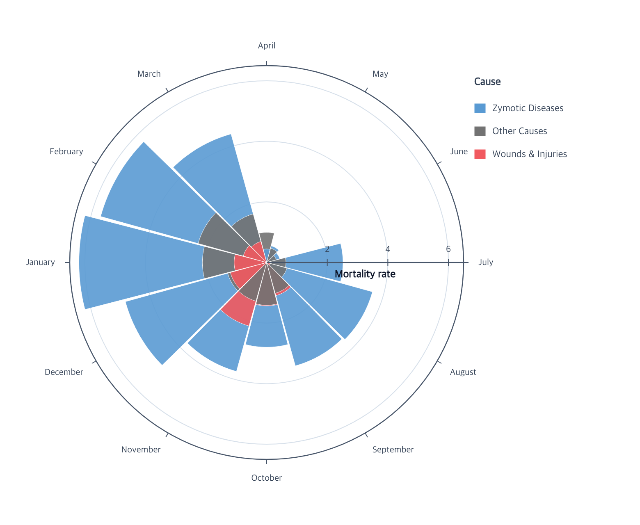
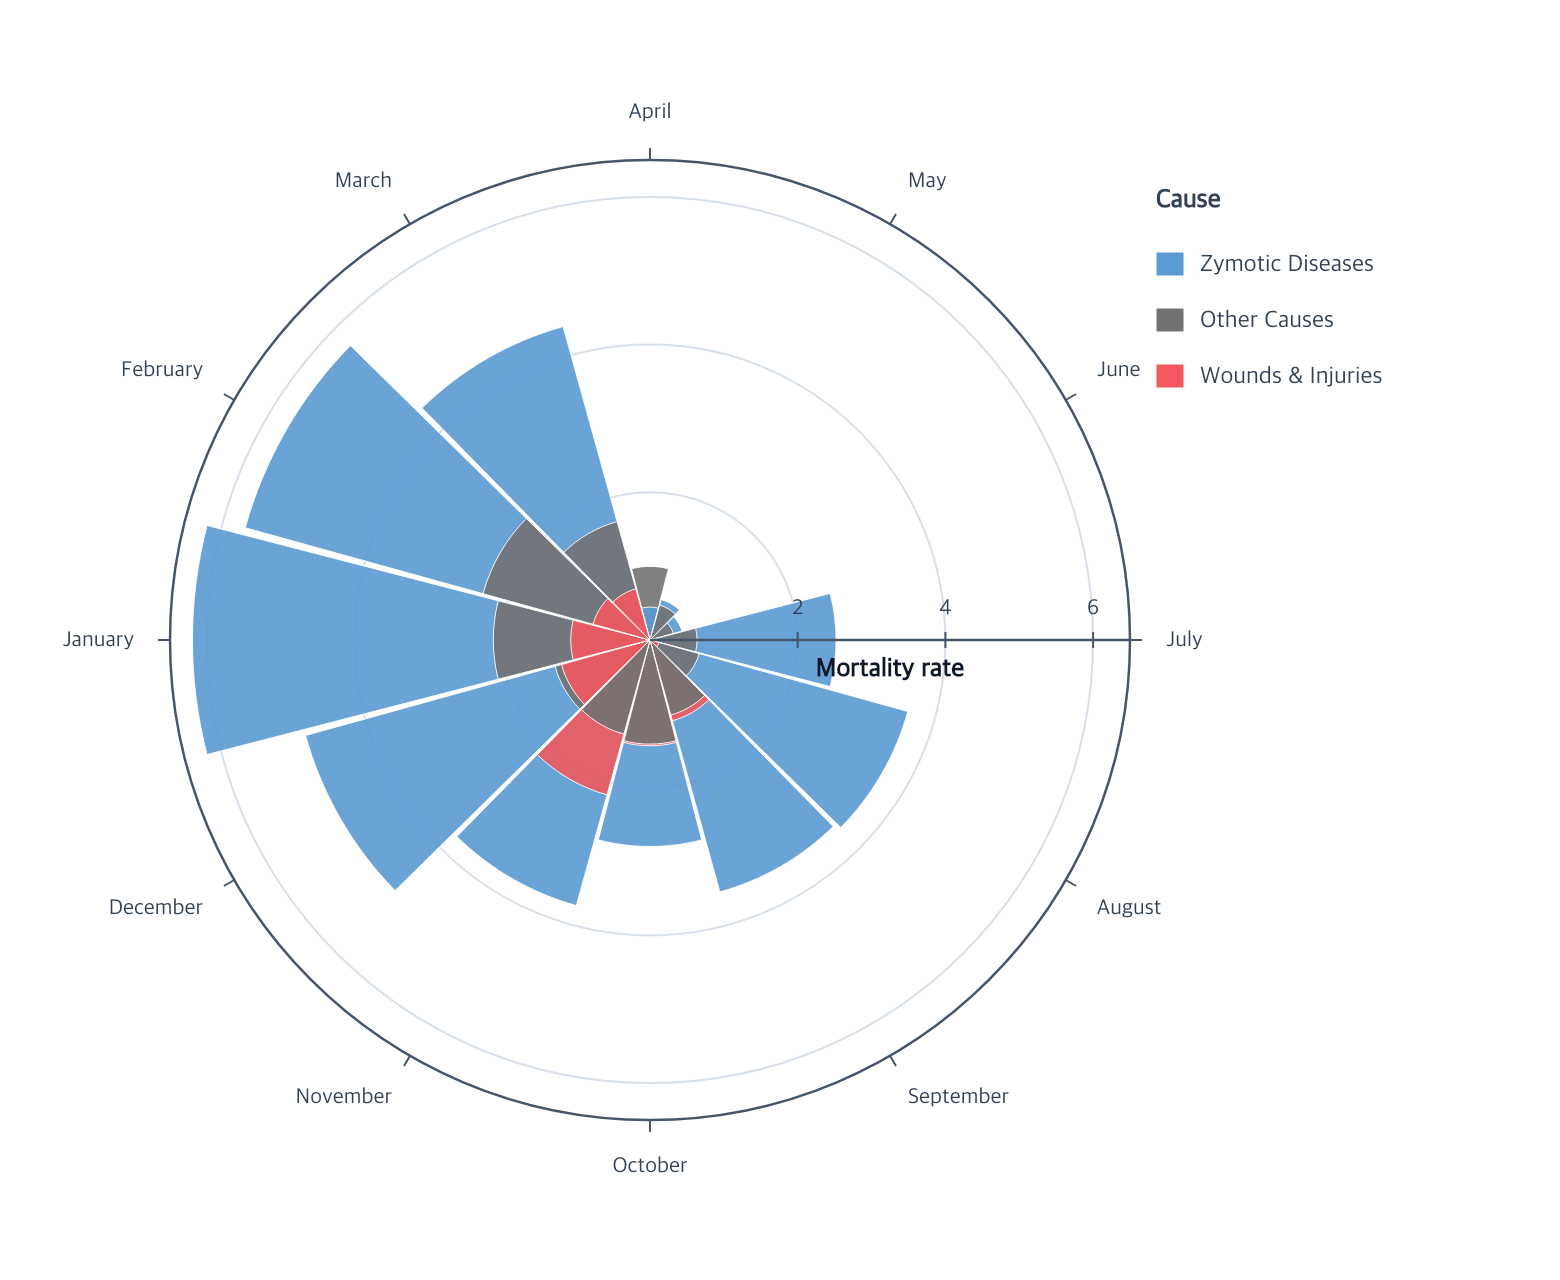
Compare radial magnitudes inside ordered categorical sectors.
createArcMark
encodeTheta
encodeR
View full size
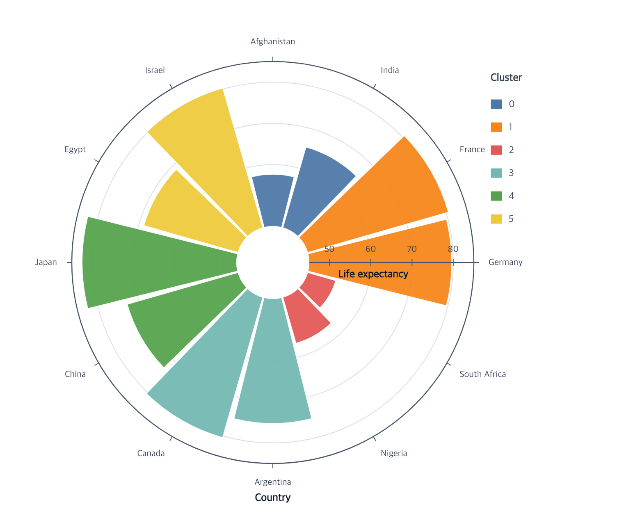
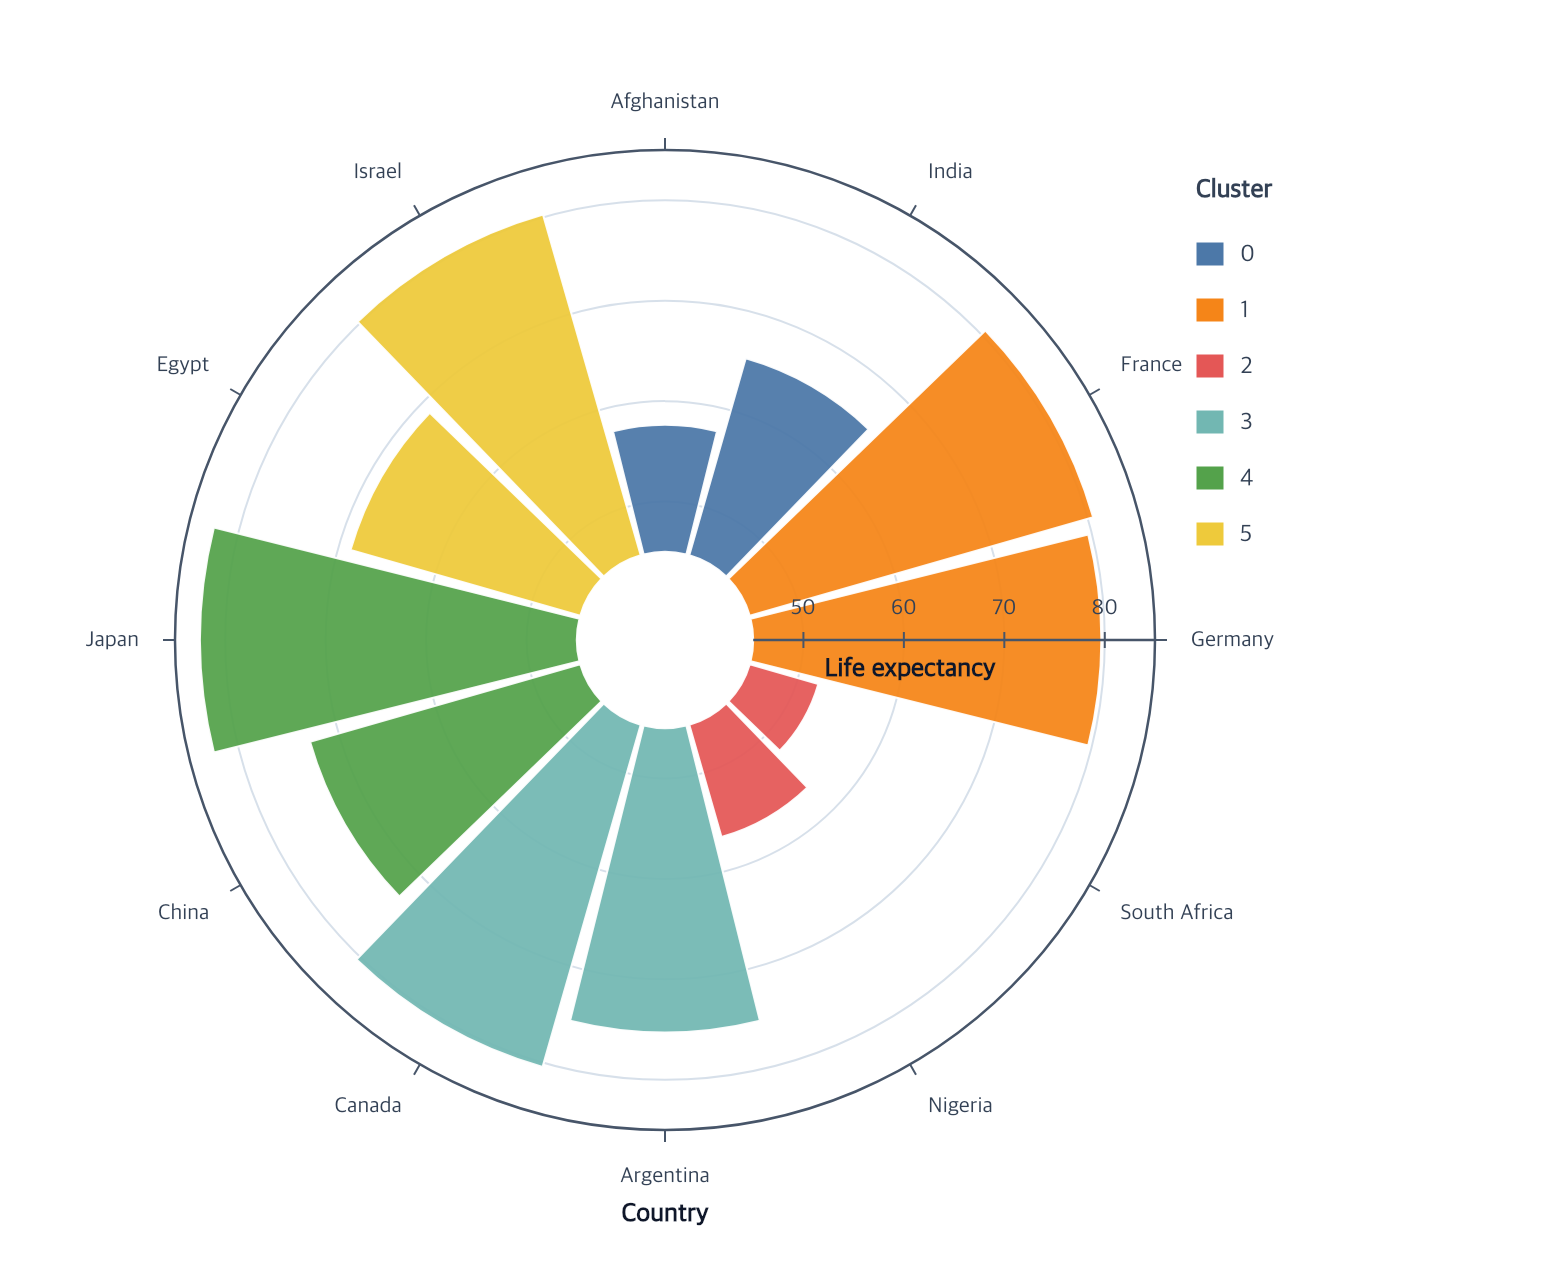
Compare values as equal-width sectors around a Polar coordinate.
createArcMark
encodeTheta
encodeR
View full size
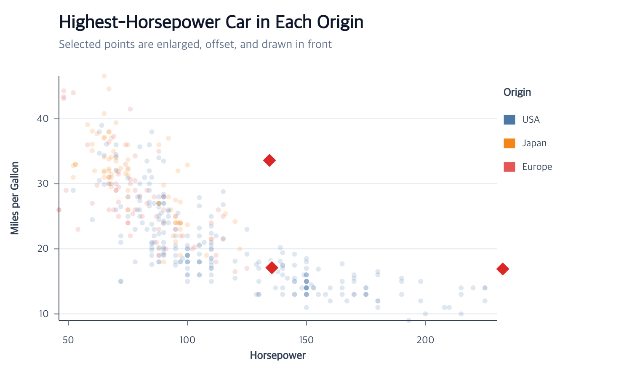
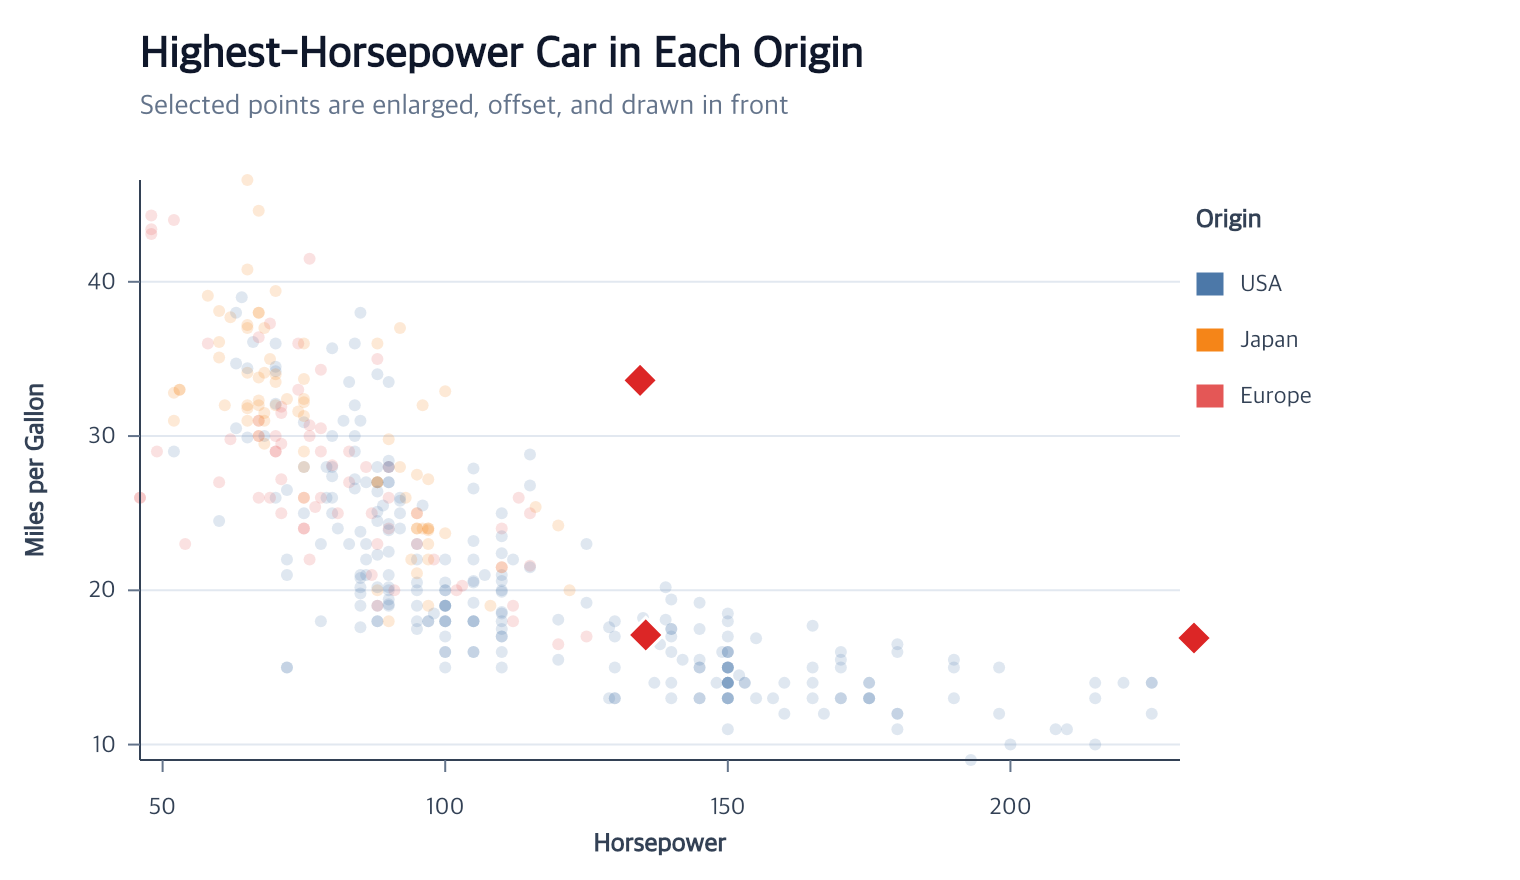
Select, filter, and emphasize final point, bar, and line items.
highlightMarks
View full size
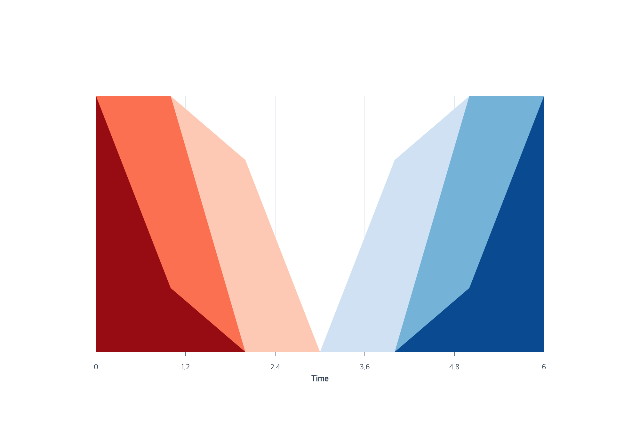
Define explicit source roles, then revise bands, baseline, palette, and appearance.
createHorizonPlot
View full size
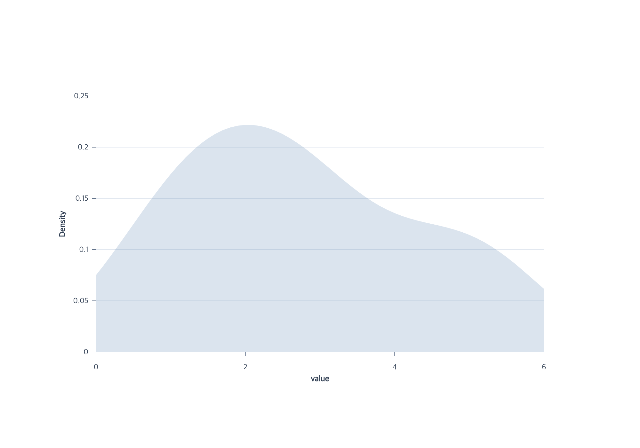
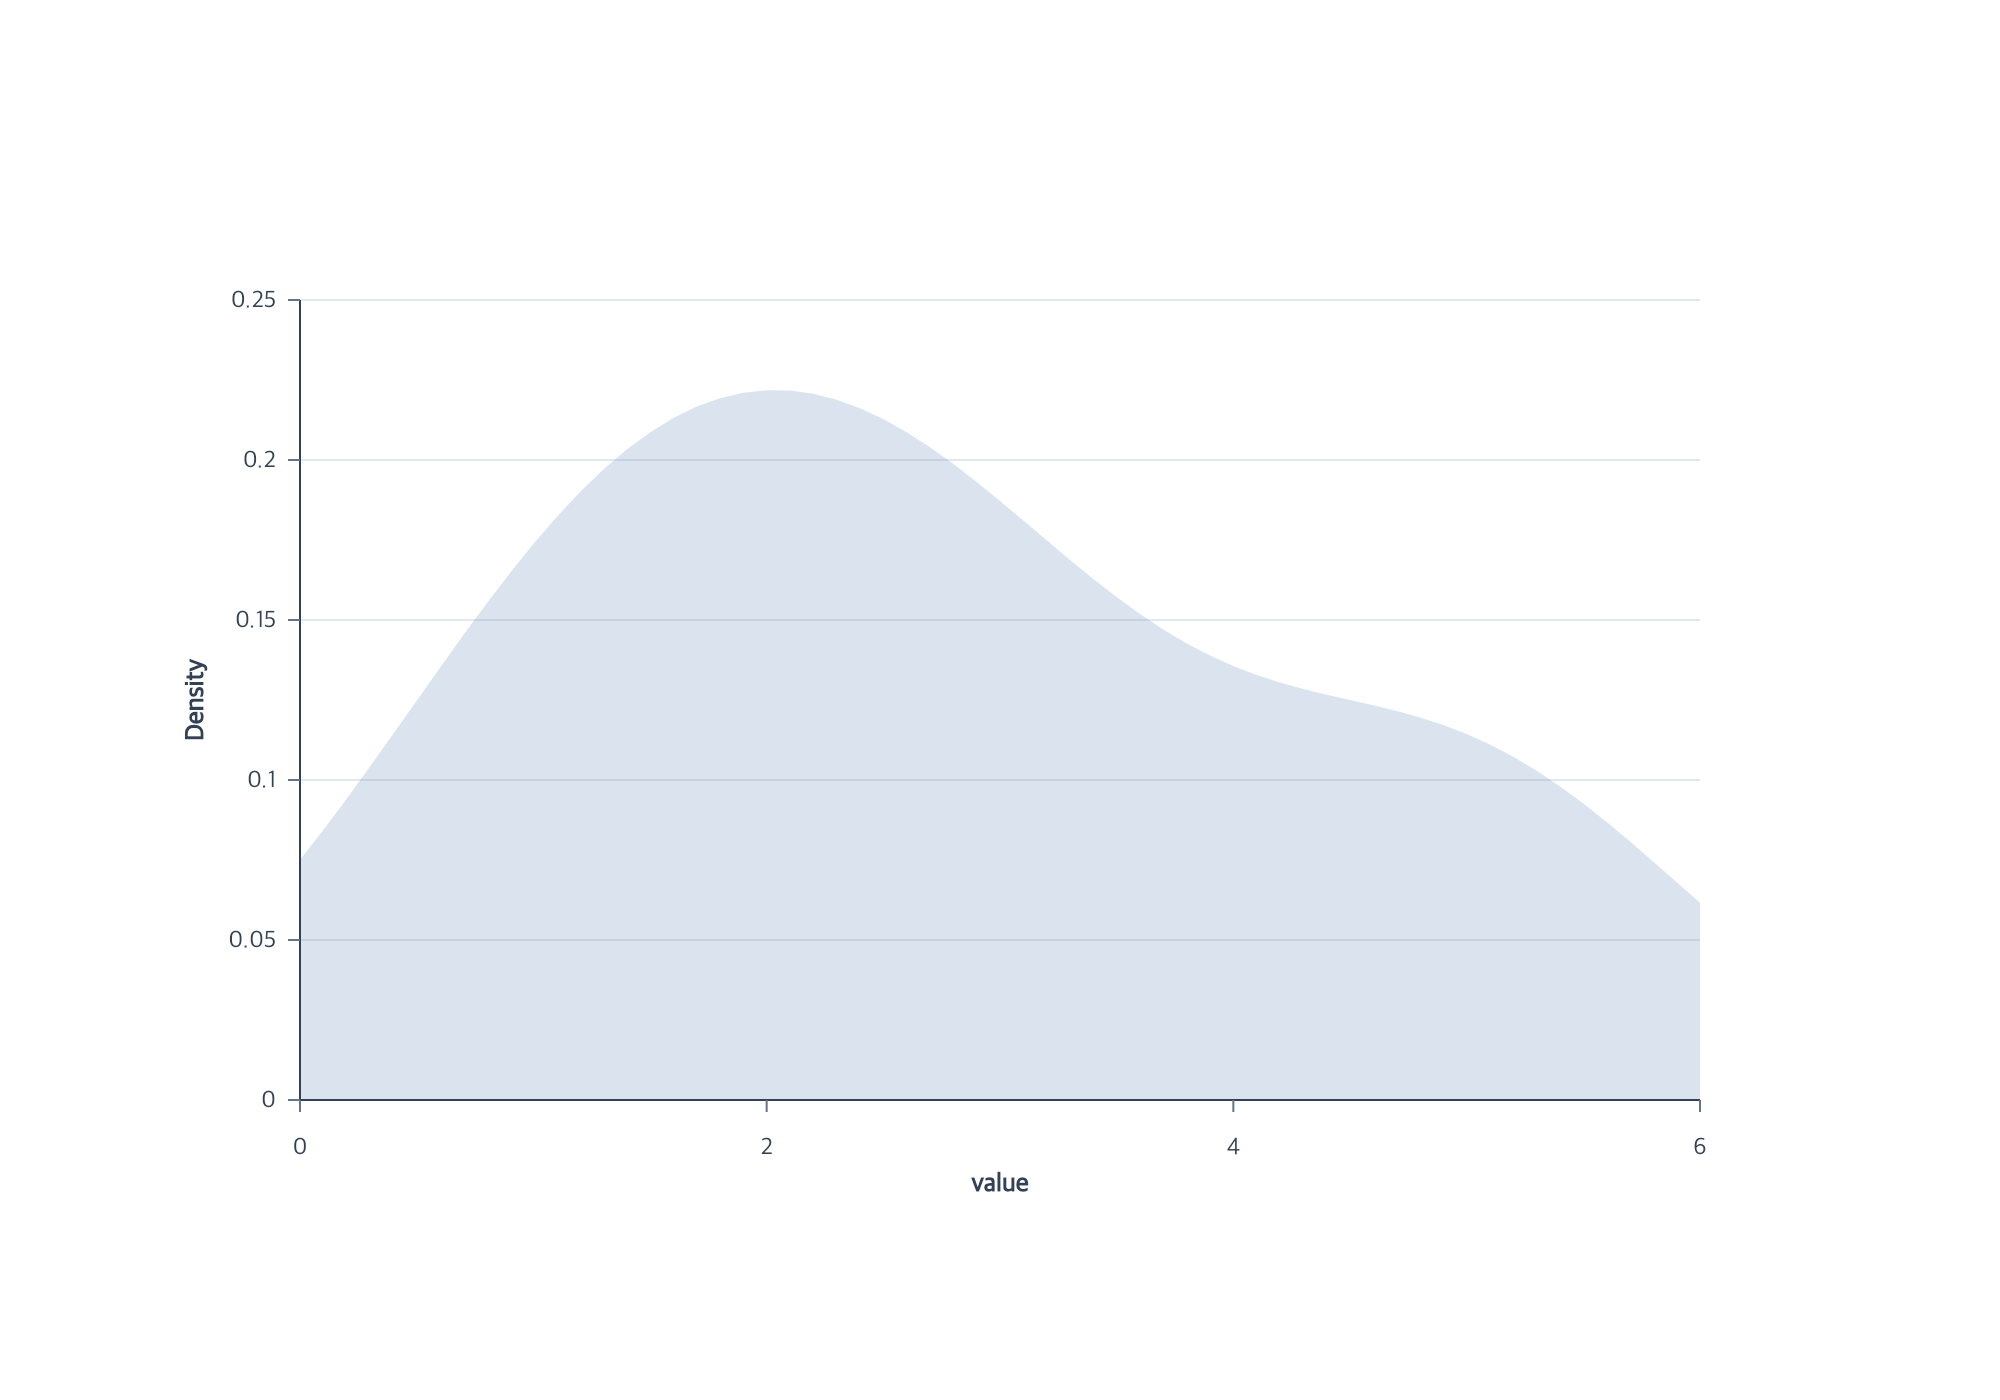
Estimate one variable, then add explicit groups and color.
createDensityPlot
View full size
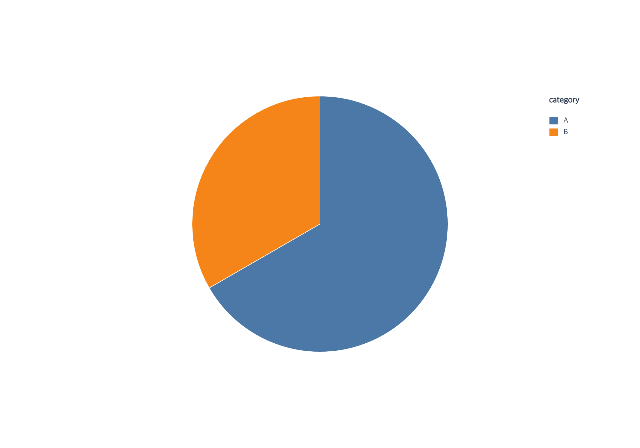
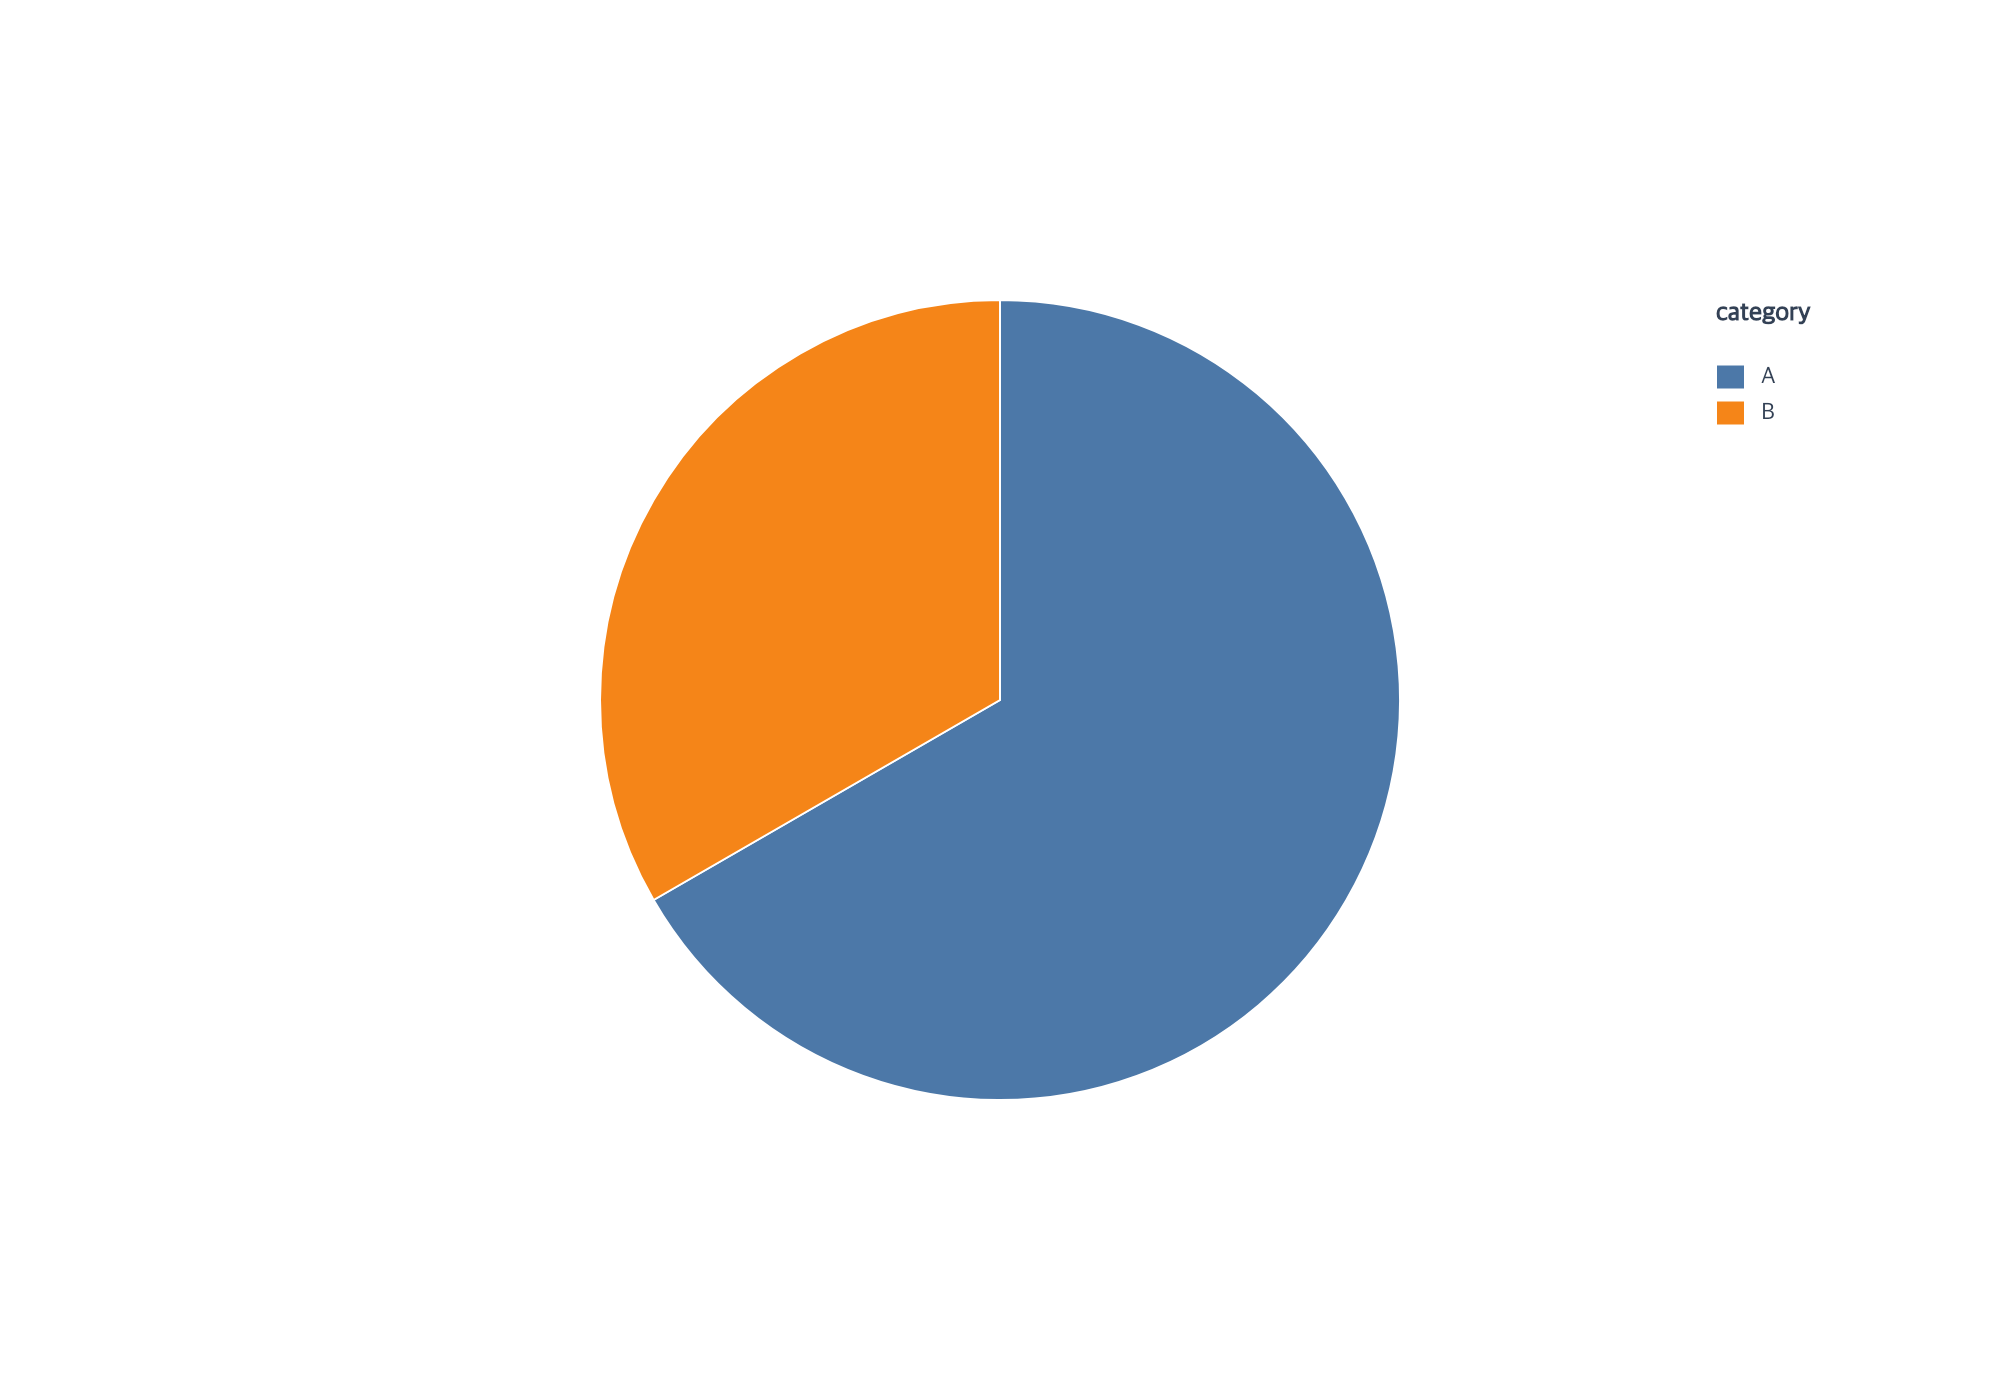
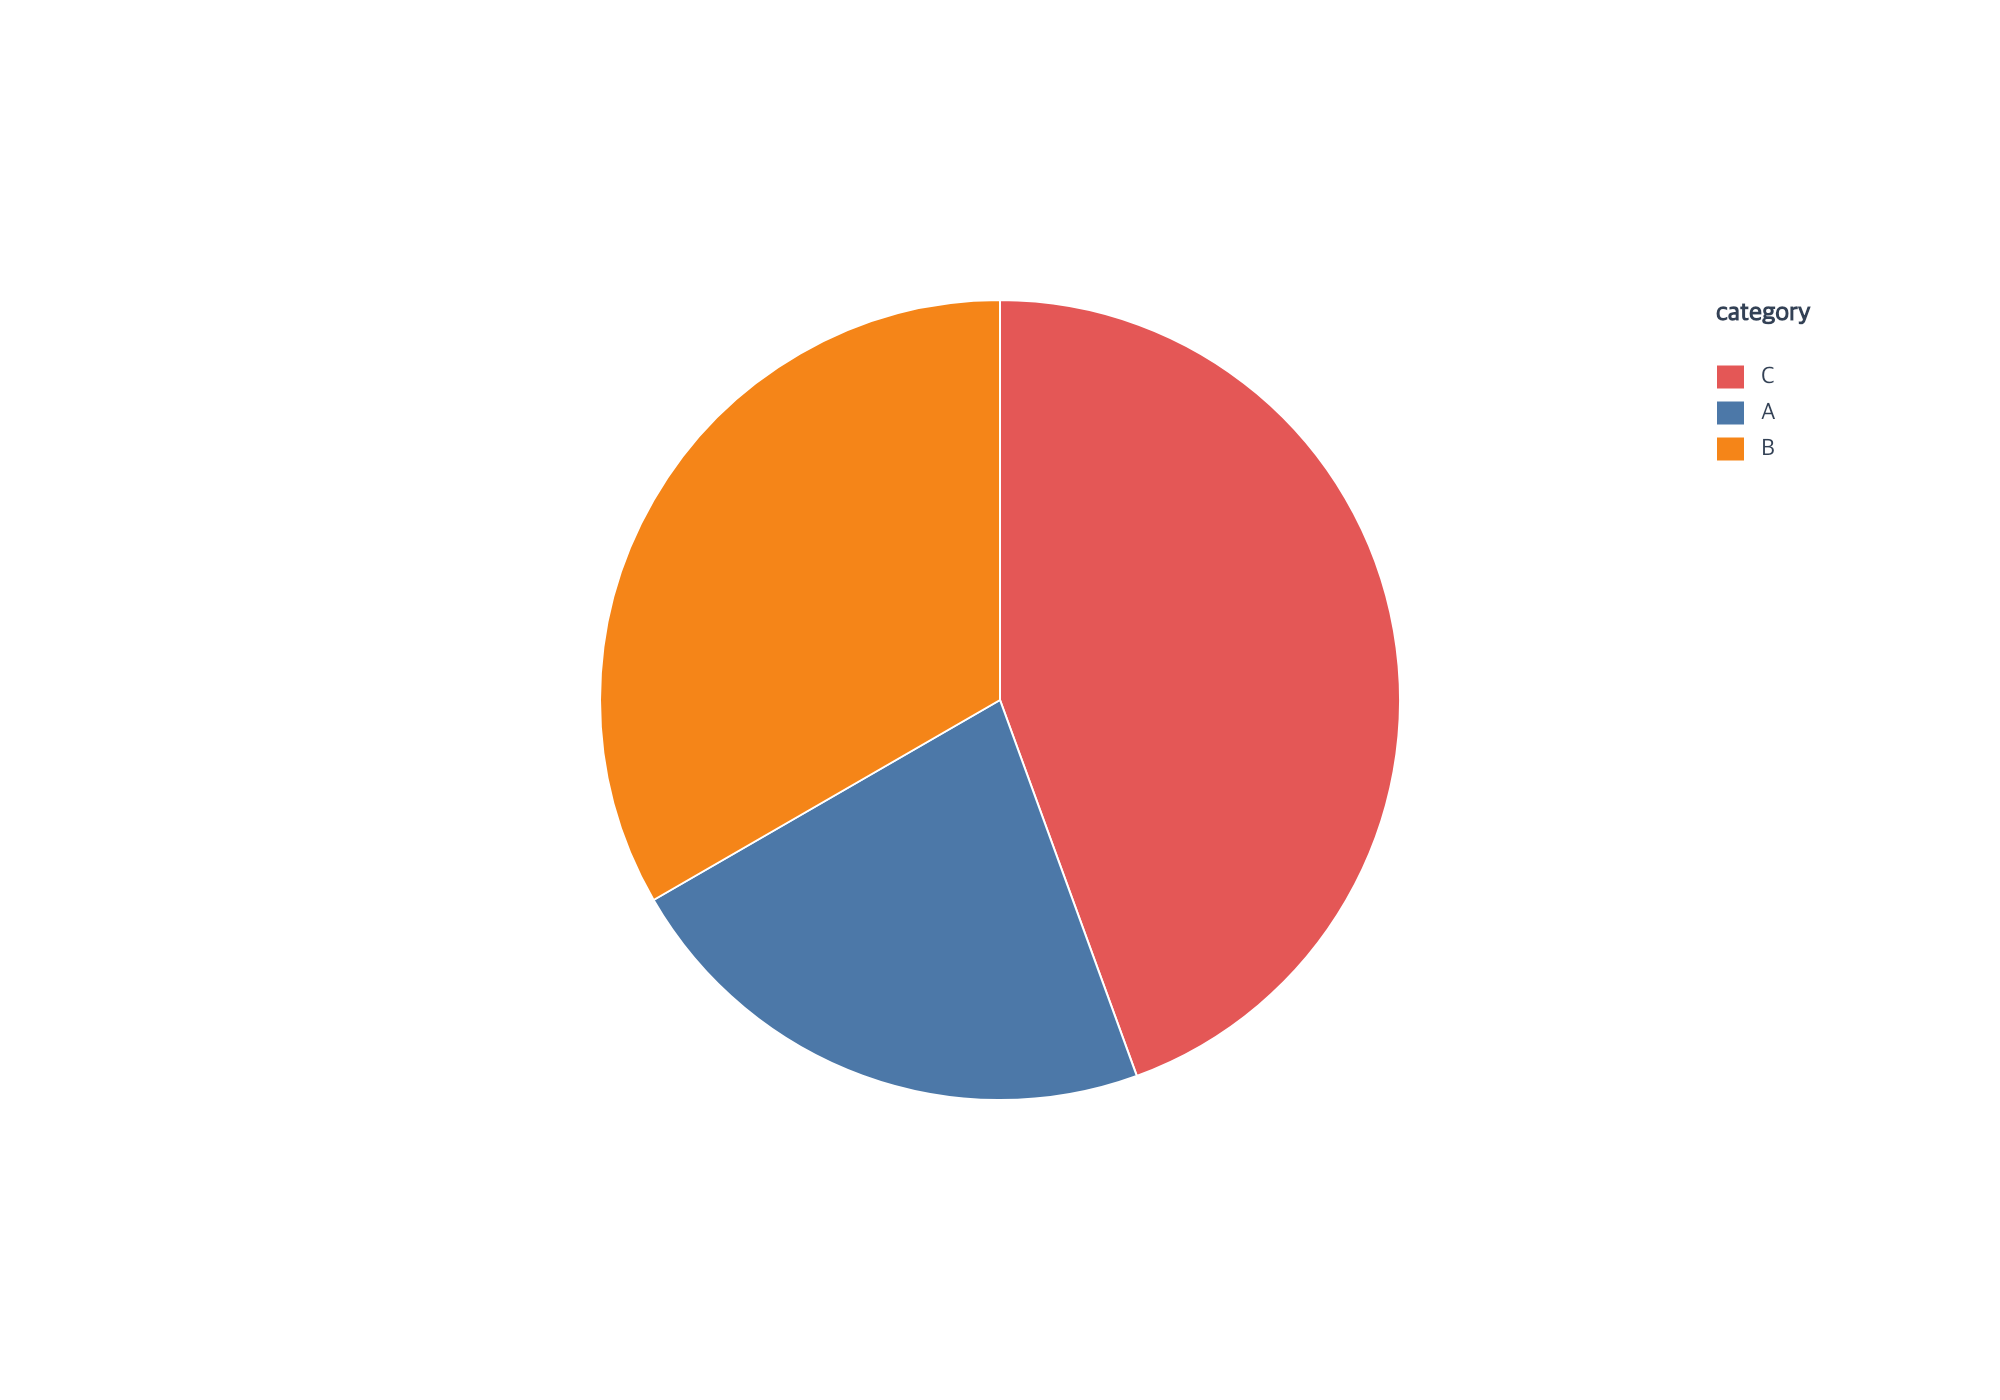
Create a complete category pie or explicitly weighted donut with one action.
createPiePlot
View full size
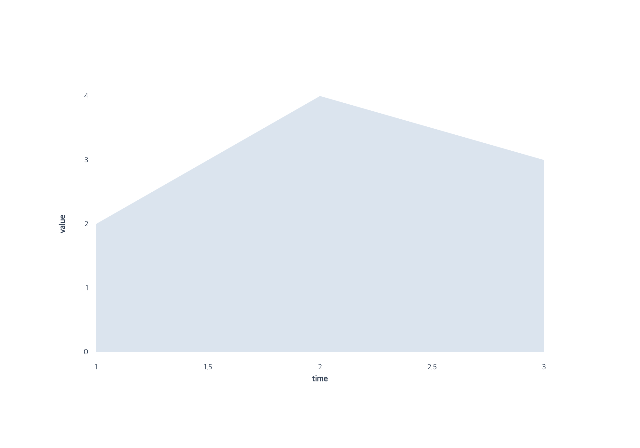
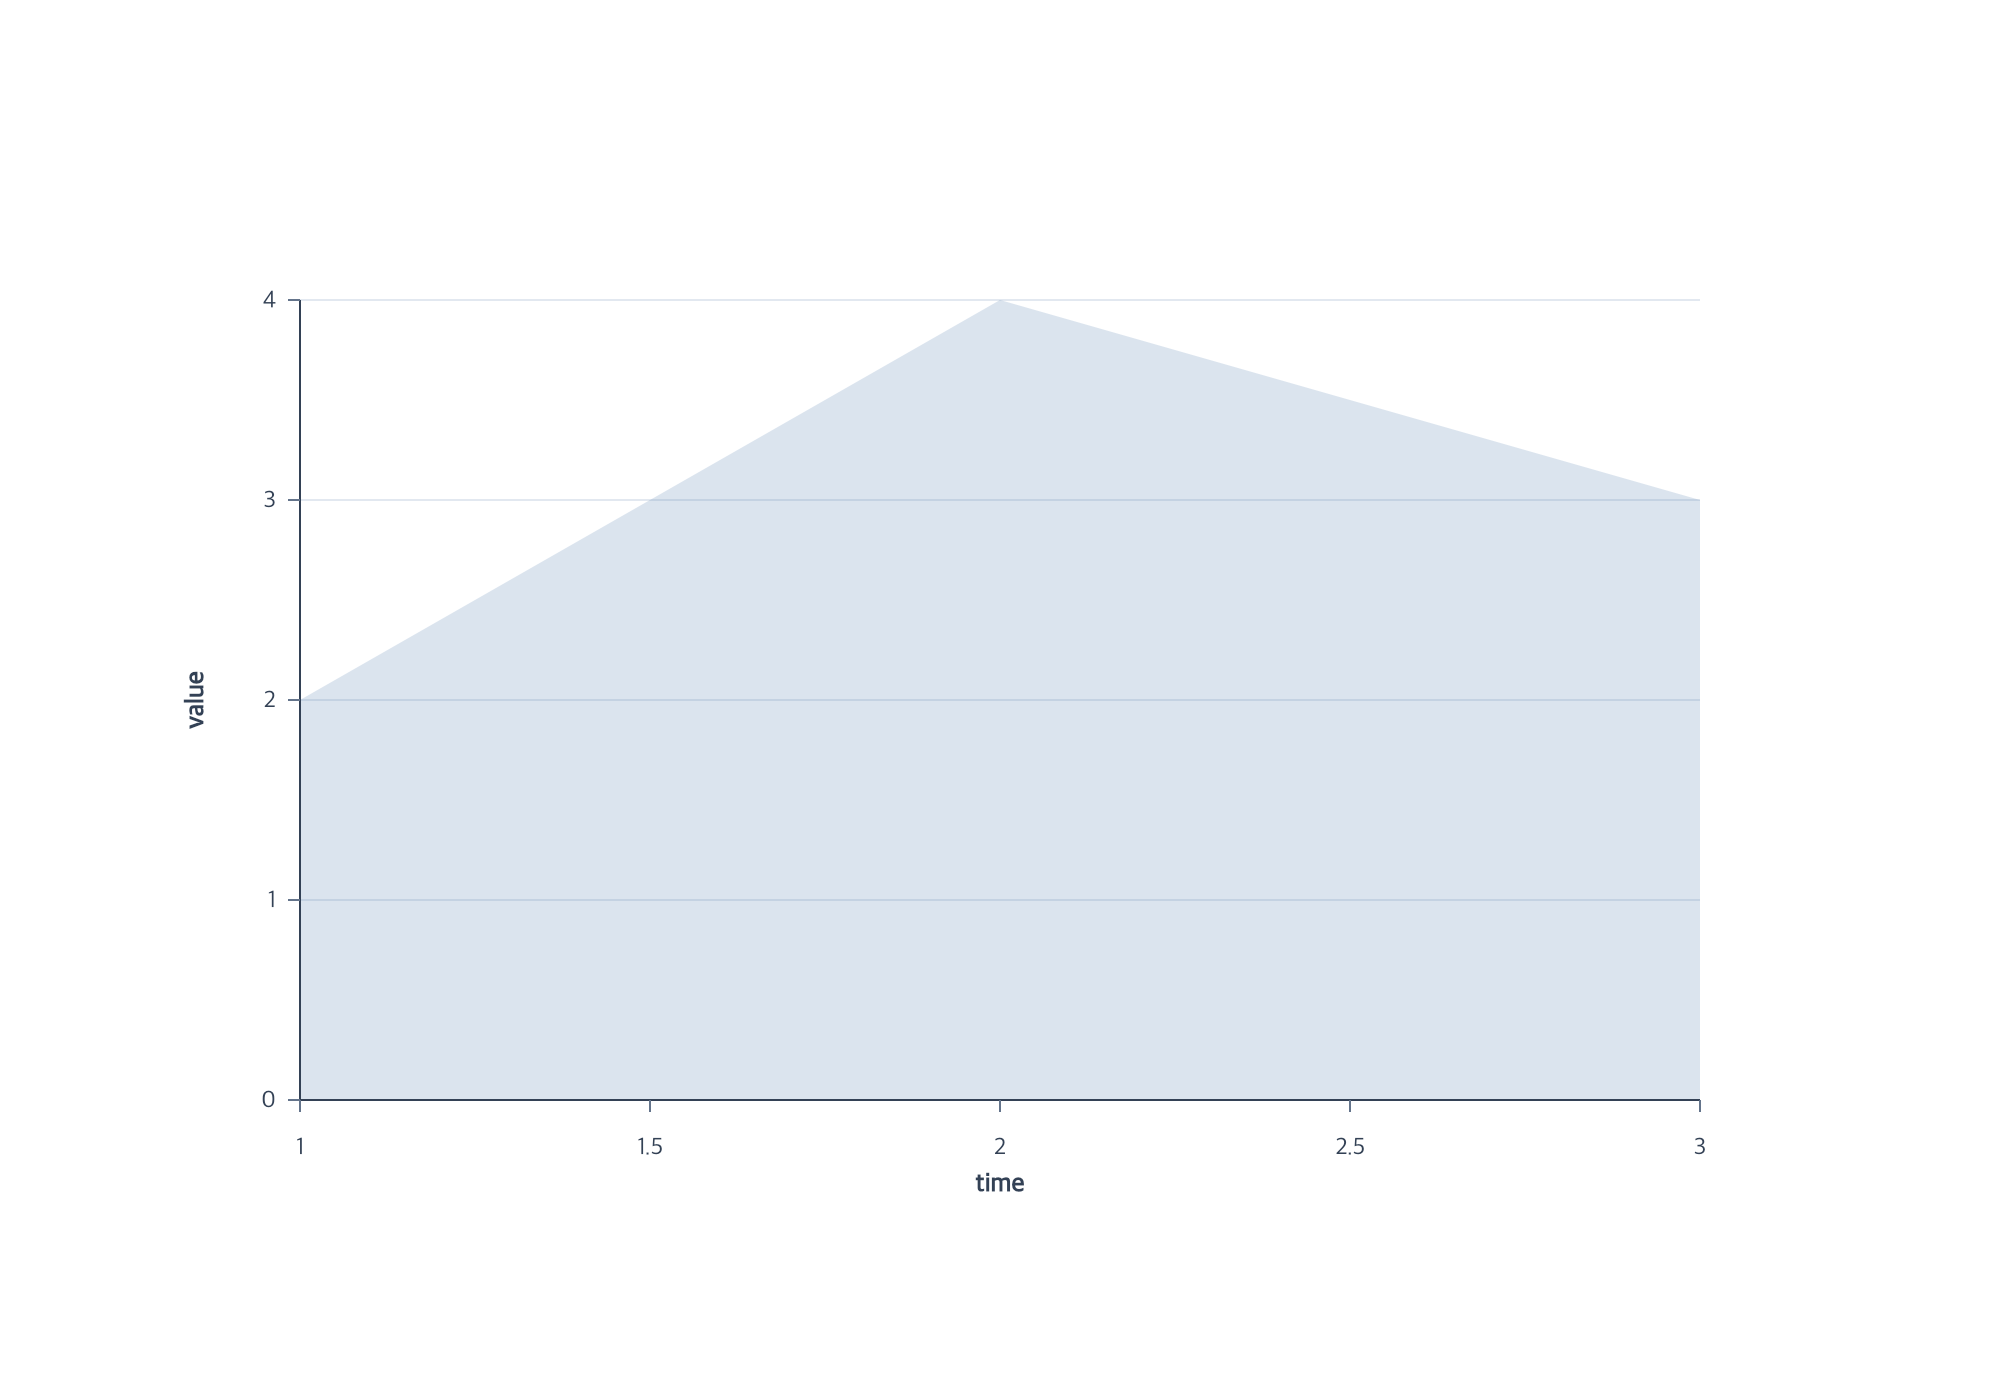
Define bounds and independently revise series identity, placement, and color.
createAreaPlot
layoutSeries
encodeGroup
View full size
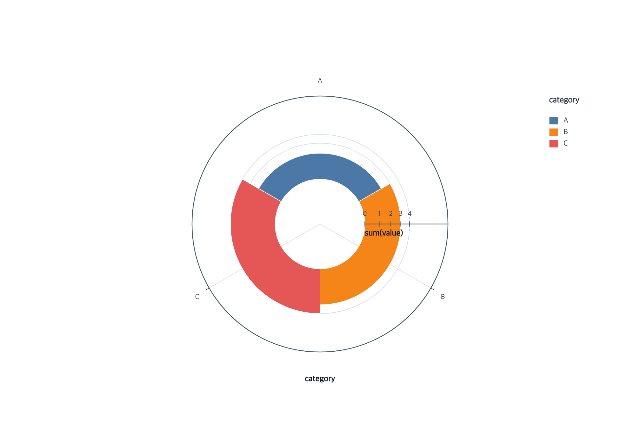
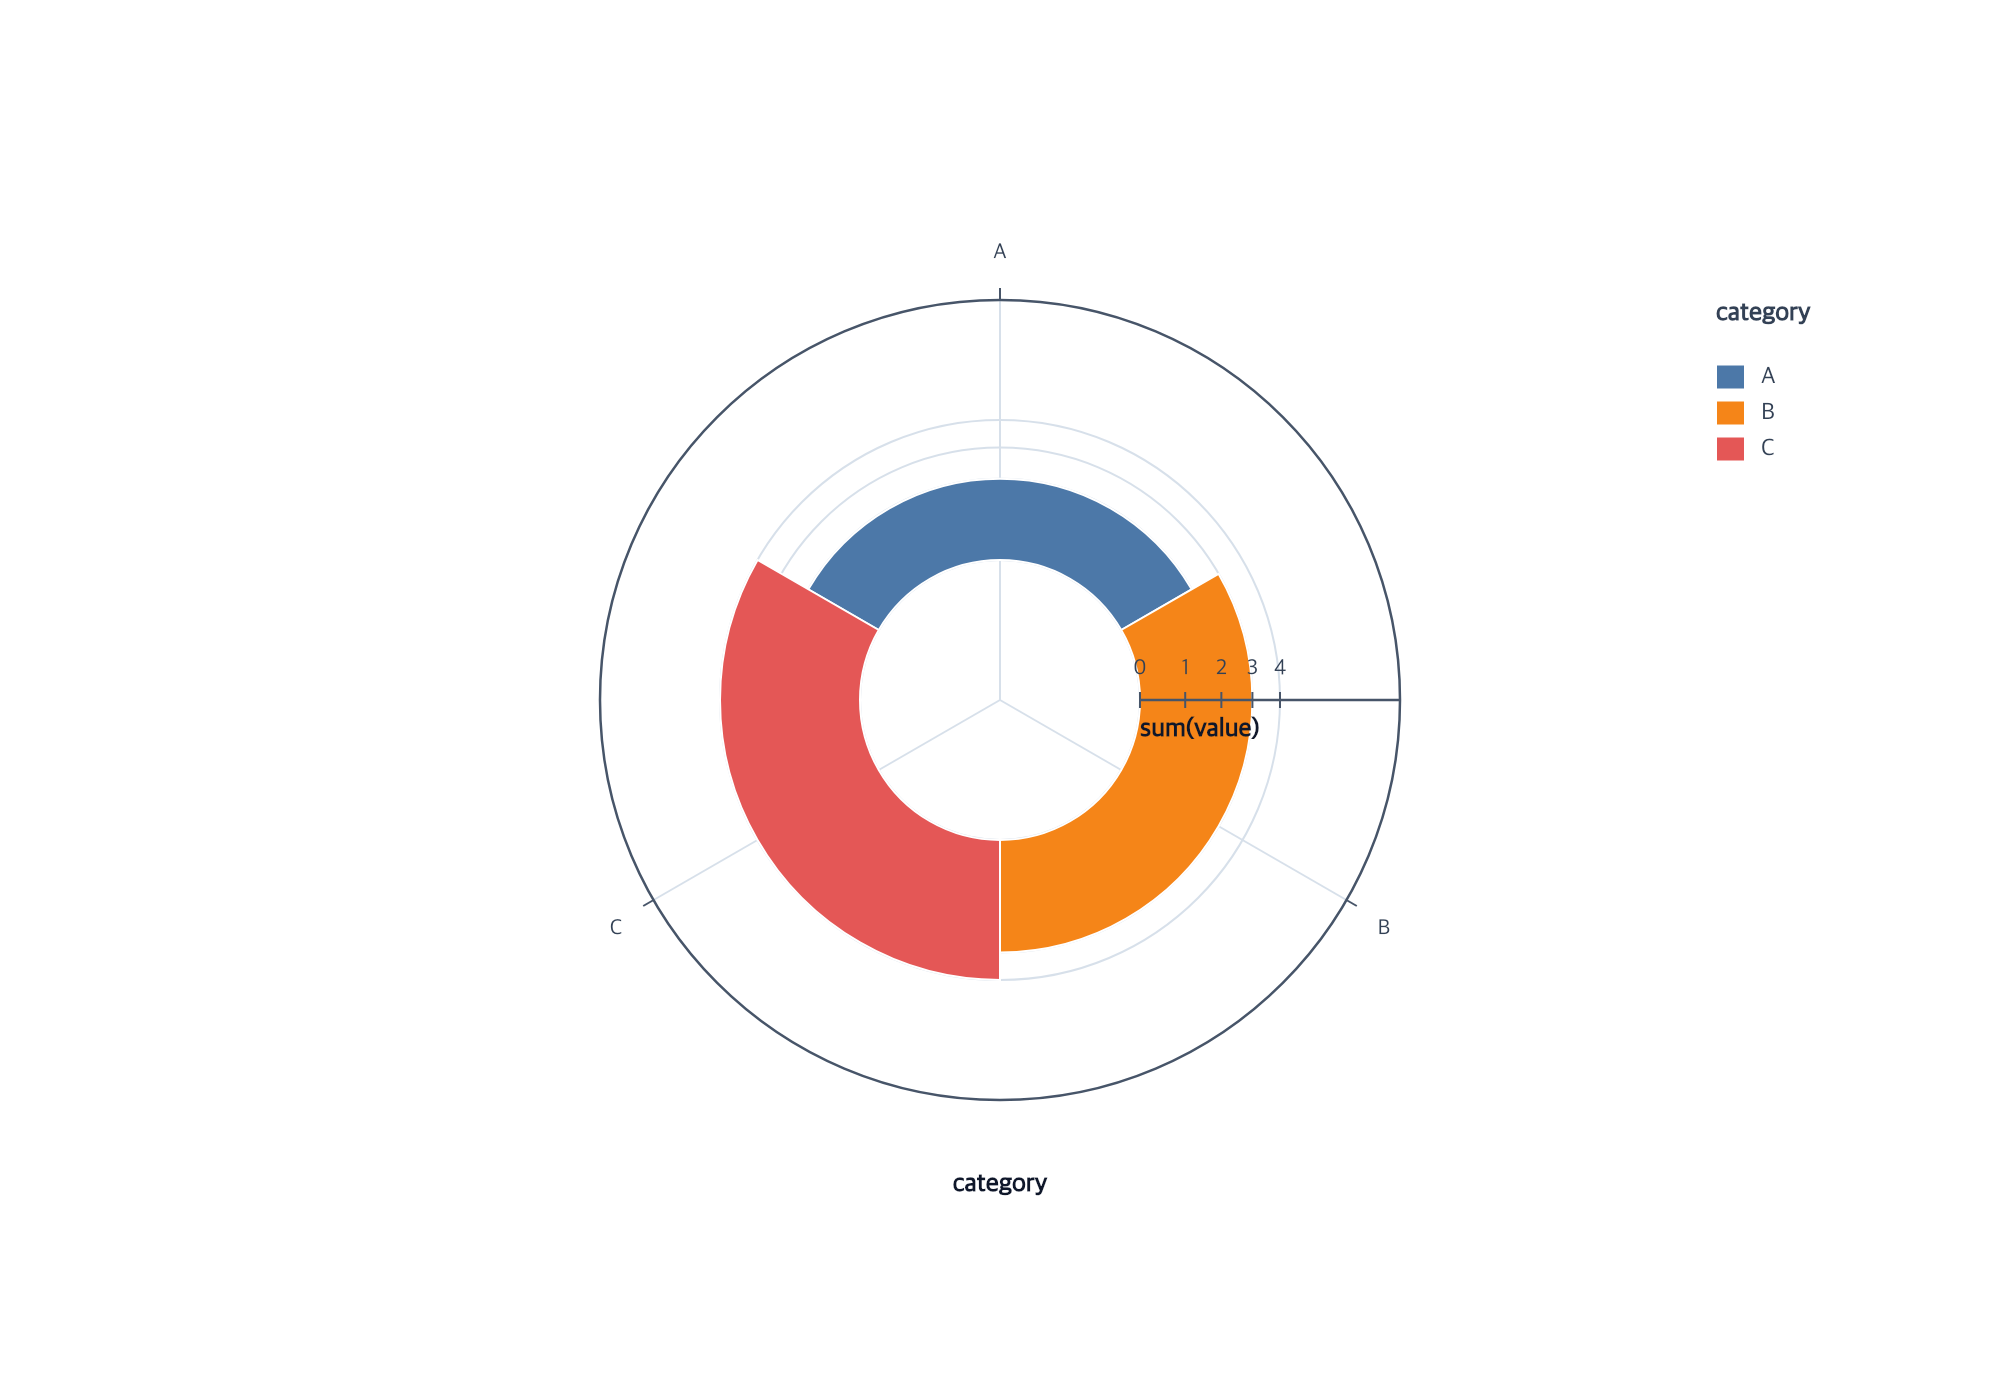
Compare category sums with proportional area or radial length.
createRosePlot
createRadialBarPlot
encodeR
View full size
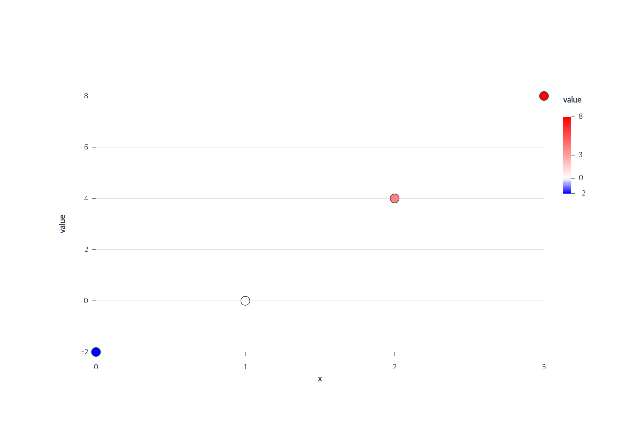
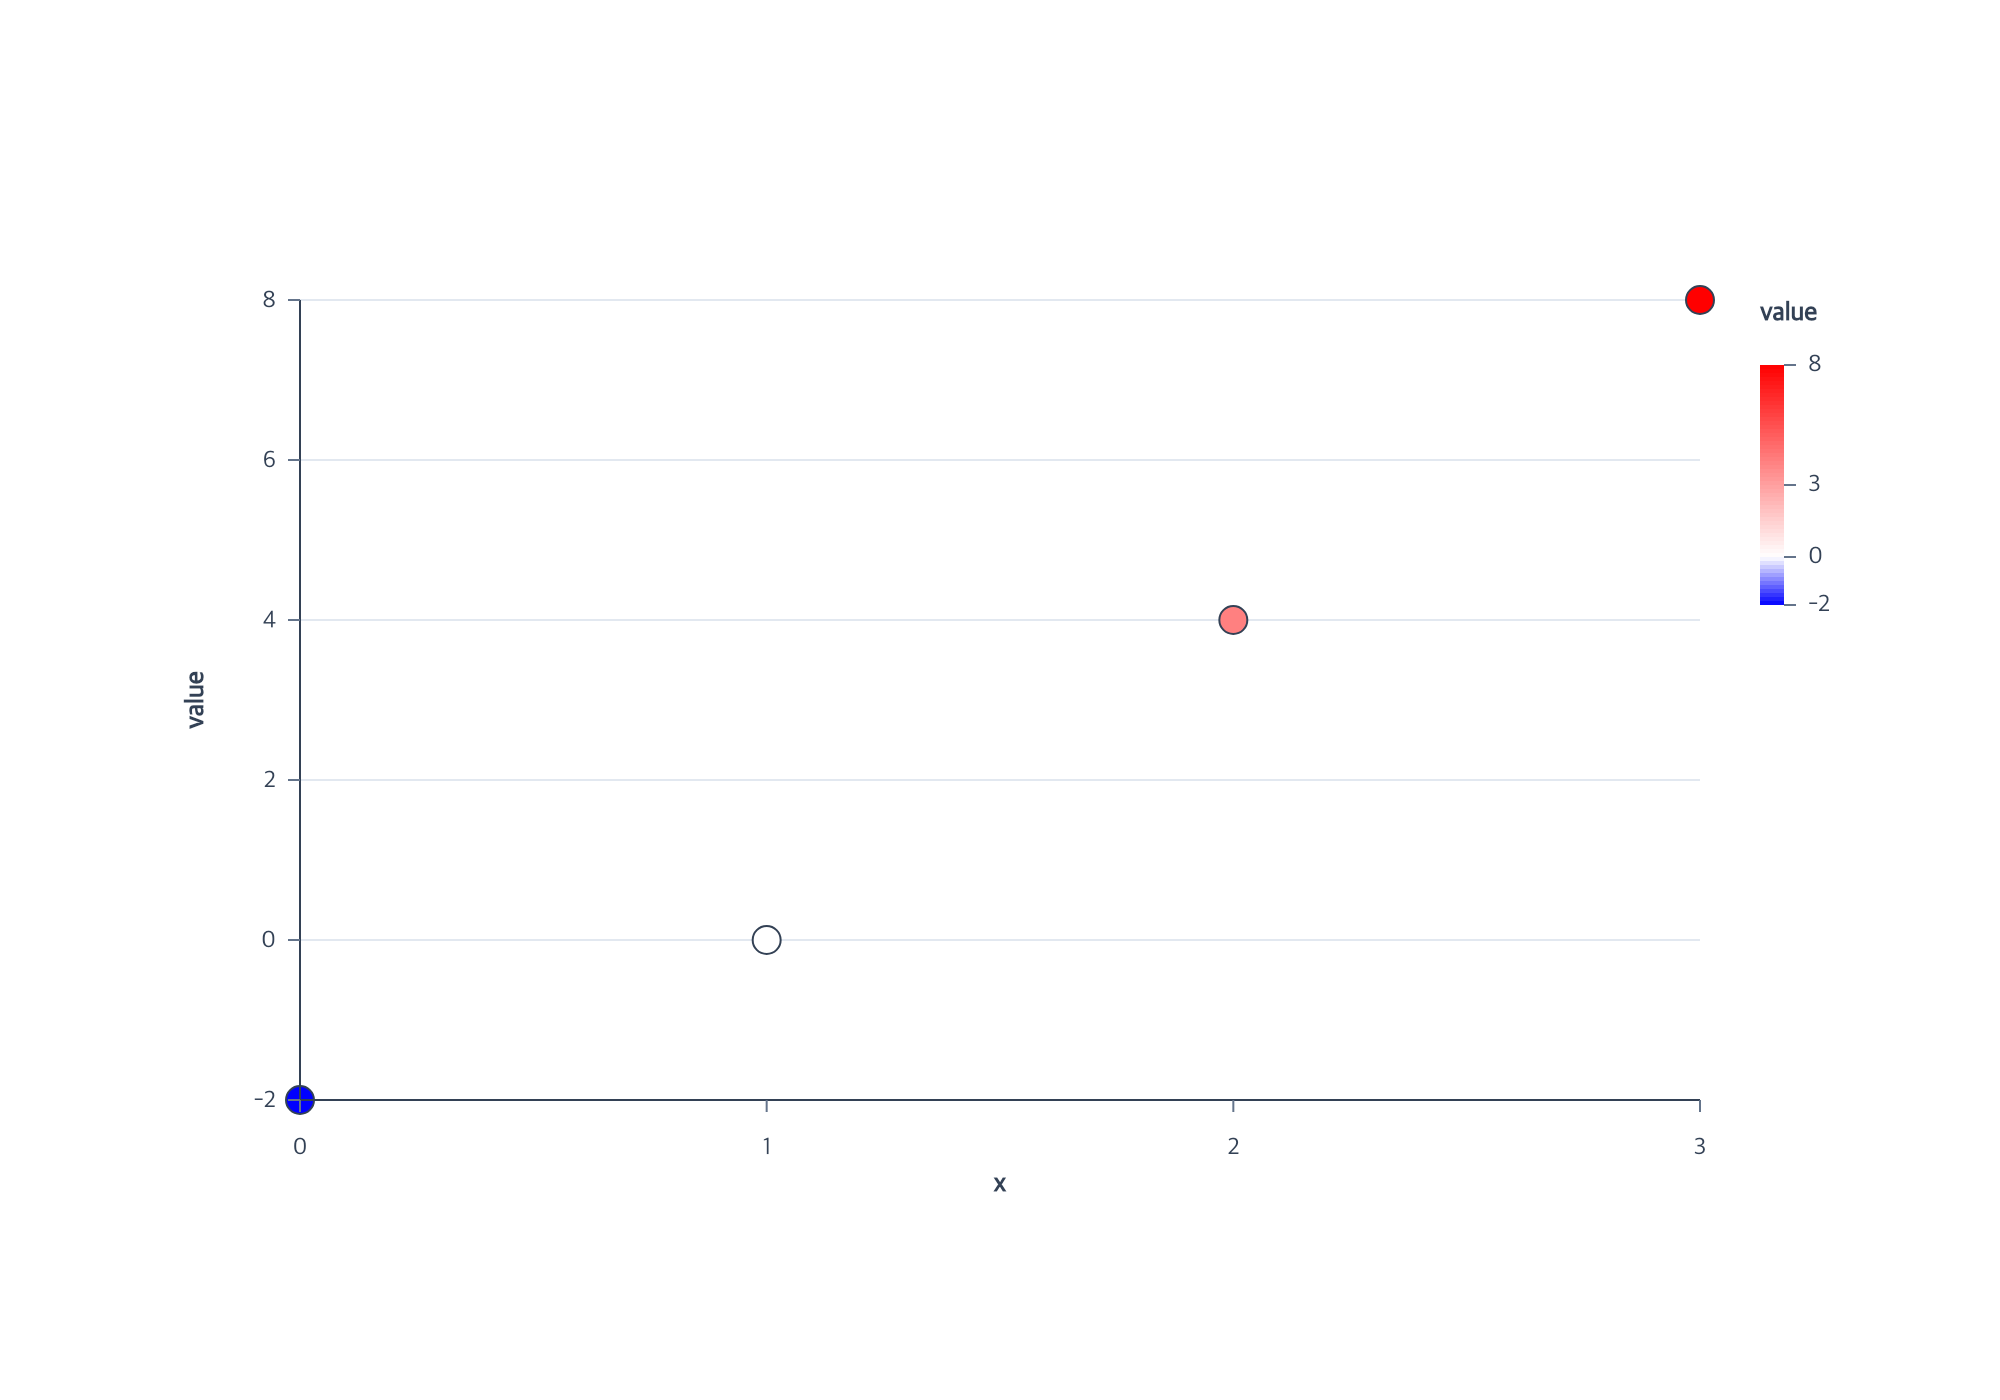
Set an explicit reference value for continuous color.
createScatterPlot
encodeColor
editScale
View full size
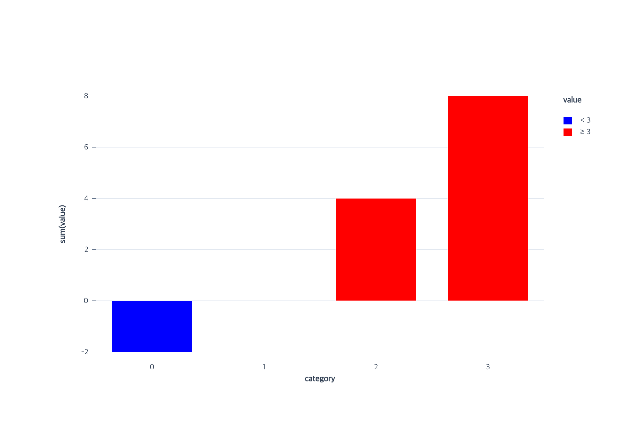
Switch between continuous color and numeric classes without stale guides.
createBarPlot
editScale
createLegend
View full size
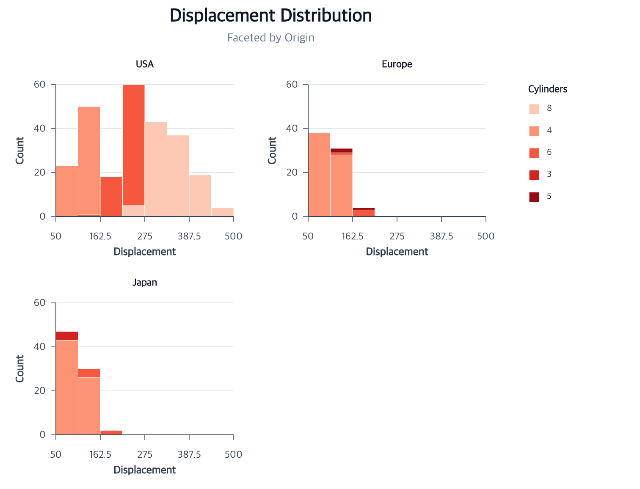
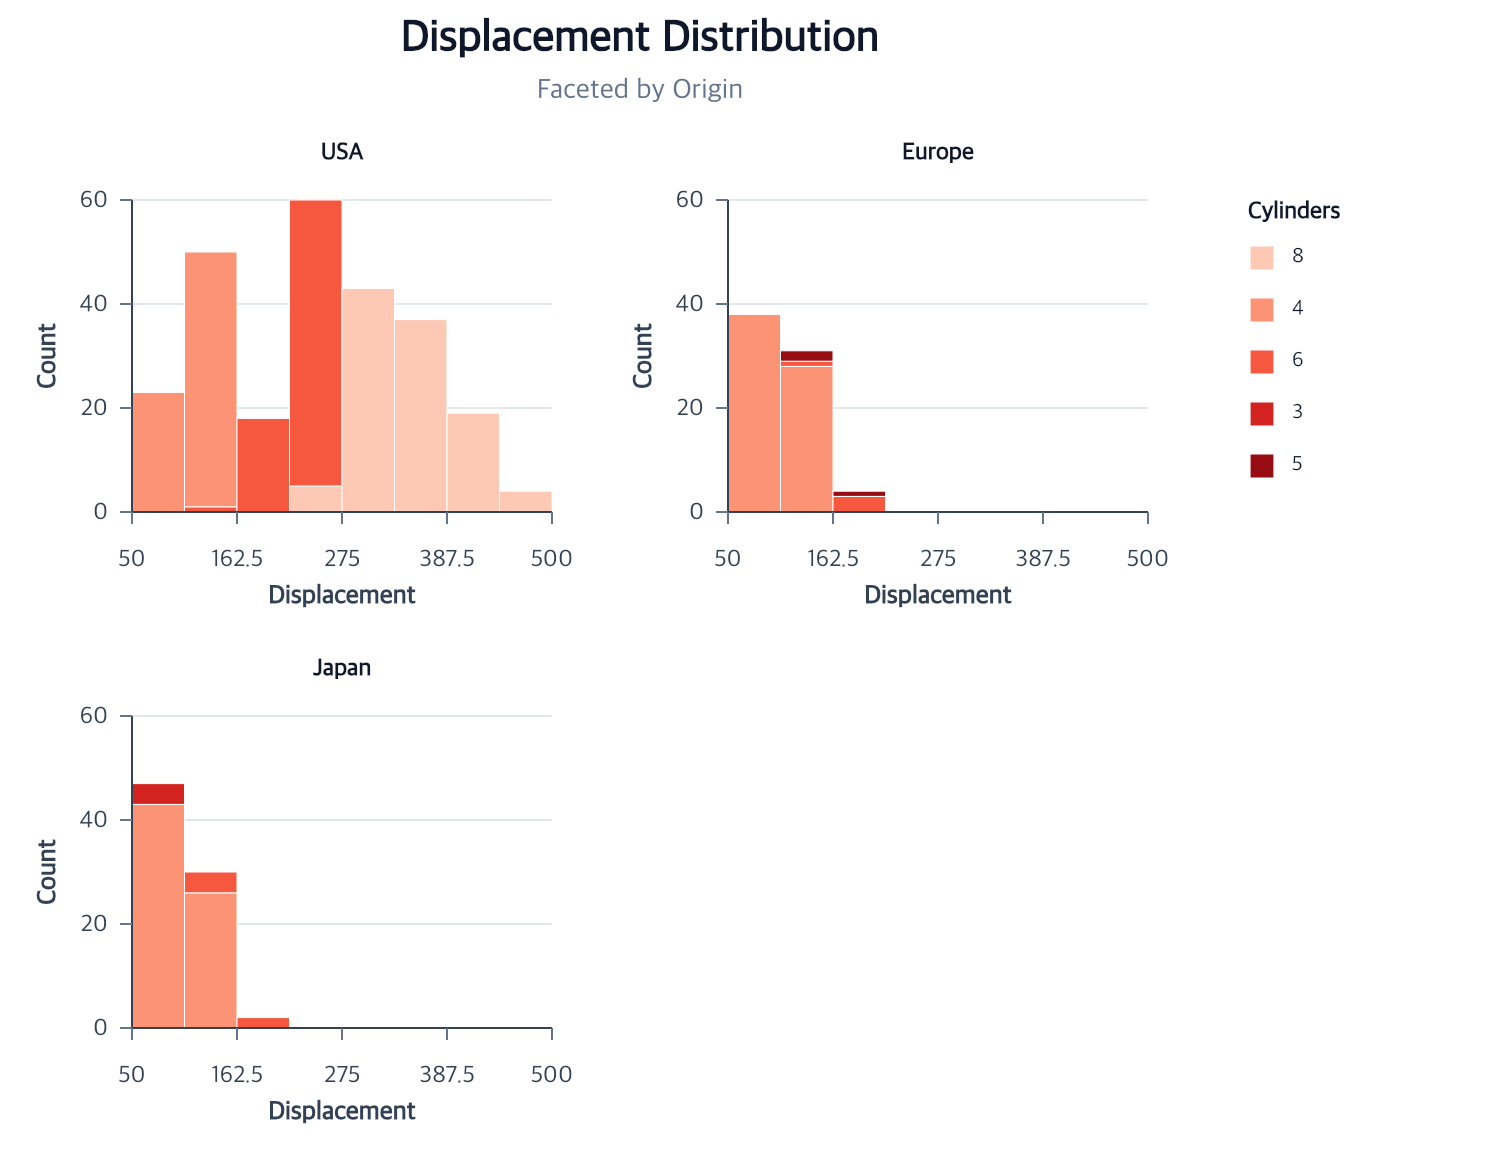
Each origin panel shows the observed distribution with its own final bars.
createBarMark
encodeHistogram
encodeColor
View full size
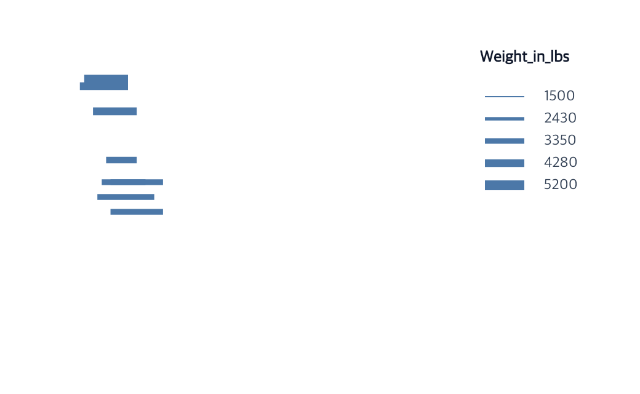
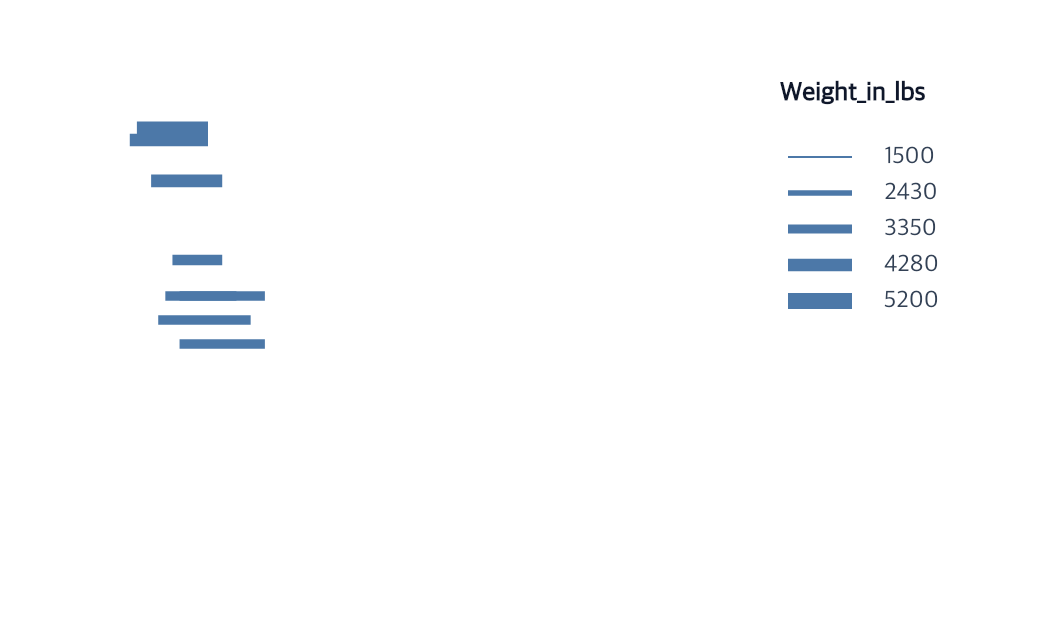
Rule widths and opacity map quantitative observations to visible stroke properties.
createRuleMark
encodeX
encodeX2
View full size
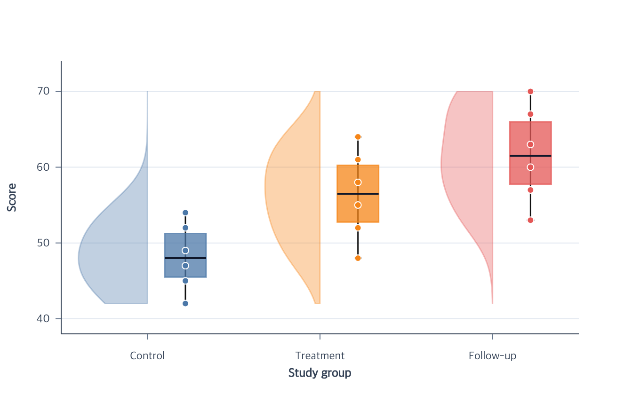
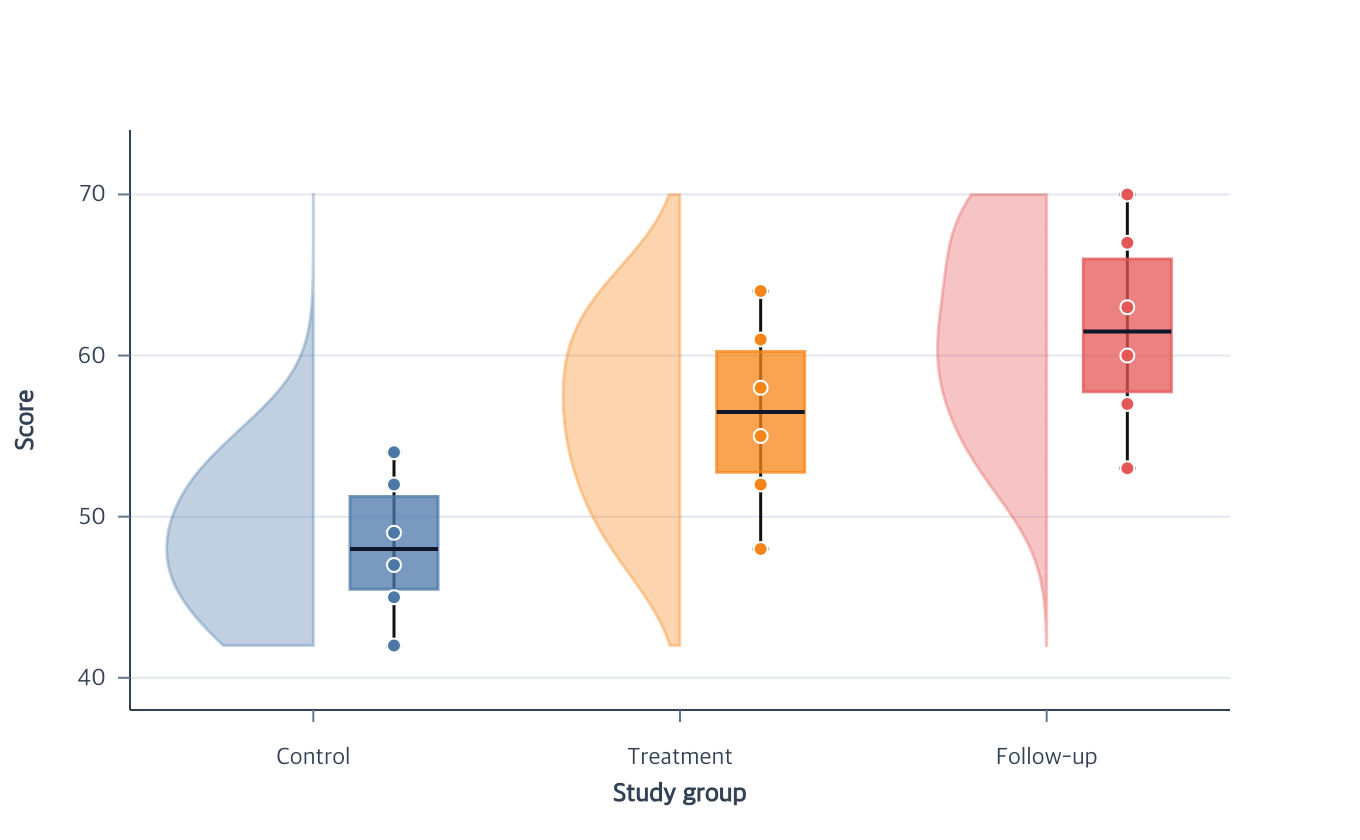
A half violin, summary, and raw observations share one category and measure frame.
createRaincloudPlot
View full size
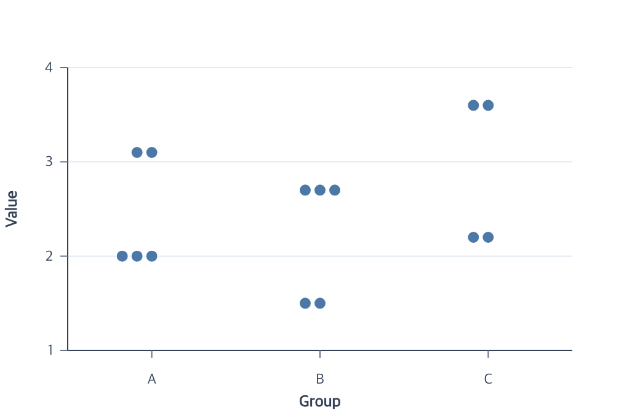
Packed point glyphs preserve individual observations within each category slot.
createBeeswarmPlot
View full size
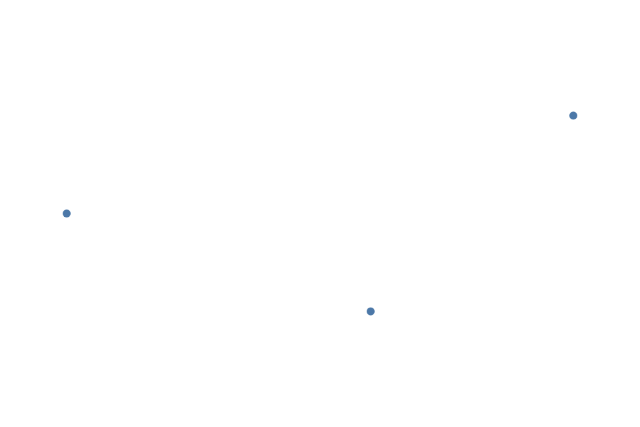
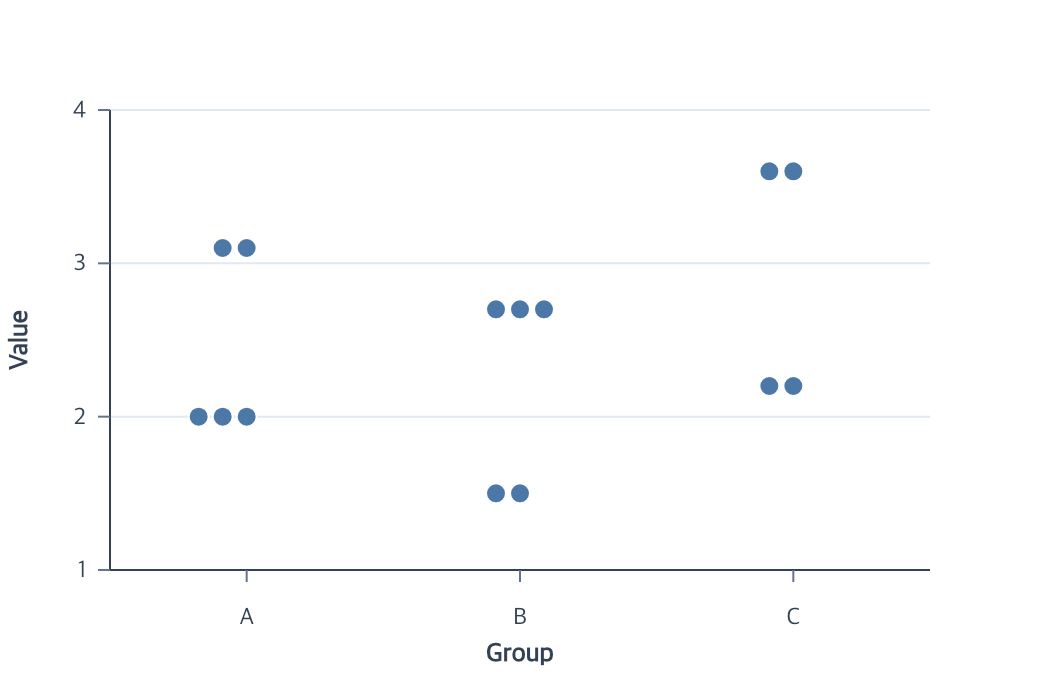
Each raw observation remains a dot on its categorical slot.
createDotPlot
View full size
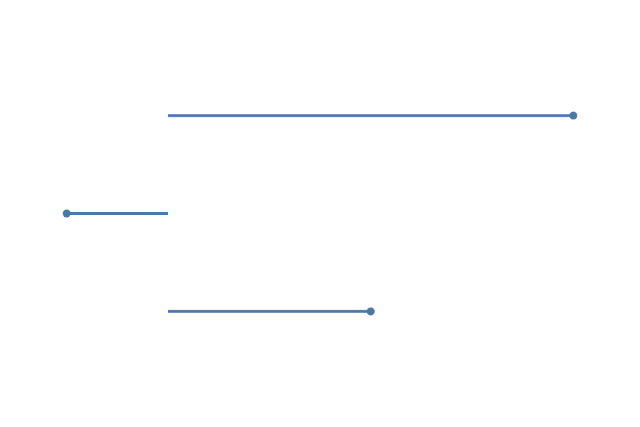
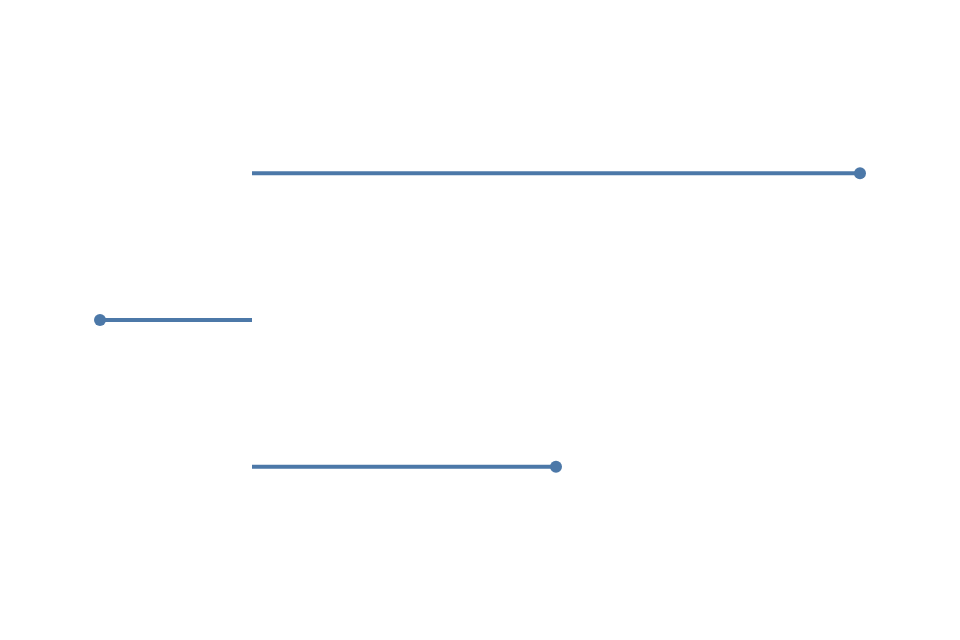
A stem connects each observation to the explicit zero baseline.
createLollipopPlot
View full size
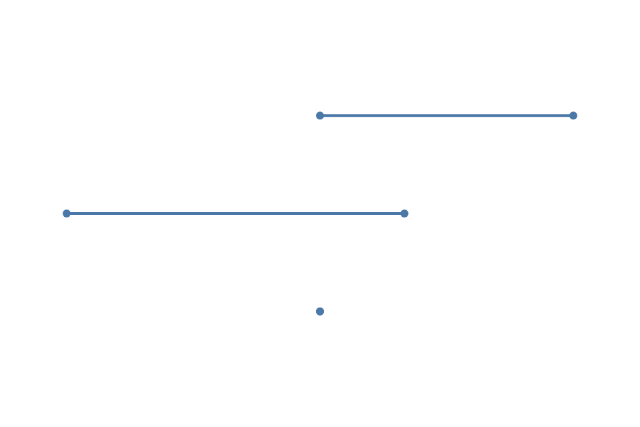
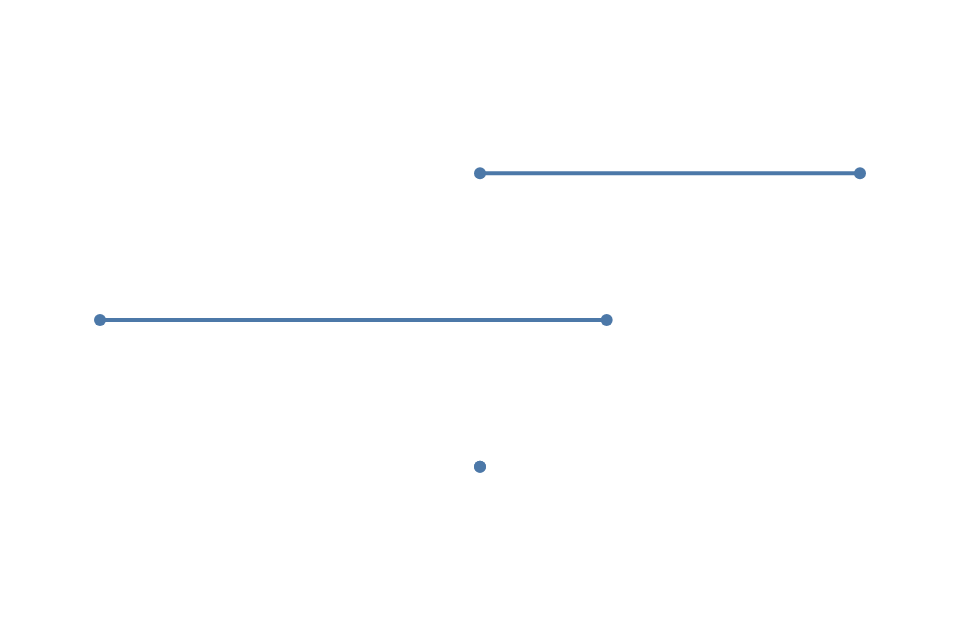
Named before and after endpoints retain their roles when values reverse.
createDumbbellPlot
View full size
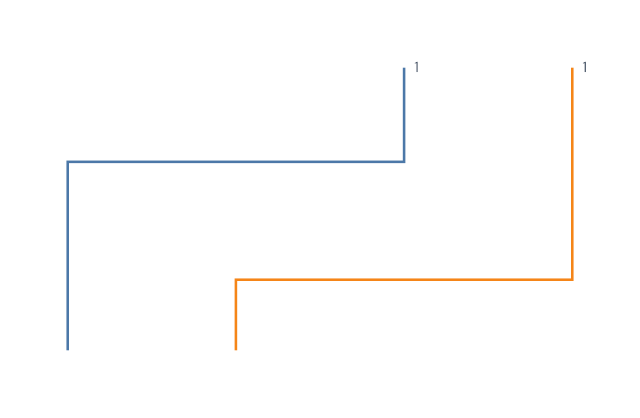
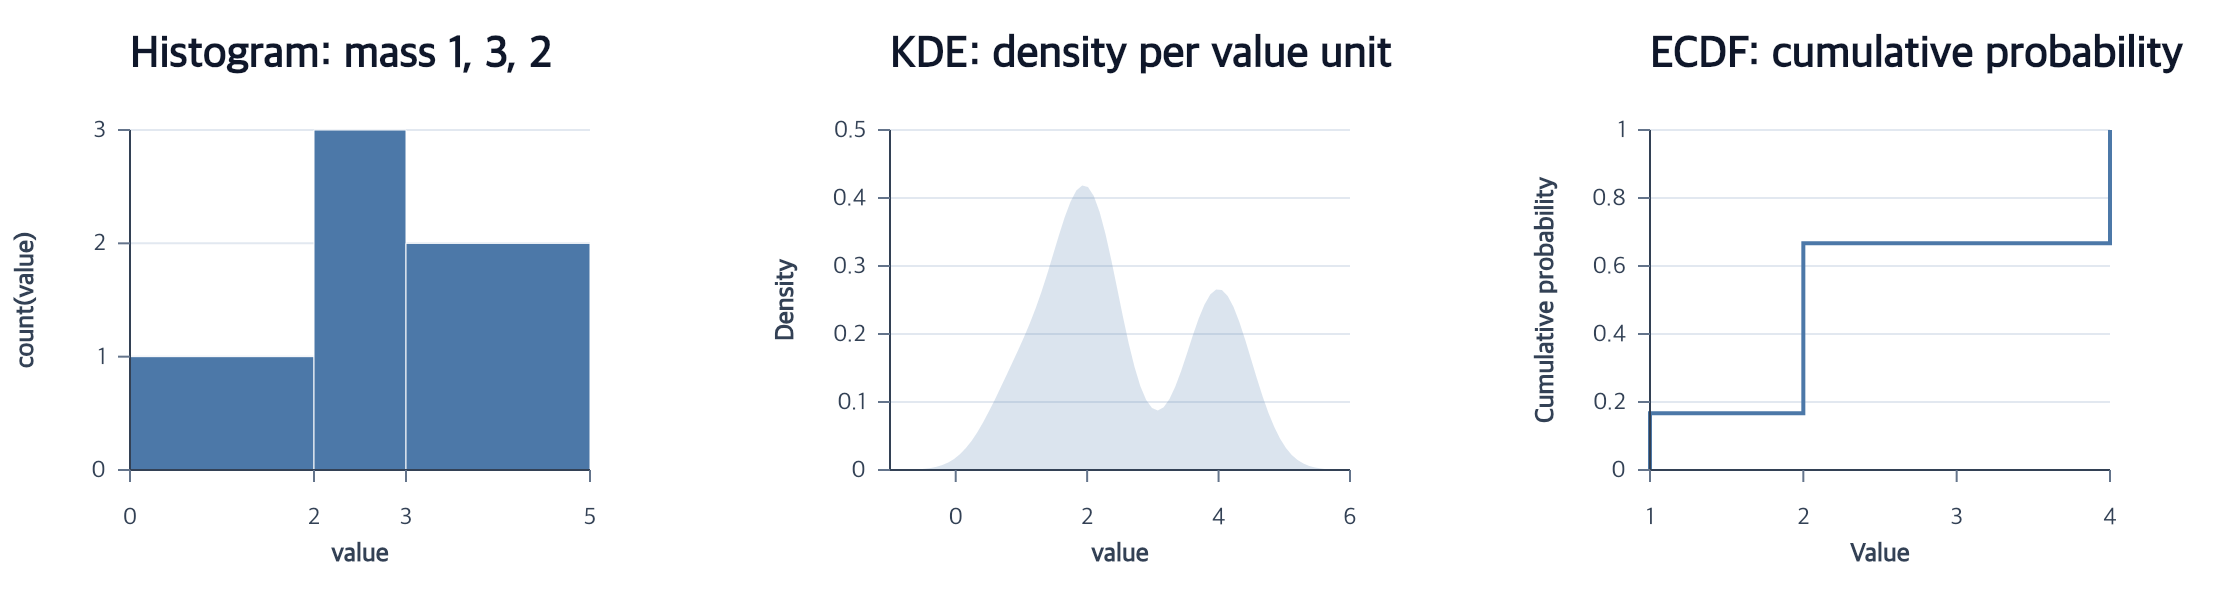
Step-after lines show cumulative probability at each observed support value.
createECDFPlot
View full size
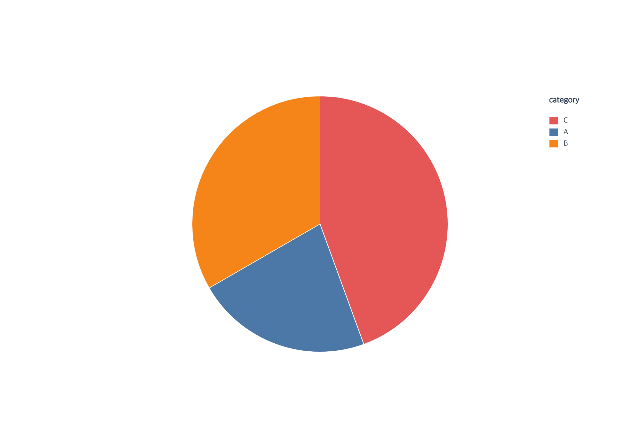
Reordering a categorical legend preserves the identities of the linked sectors.
createPiePlot
editLegend
View full size
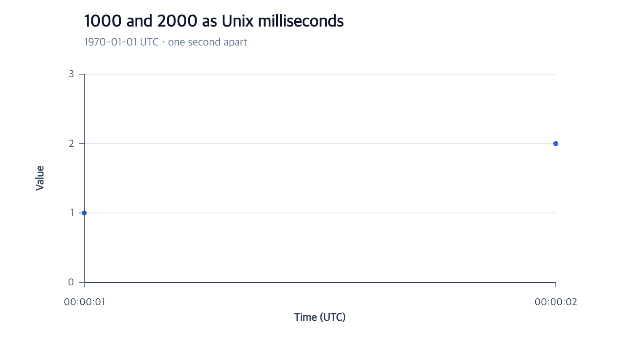
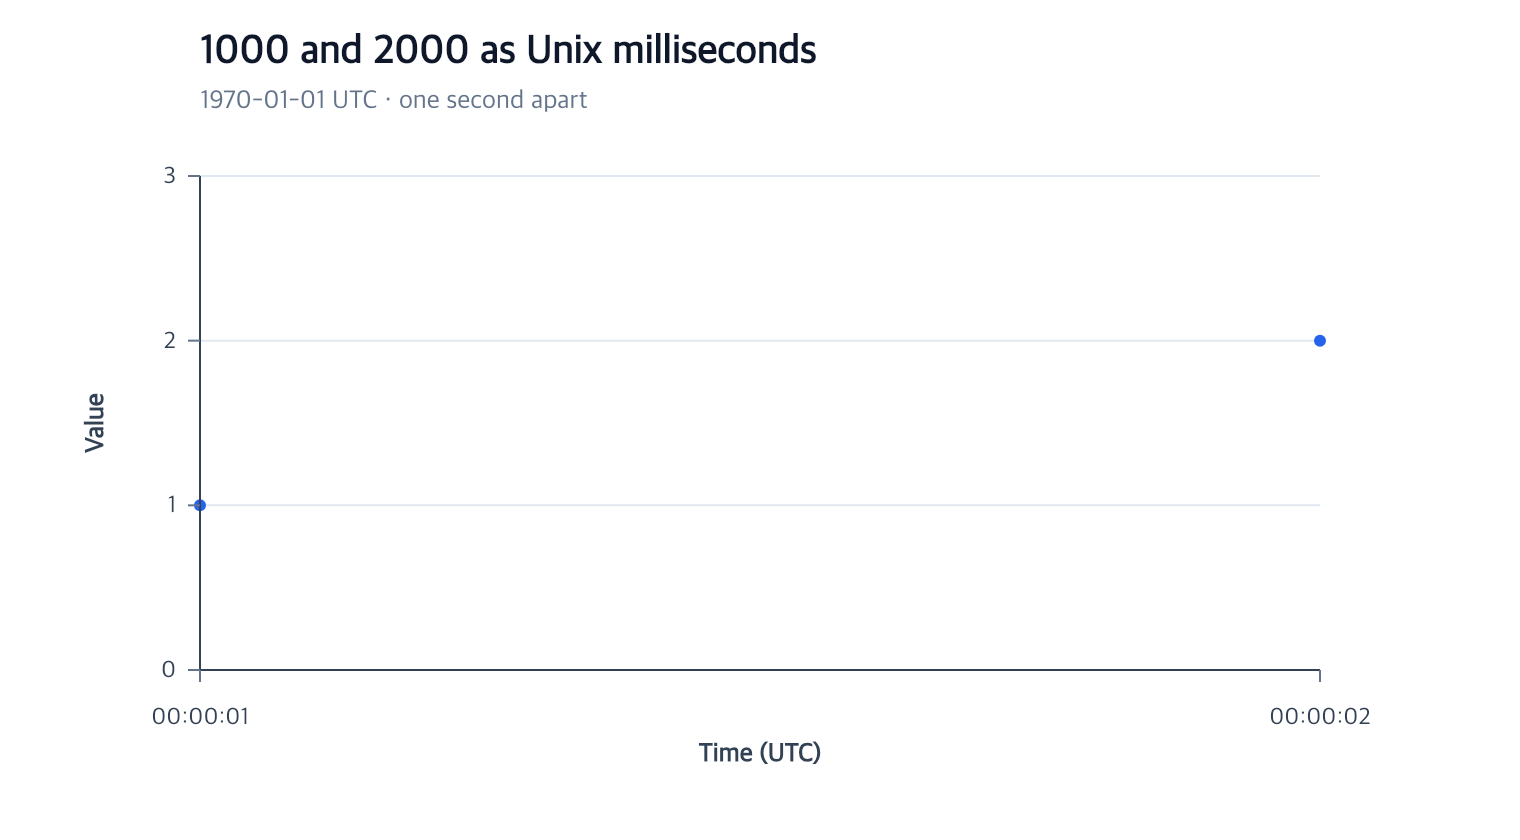
Quantitative measures are positioned against explicitly parsed temporal input.
createScatterPlot
createTitle
View full size
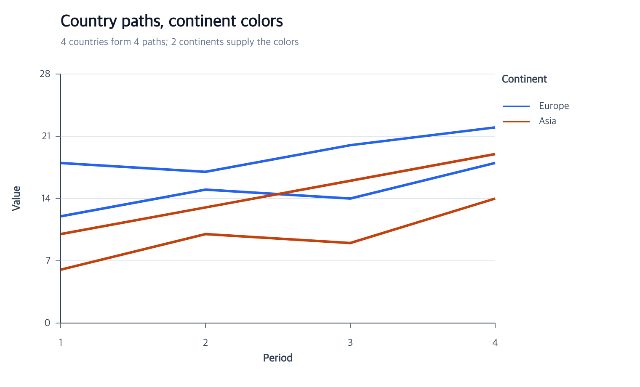
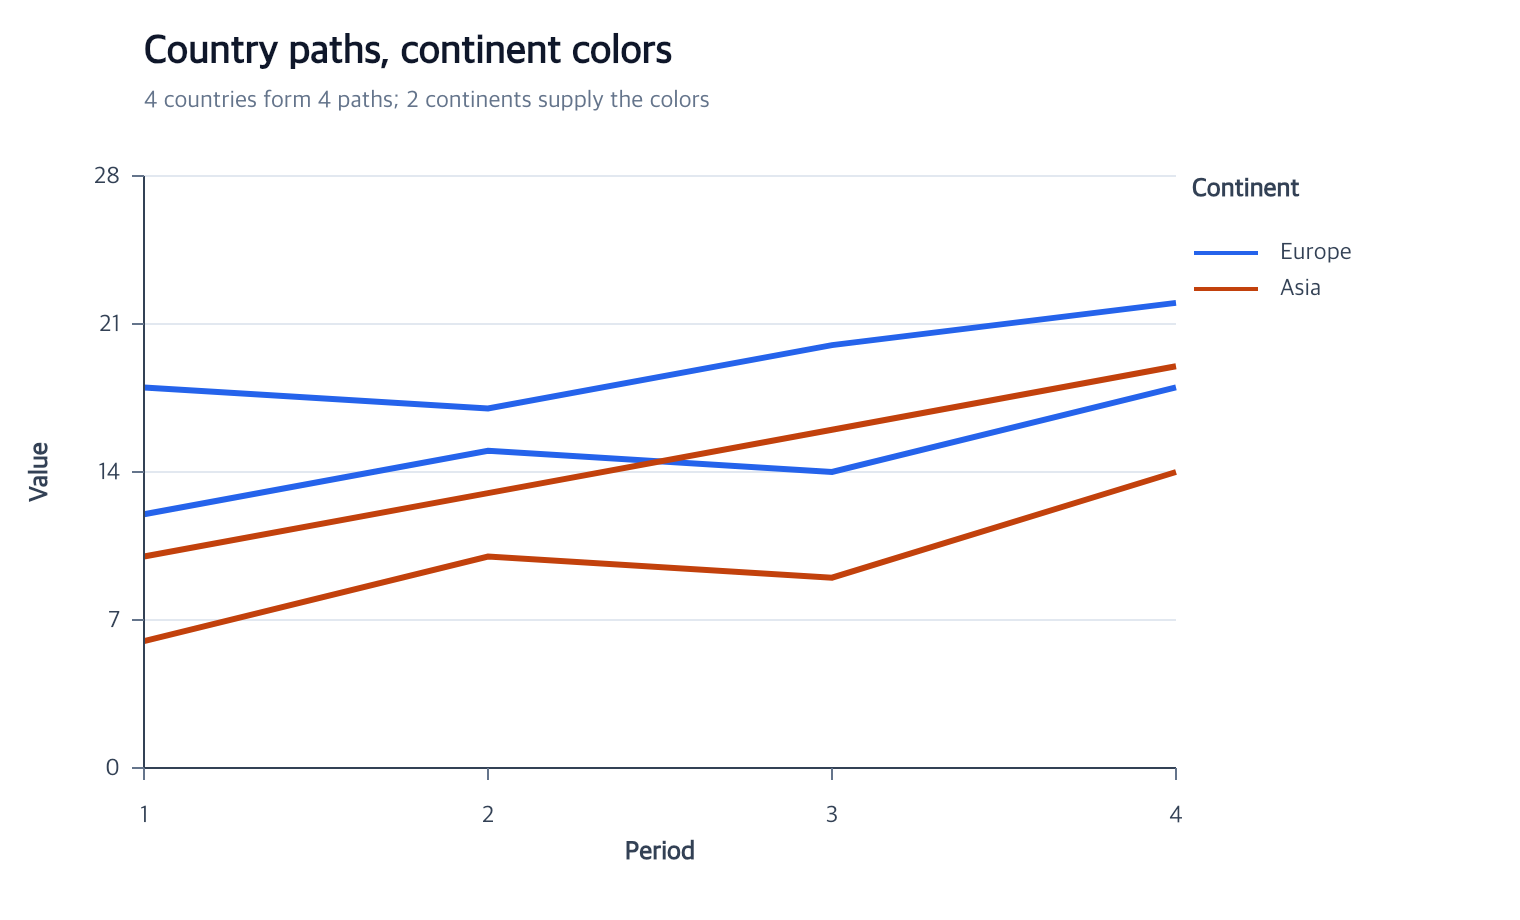
Series identity remains independent from color, width, and opacity encodings.
createLinePlot
encodeStrokeWidth
encodeOpacity
View full size
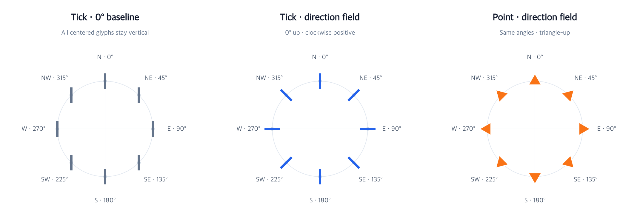
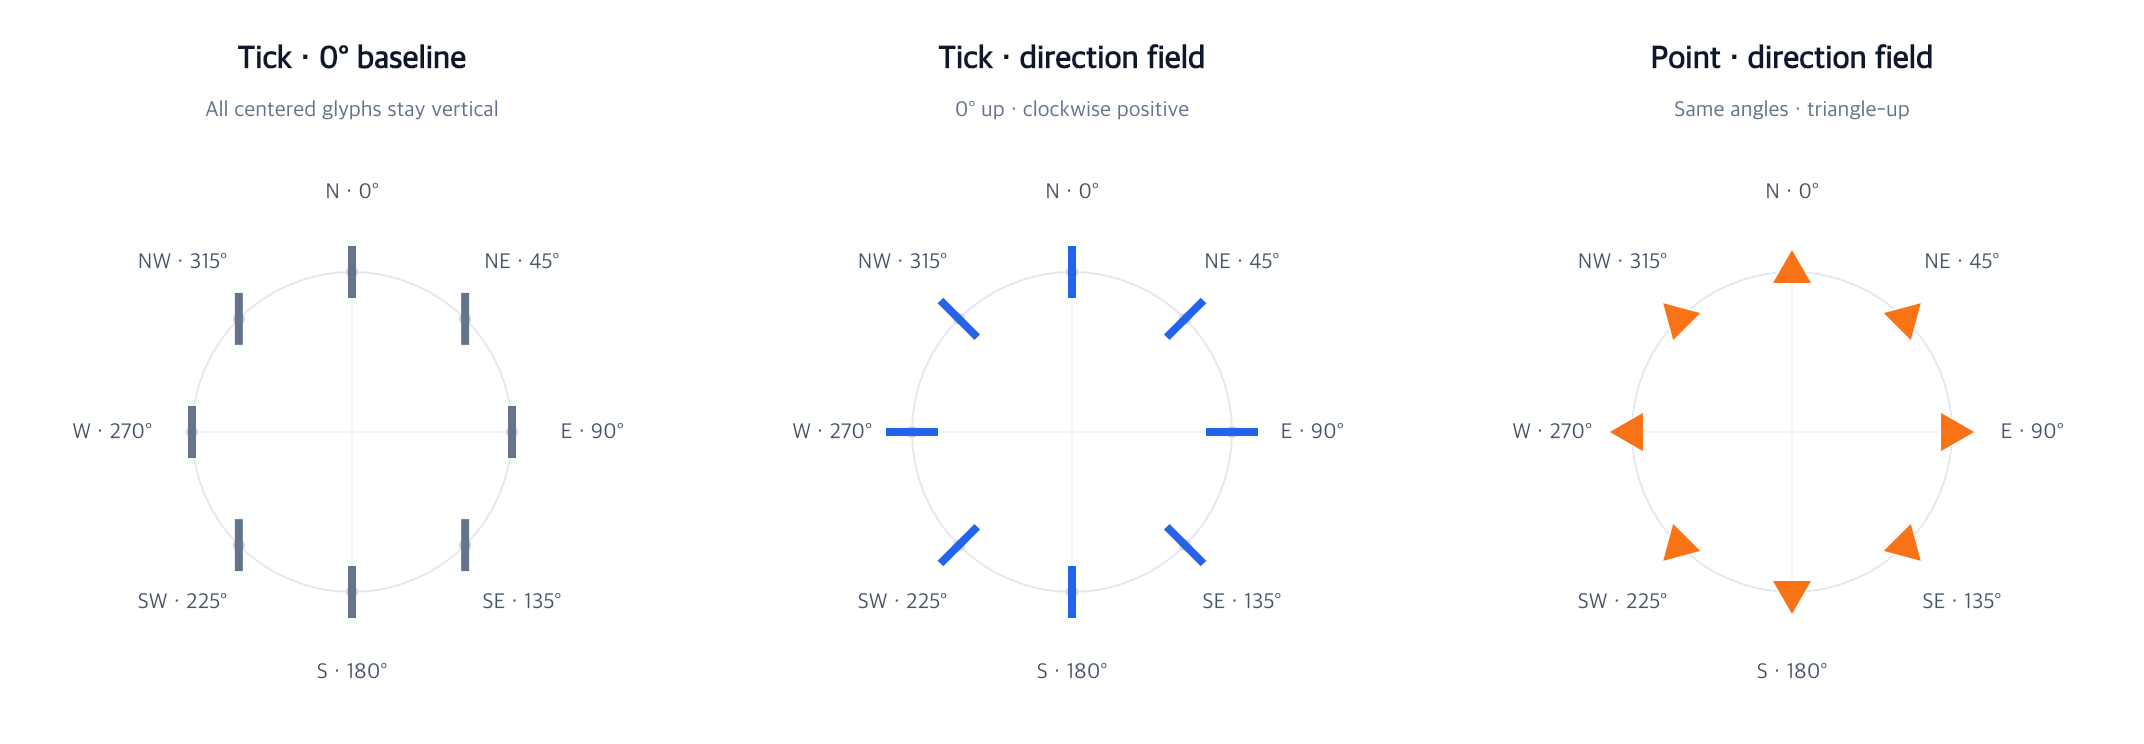
Directional glyphs and a rug compare point and tick encodings.
encodeX
encodeY
createTickMark
View full size
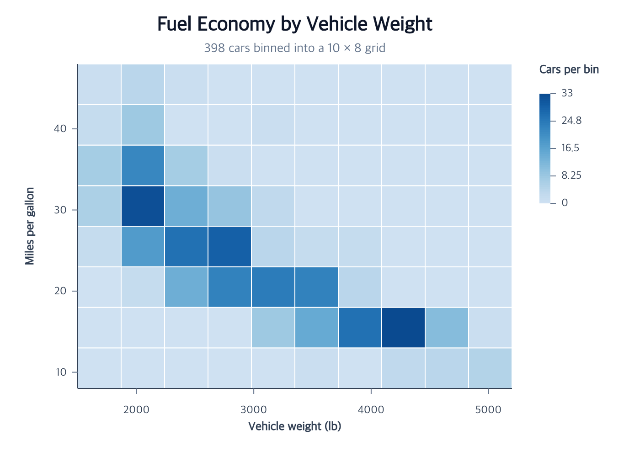
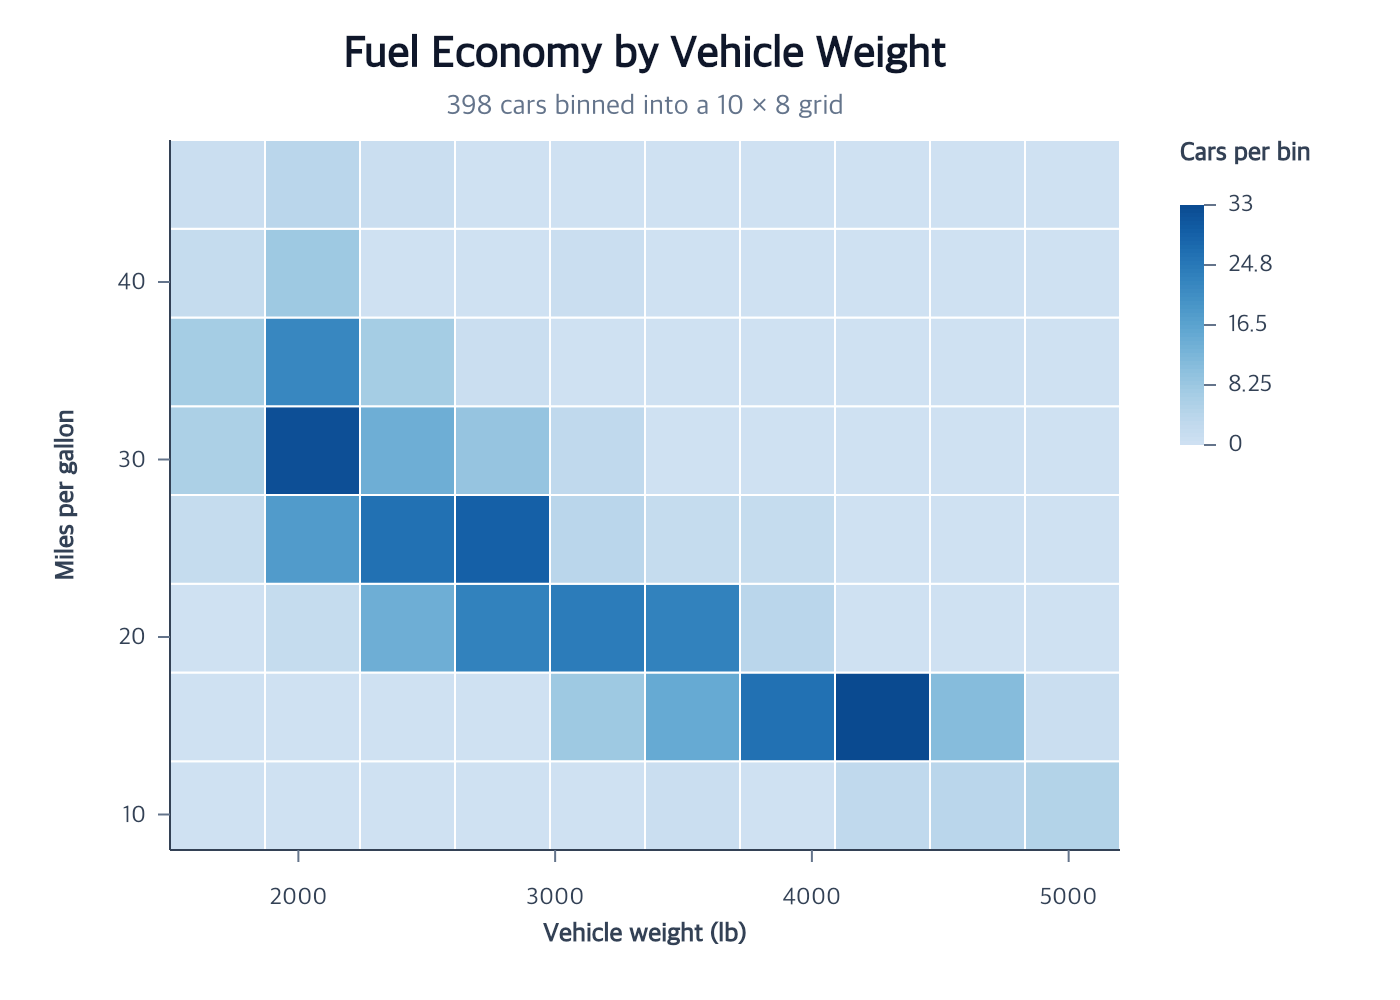
Rectangular bins summarize the density of two quantitative car measurements.
createHeatmap
createTitle
View full size
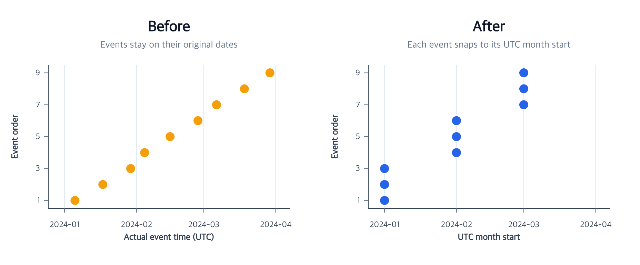
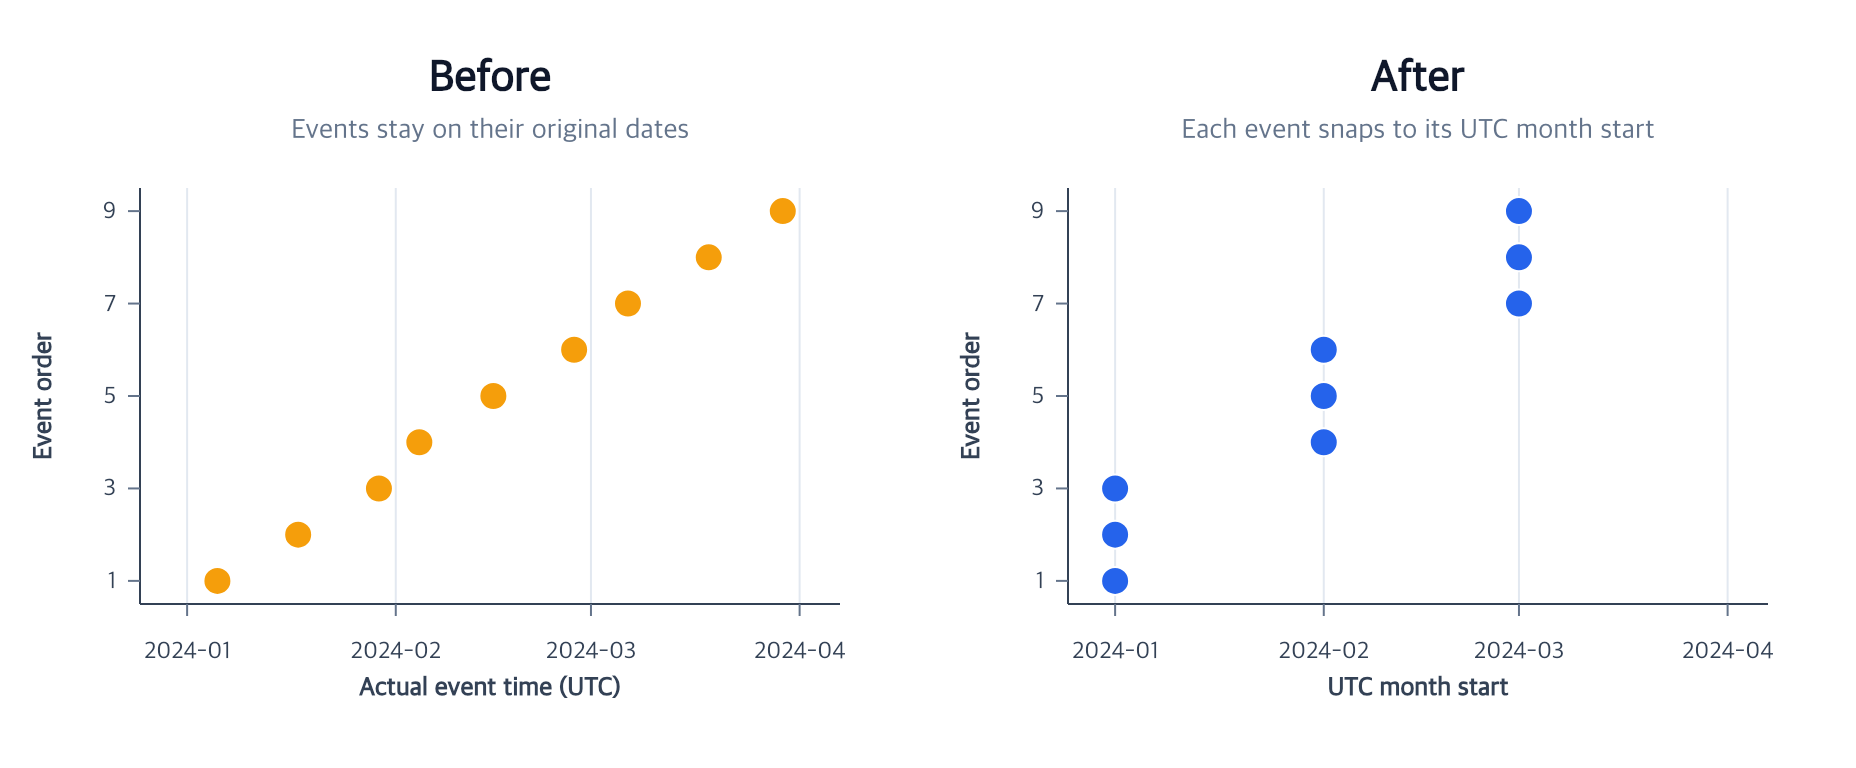
Calendar buckets change temporal resolution while preserving original measurements.
createTimeUnitData
createScatterPlot
createTitle
View full size
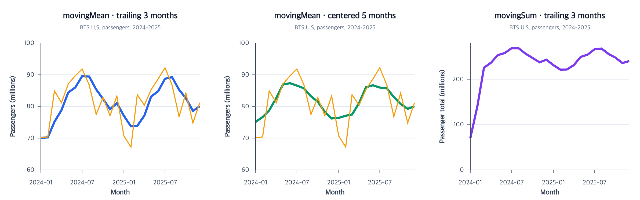
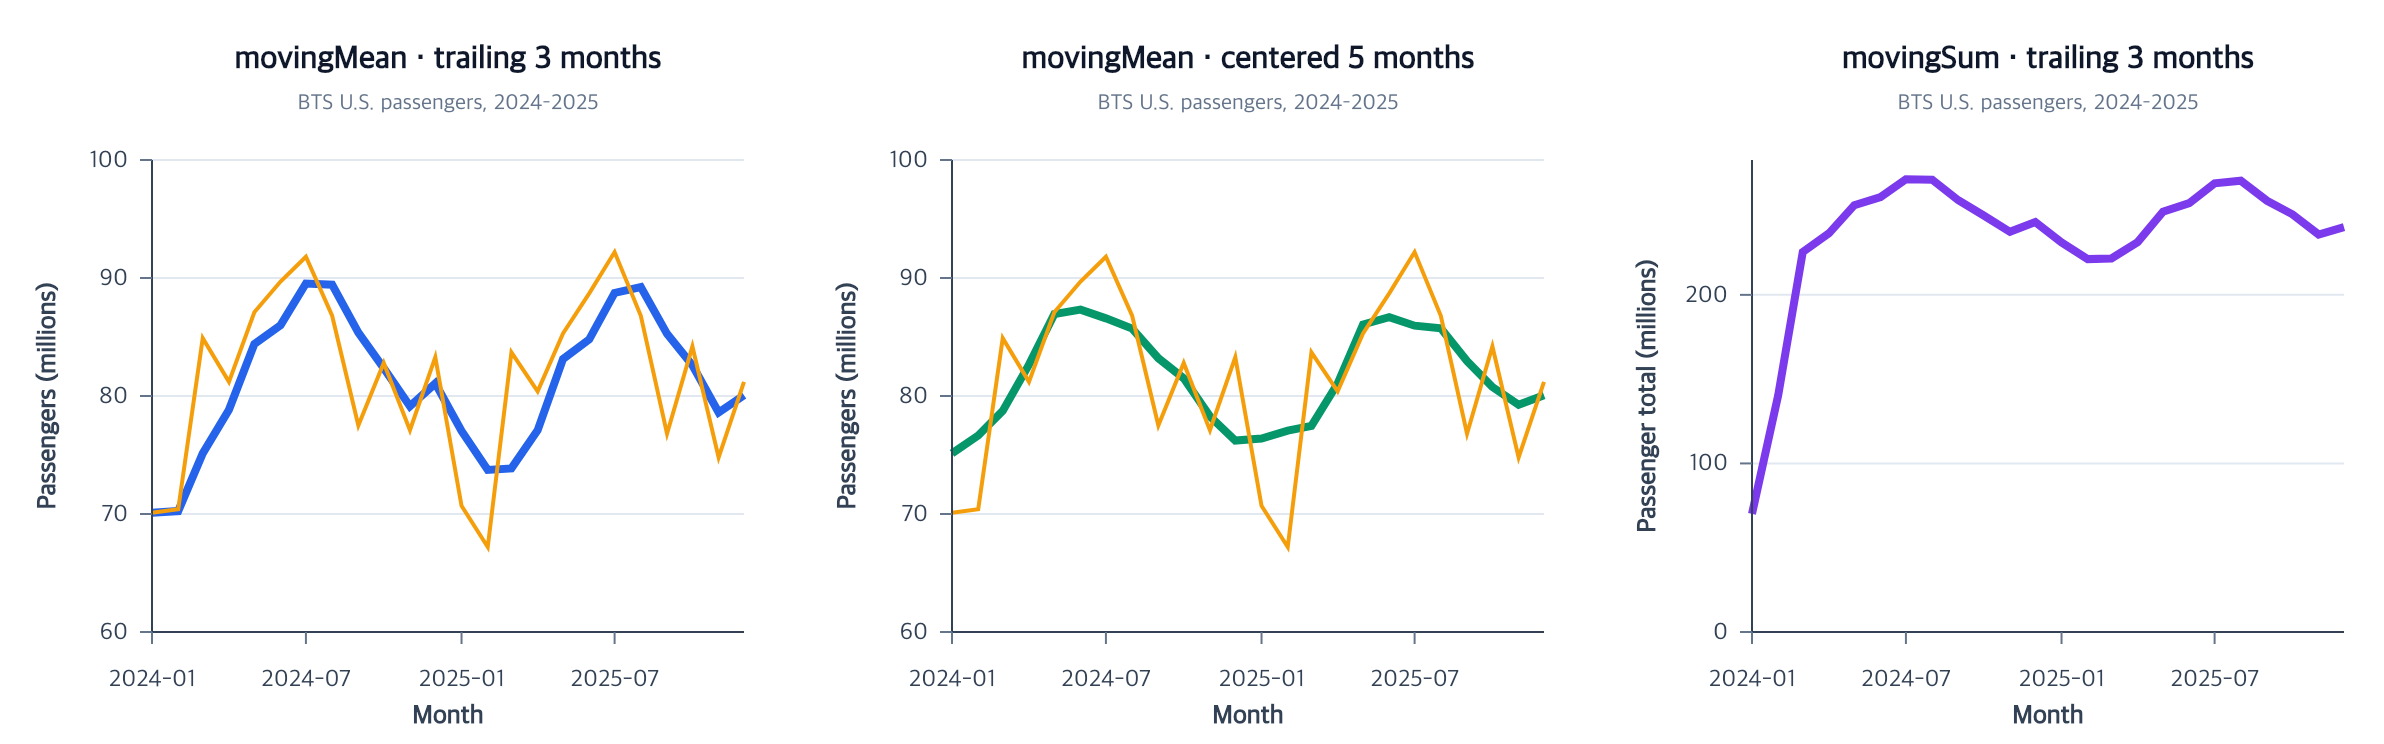
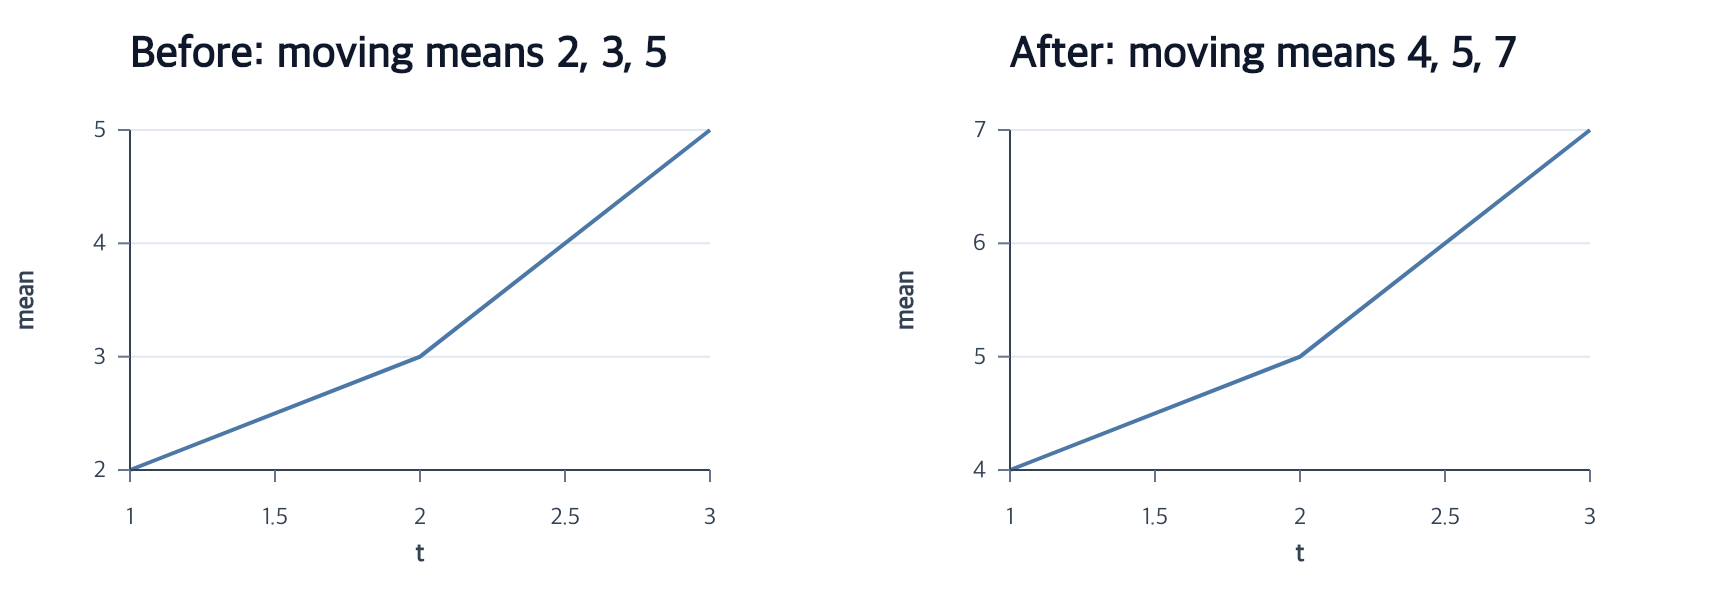
Ordered moving summaries reveal changes in monthly passenger counts.
createTimeUnitData
createLineMark
encodeX
View full size
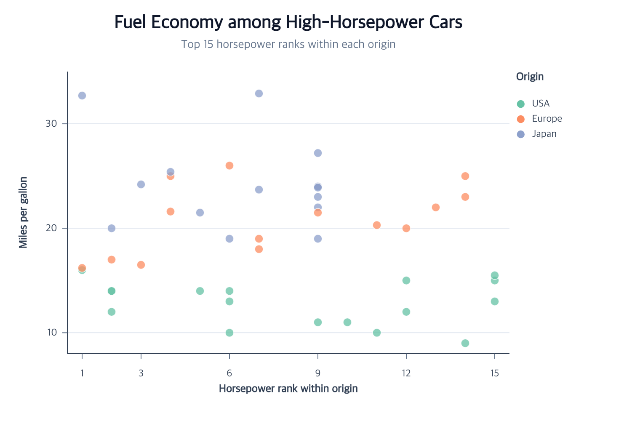
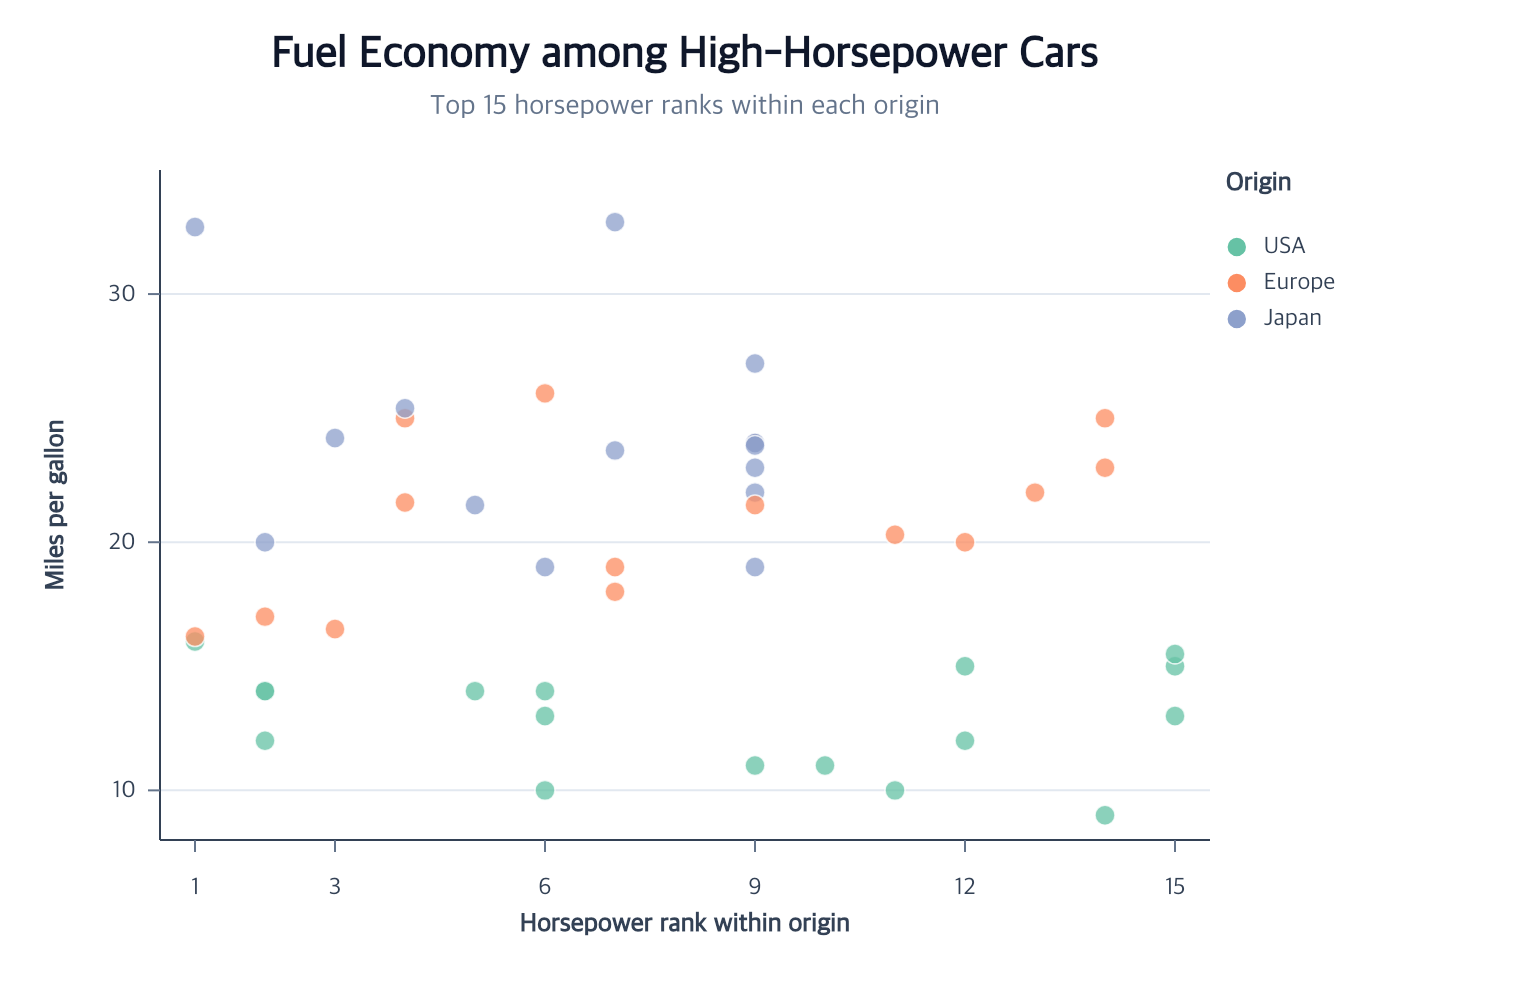
A partitioned window rank selects observations before drawing a scatterplot.
createWindowData
filterData
createScatterPlot
View full size
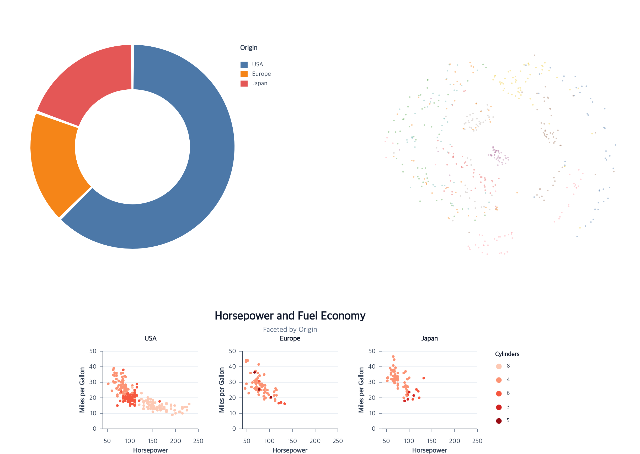
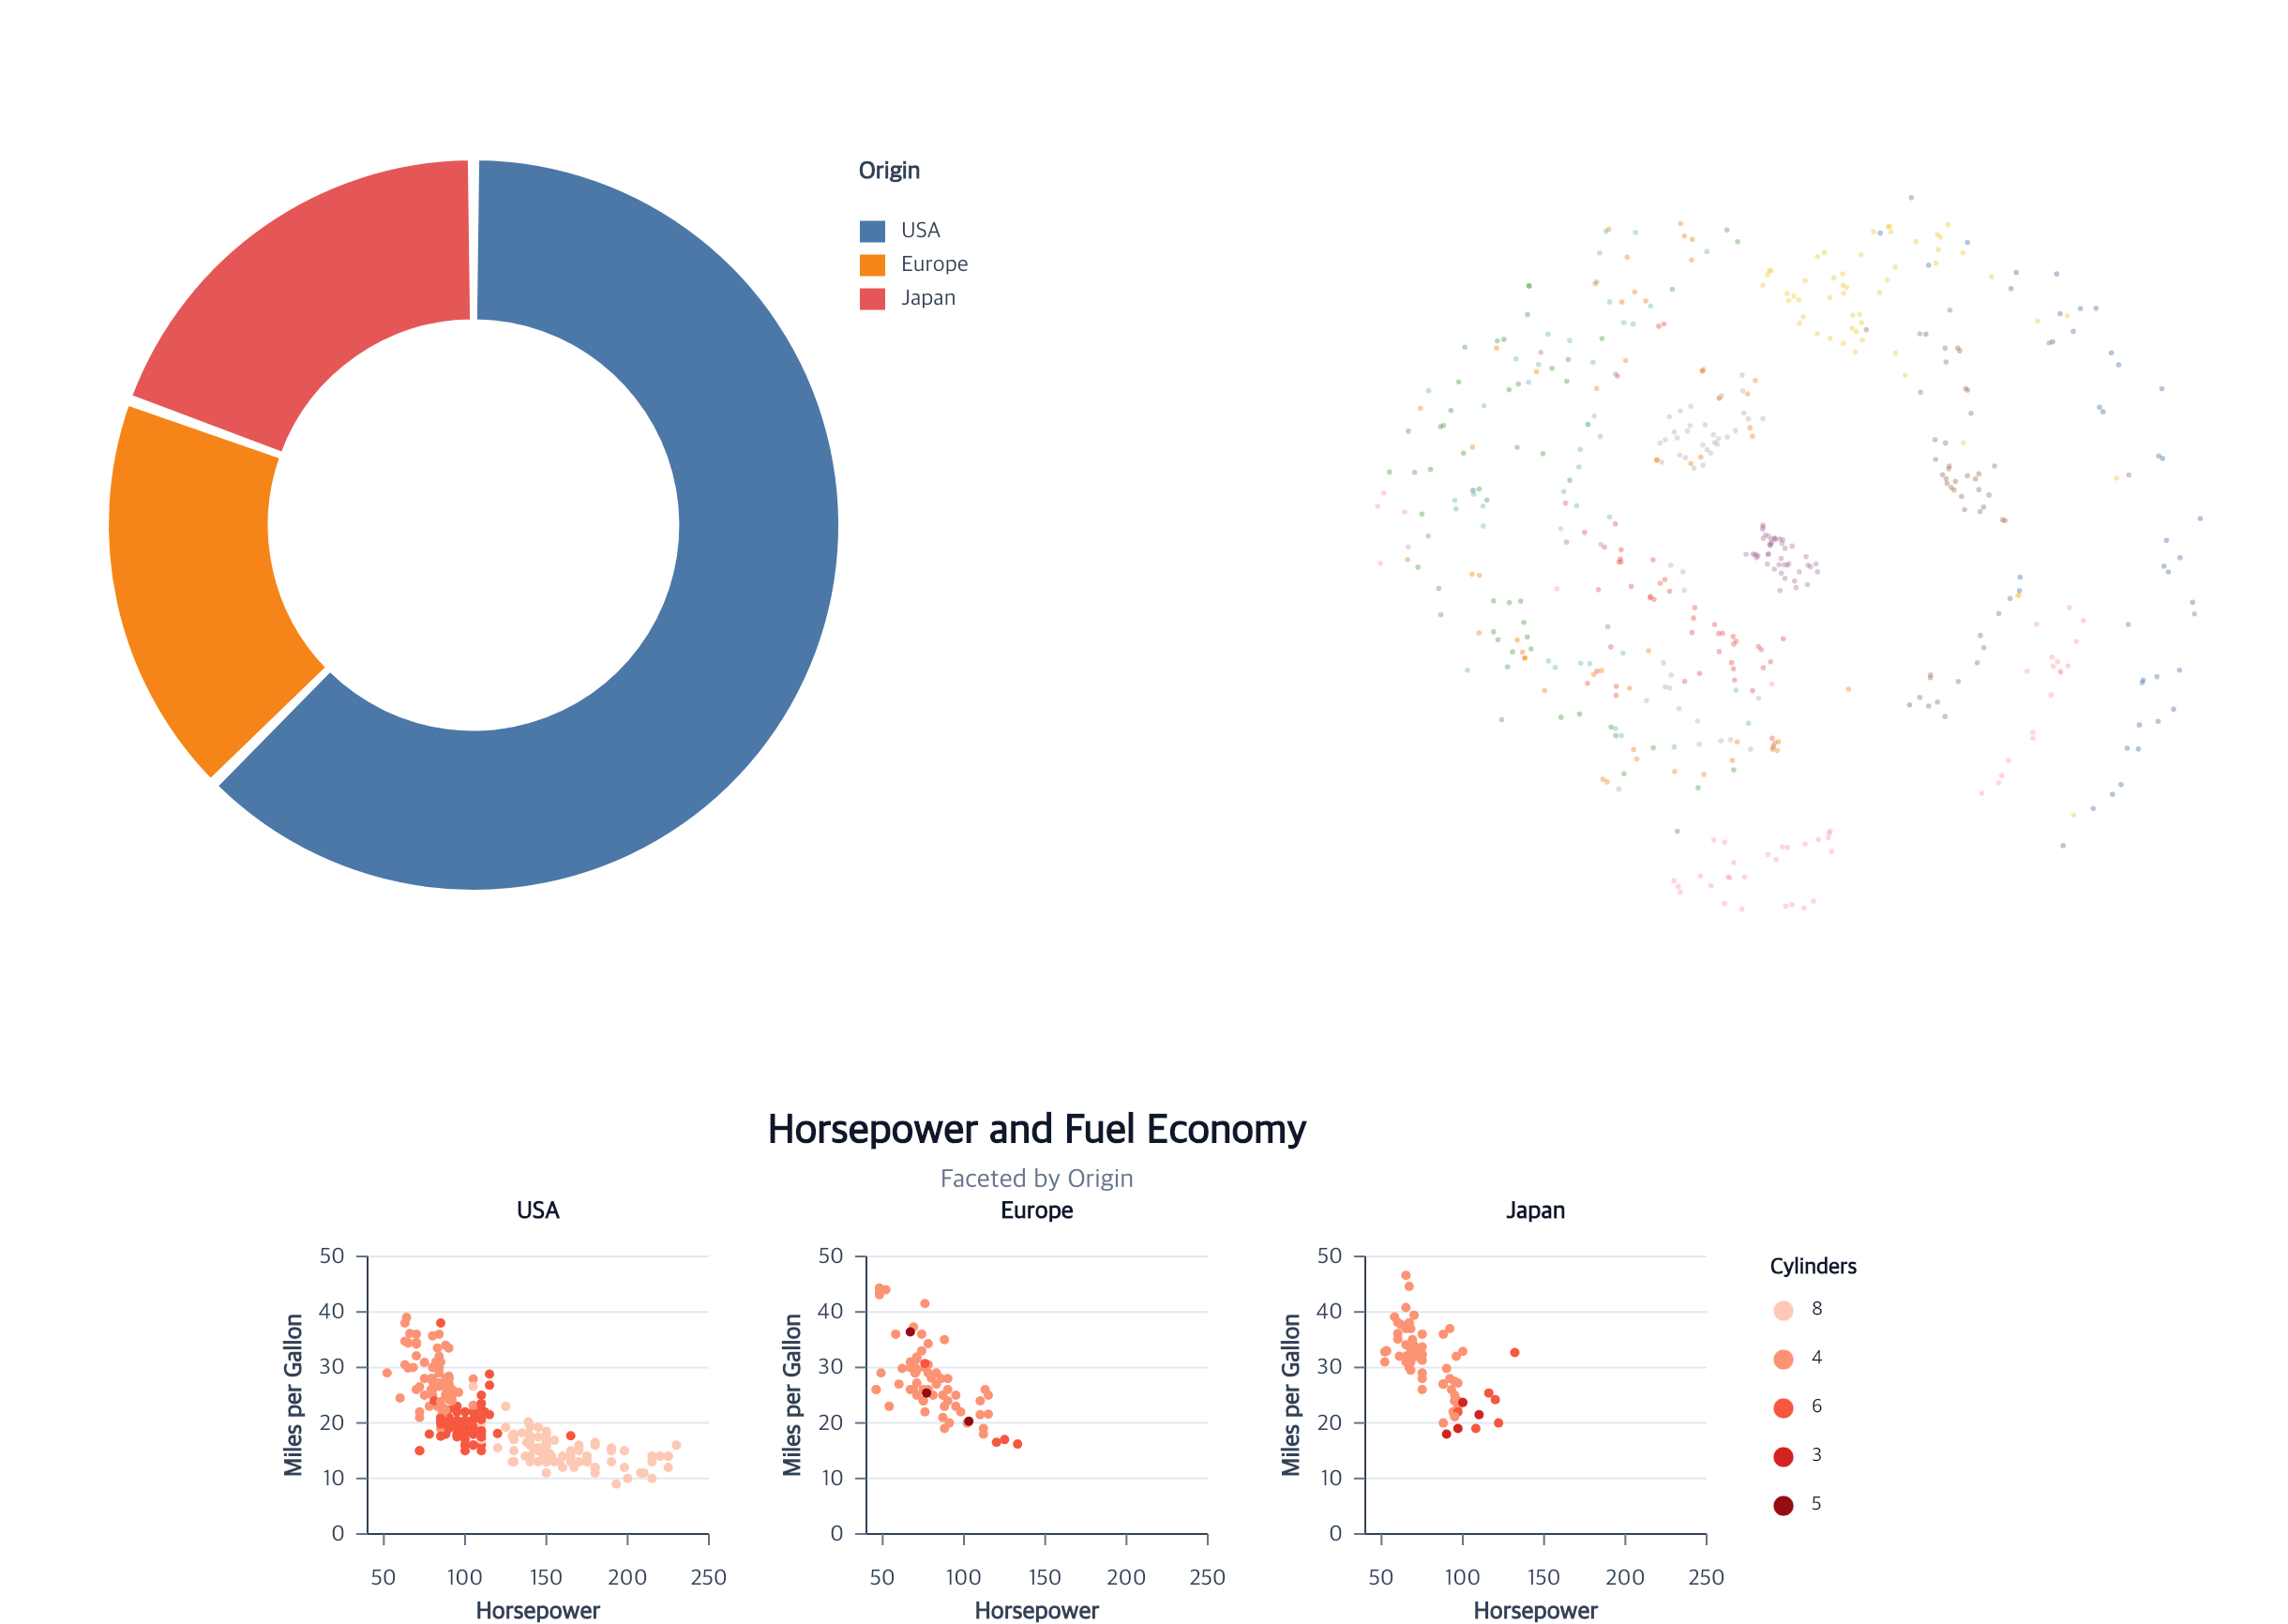
Complete statistical and coordinate-specific programs form a nested dashboard.
facet
editCompositionLayout
View full size
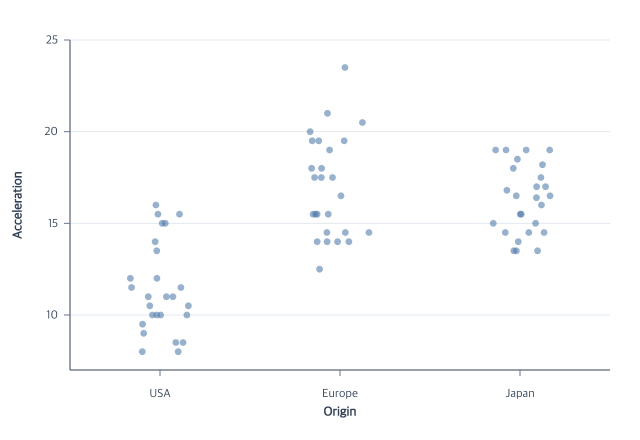
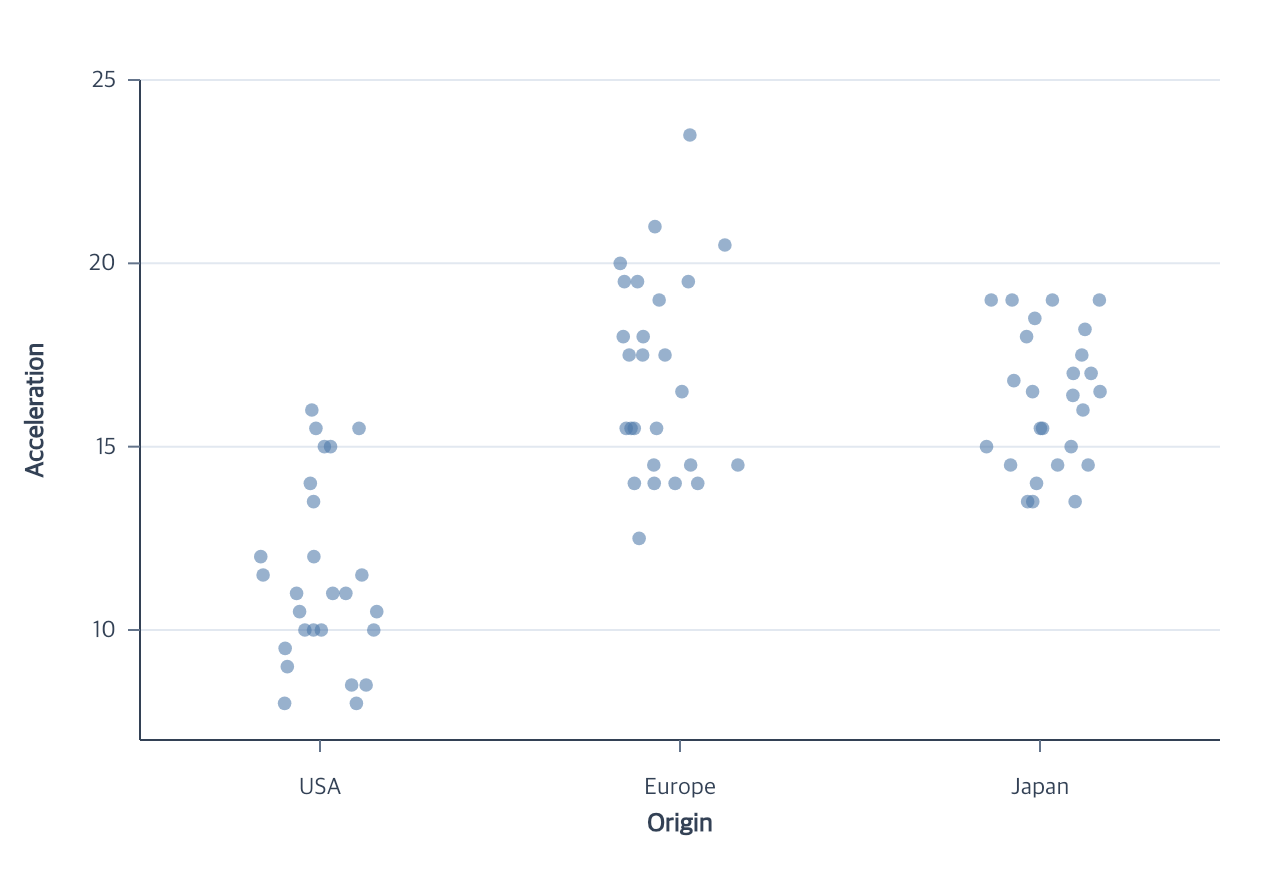
Bounded deterministic offsets separate overlapping observations inside category slots.
createStripPlot
View full size
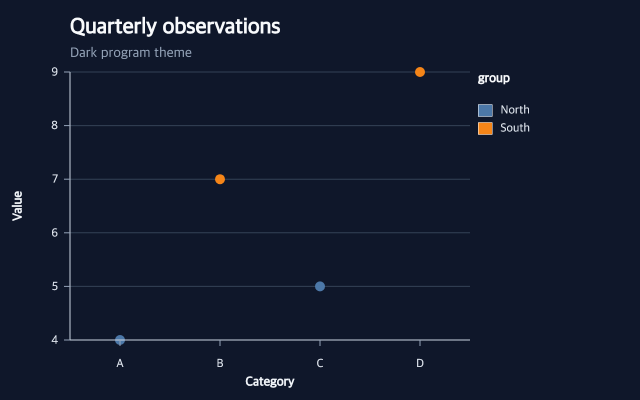
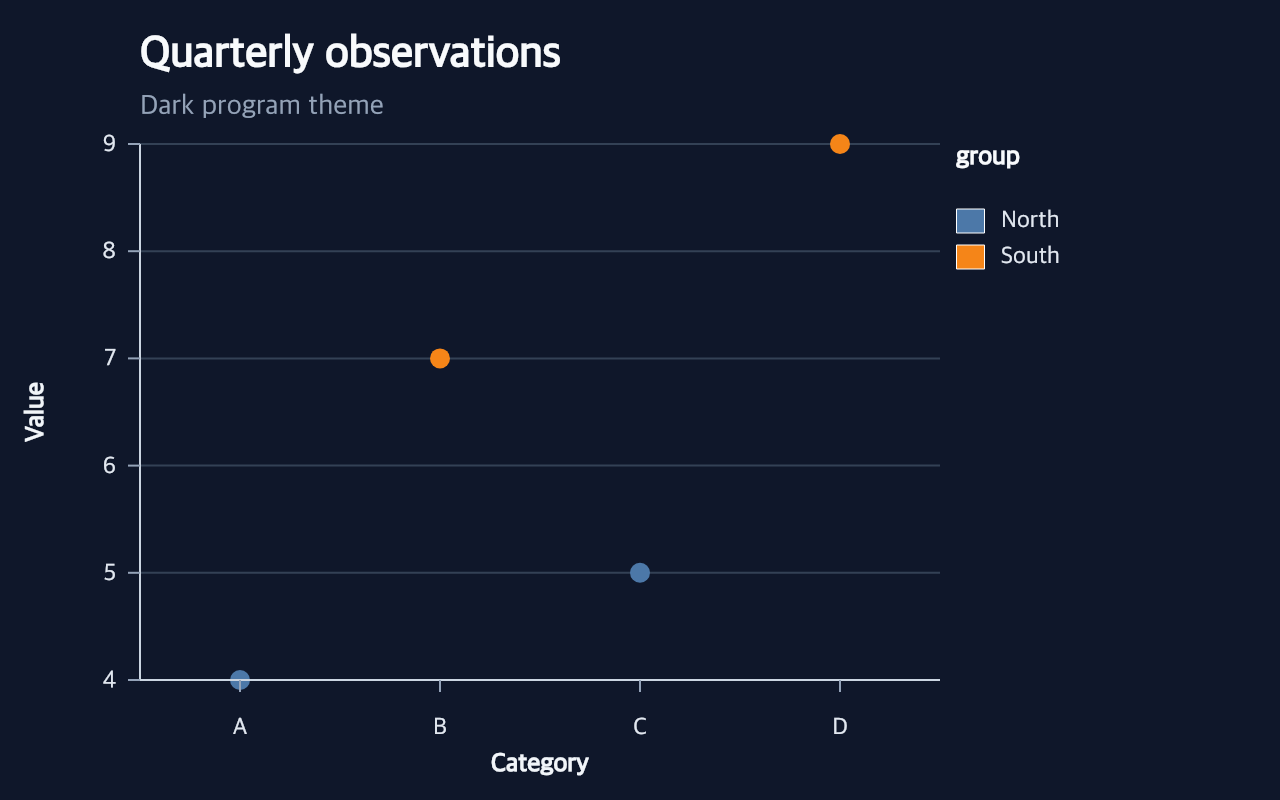
A program theme changes default canvas, guide, and mark appearance together.
createPointMark
encodeX
encodeY
View full size
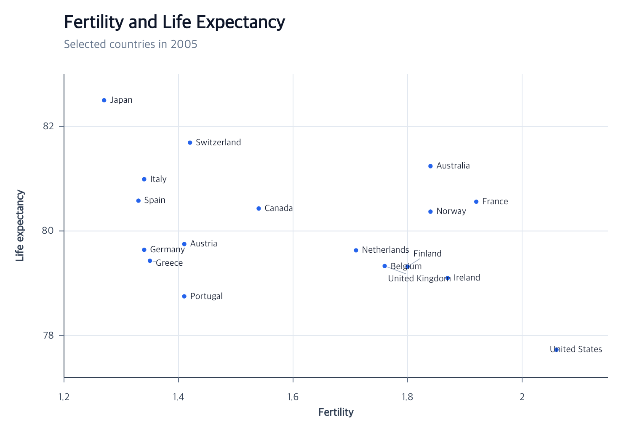
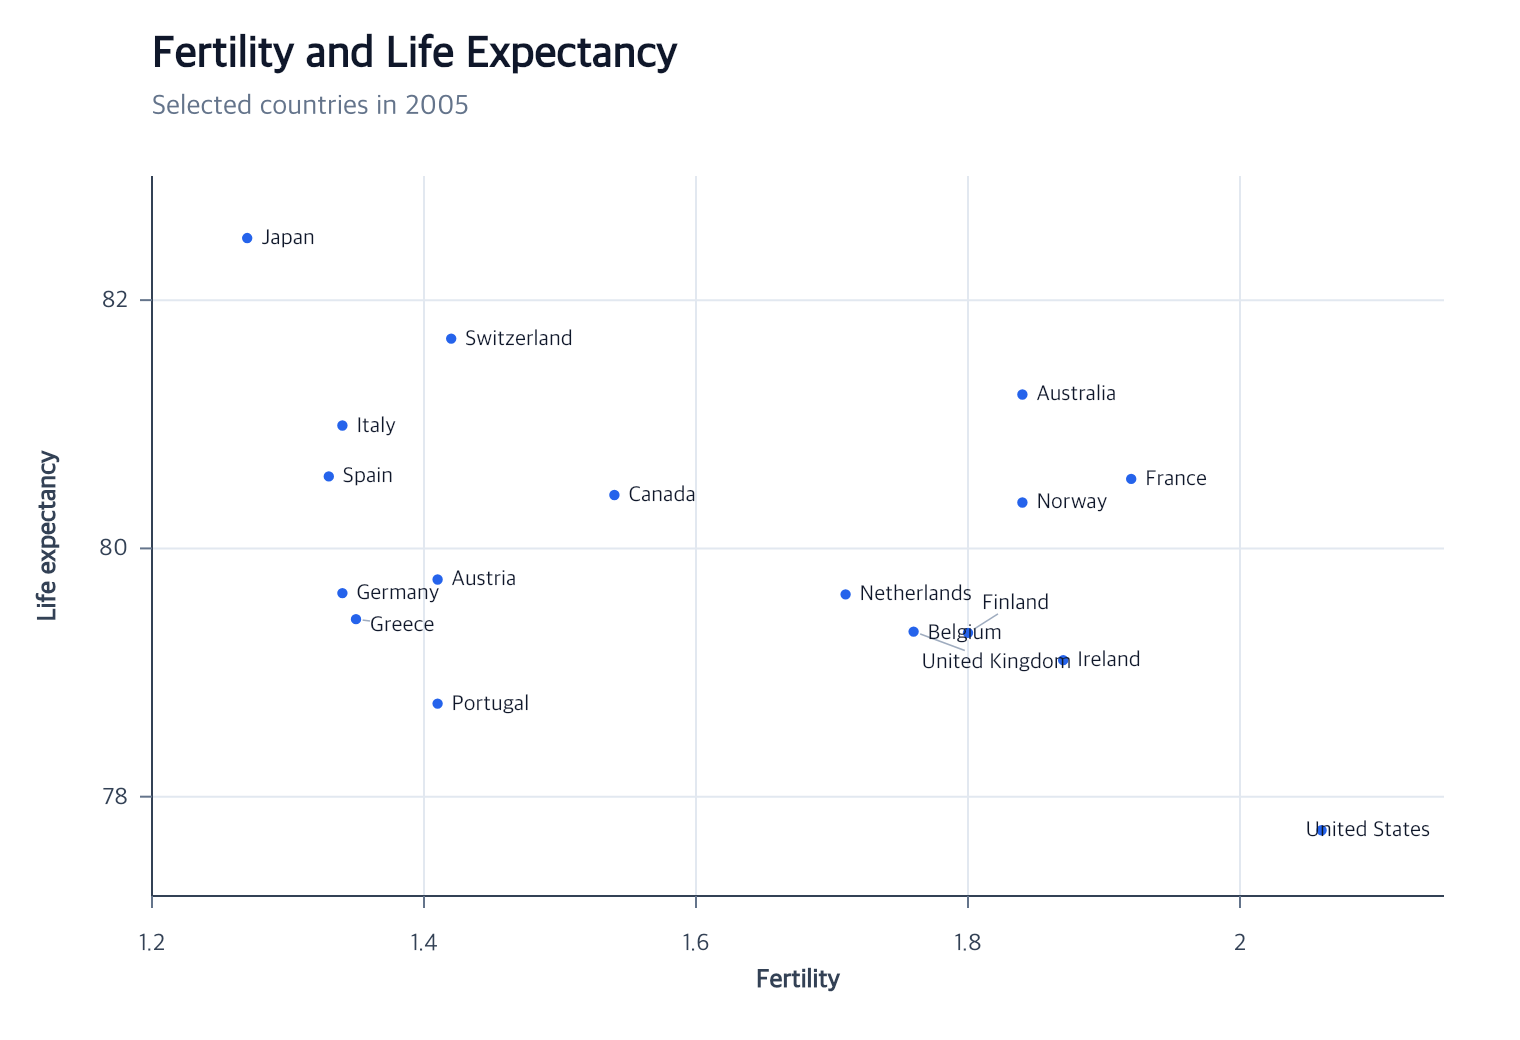
Attached labels use bounded collision layout and leader lines.
createPointMark
encodeX
encodeY
View full size
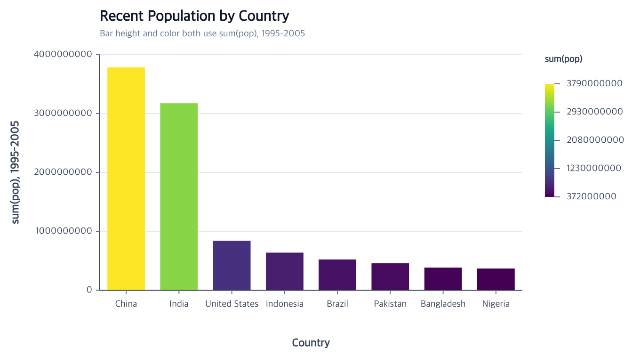
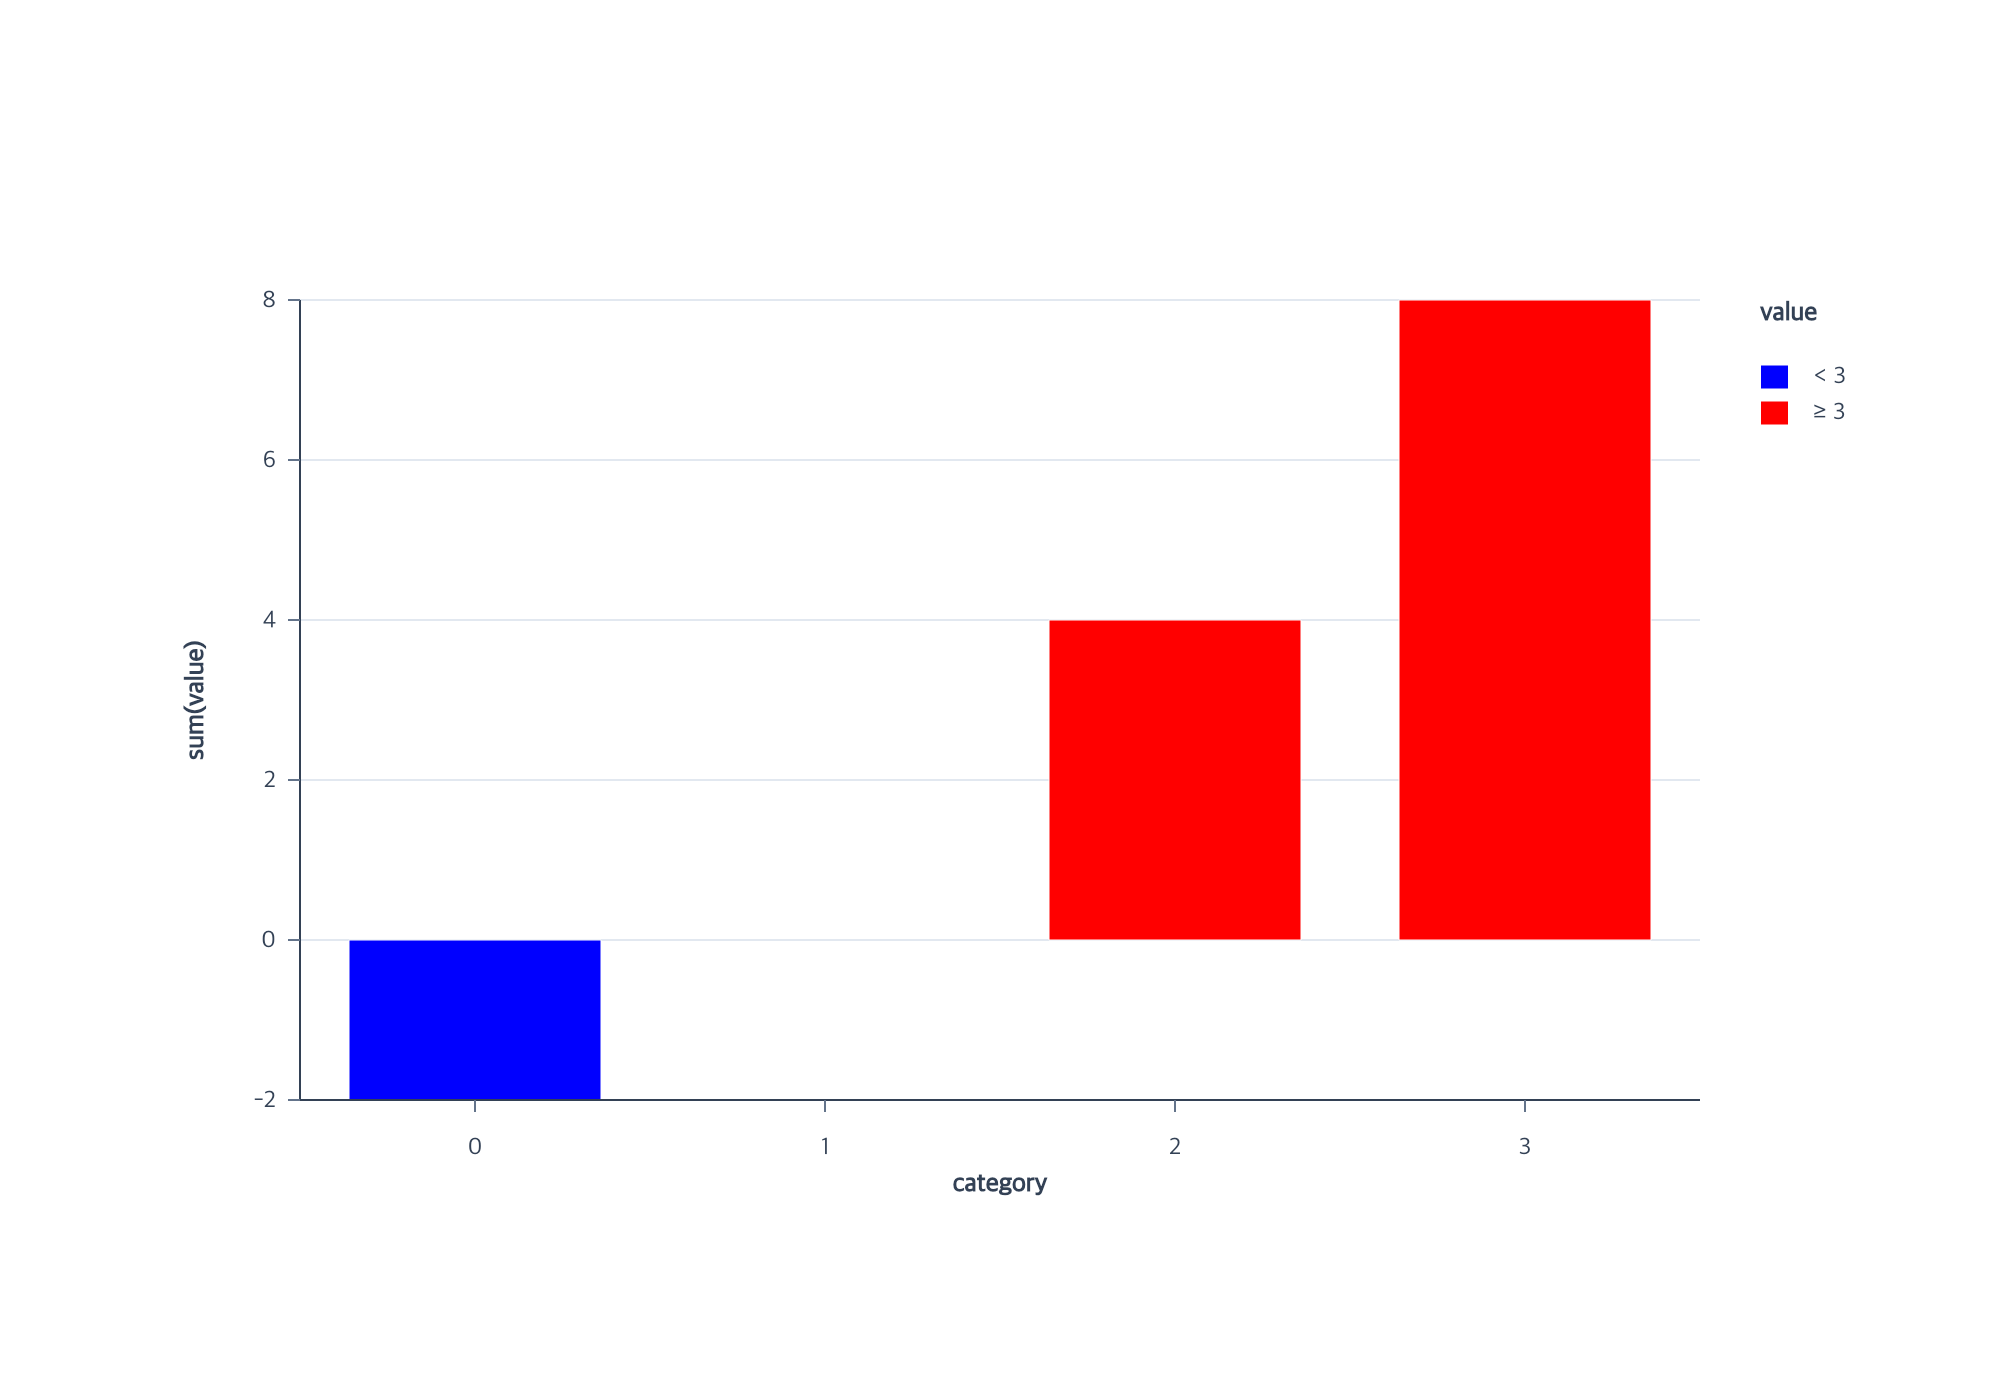
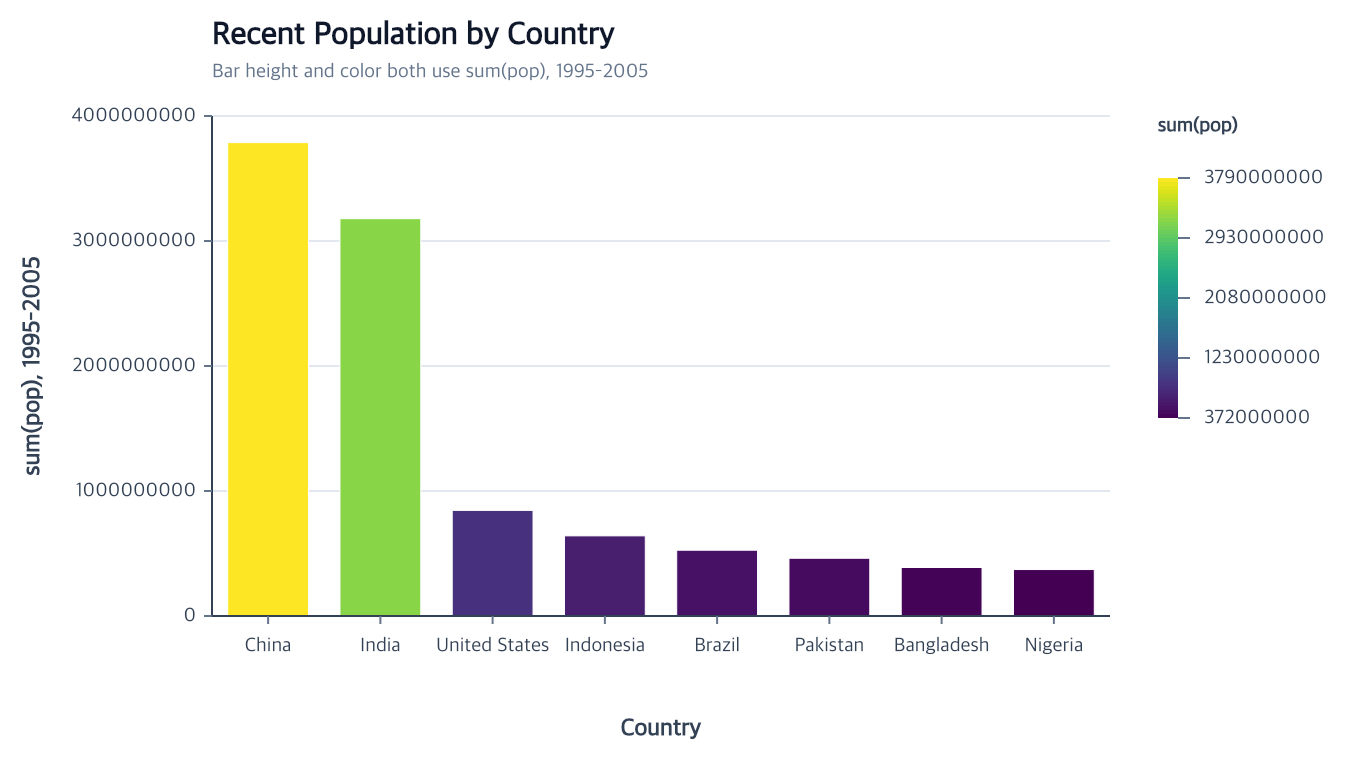
A quantitative color scale maps a compatible aggregate for each bar.
filterData
createBarMark
encodeX
View full size
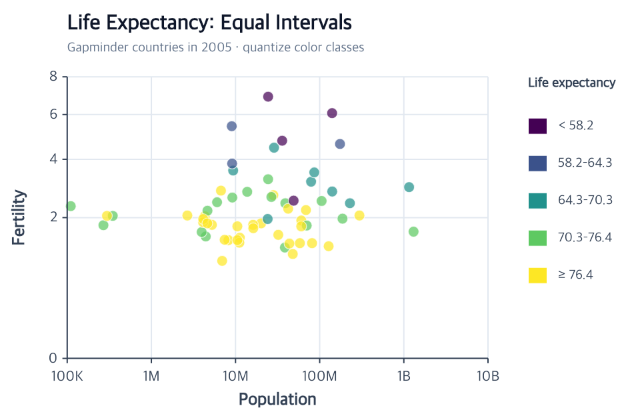
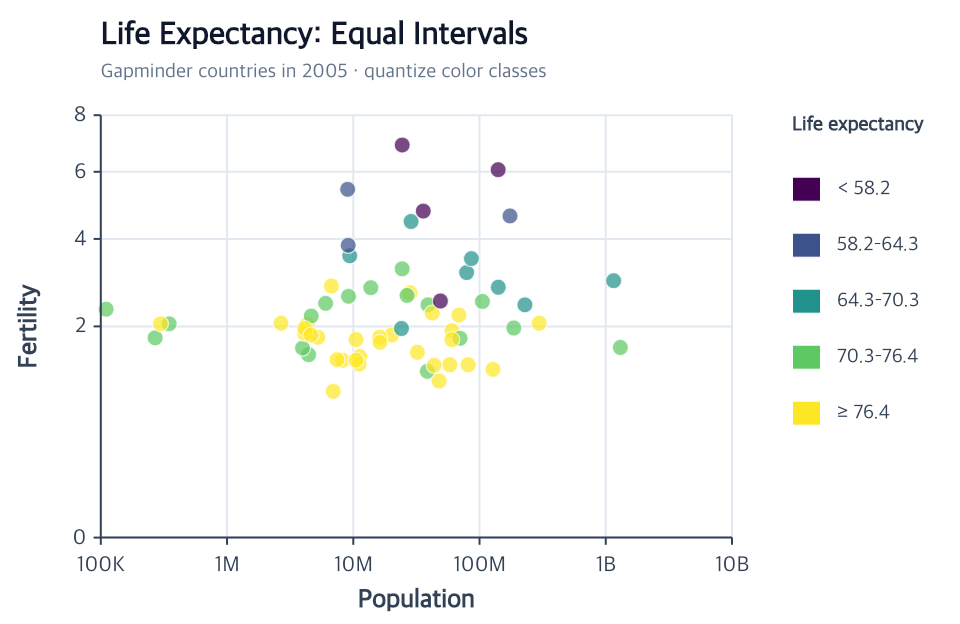
Quantitative observations map to ordered color intervals and legend labels.
filterData
createPointMark
encodeX
View full size
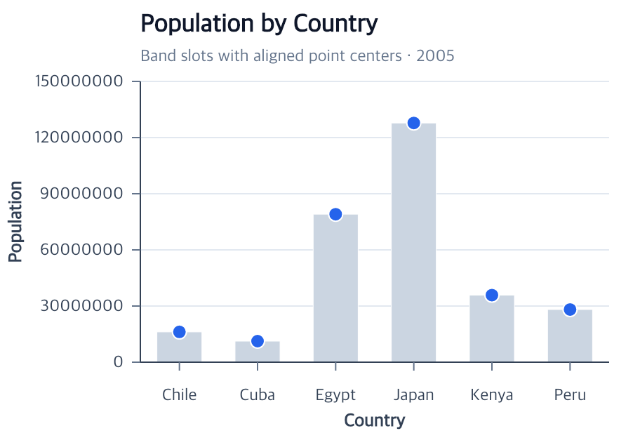
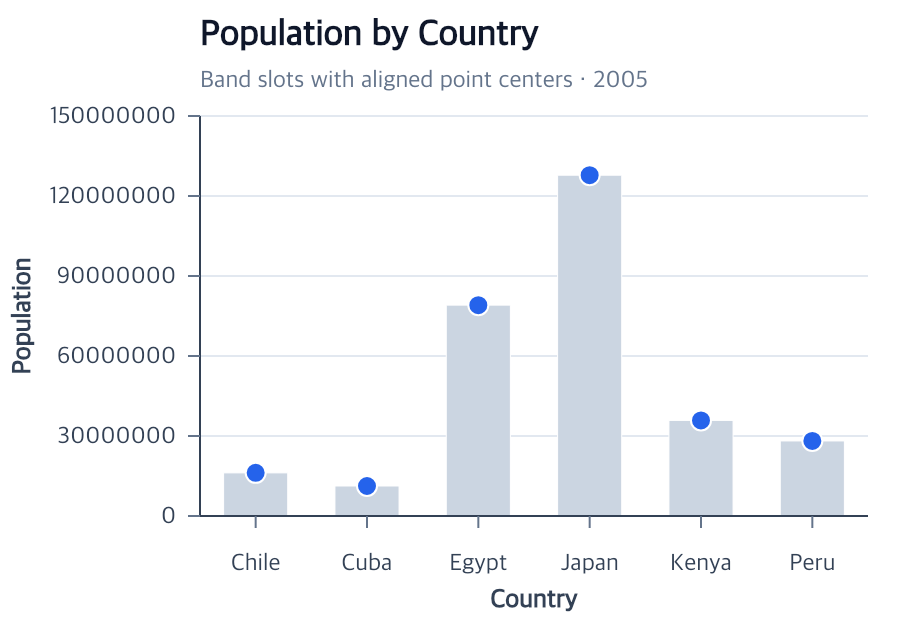
Band, point, and temporal mappings retain distinct positional meanings.
filterData
createBarMark
encodeX
View full size
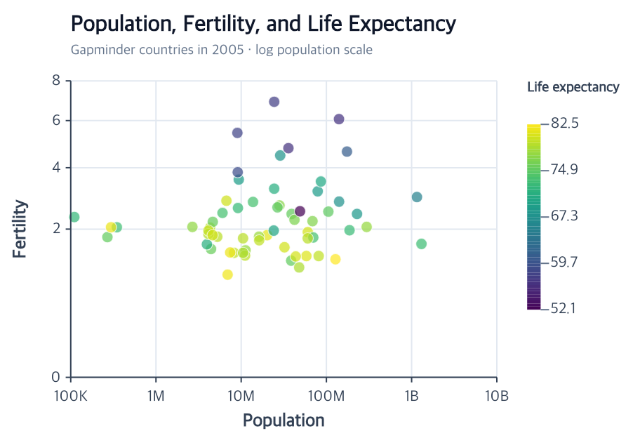
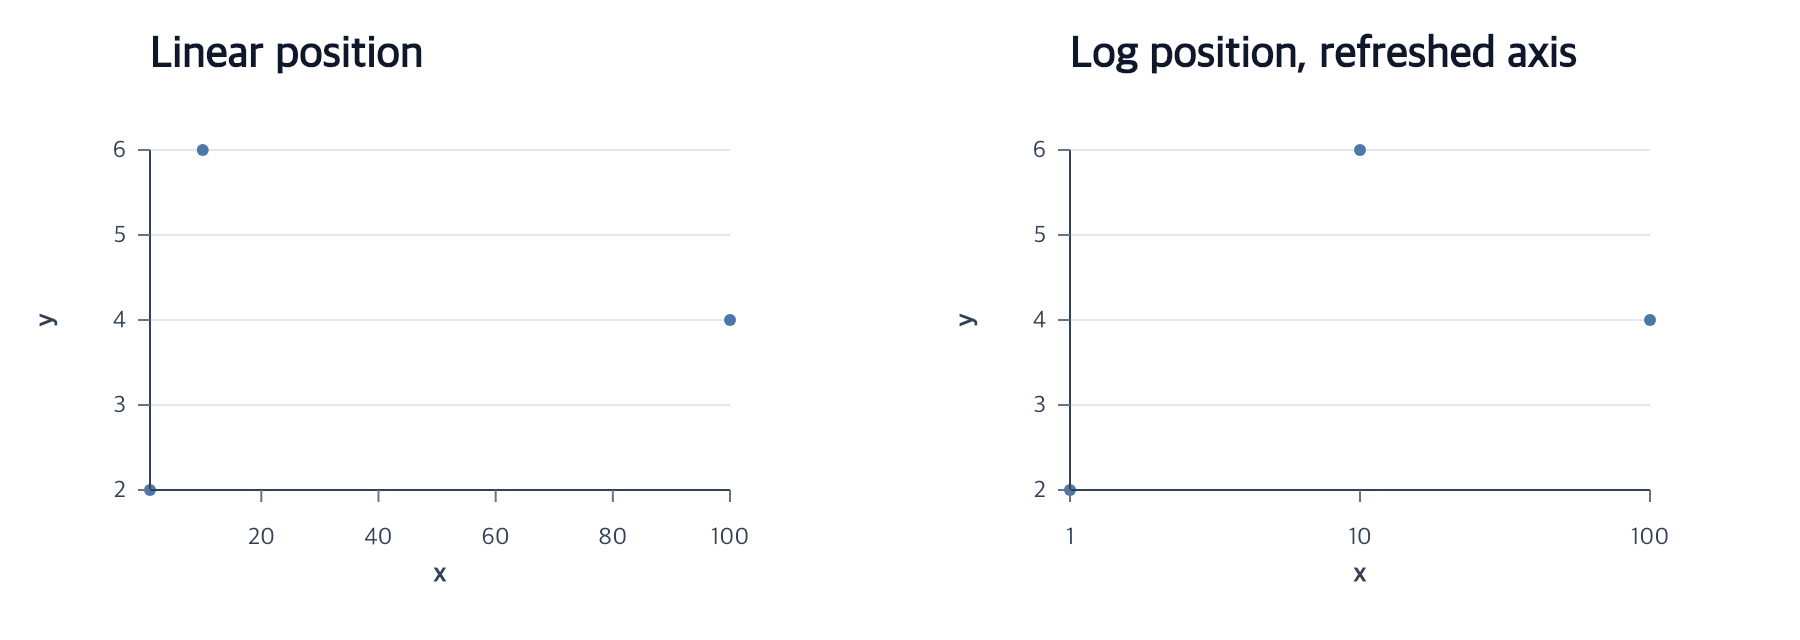
Nonlinear position scales compare measurements over unequal numeric ranges.
filterData
createPointMark
encodeX
View full size
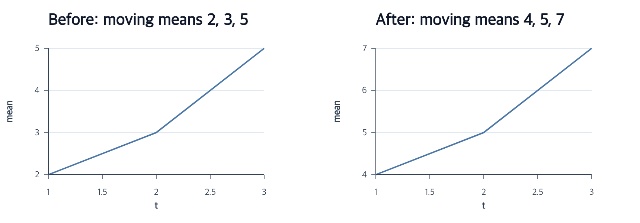
Repair missing observations with explicit inputs and immutable program revisions.
createWindowData
createLinePlot
bindMarkData
View full size
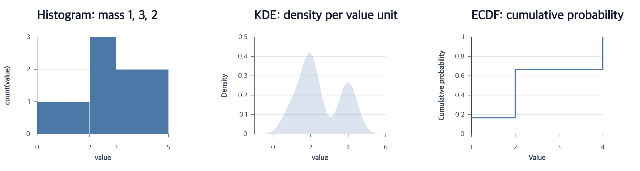
Compare weighted distributions with explicit inputs and immutable program revisions.
createHistogram
createDensityPlot
createECDFPlot
View full size
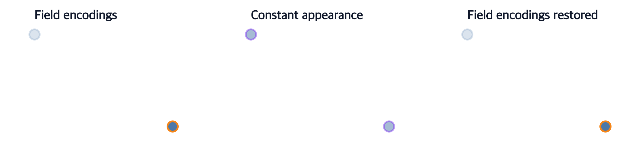
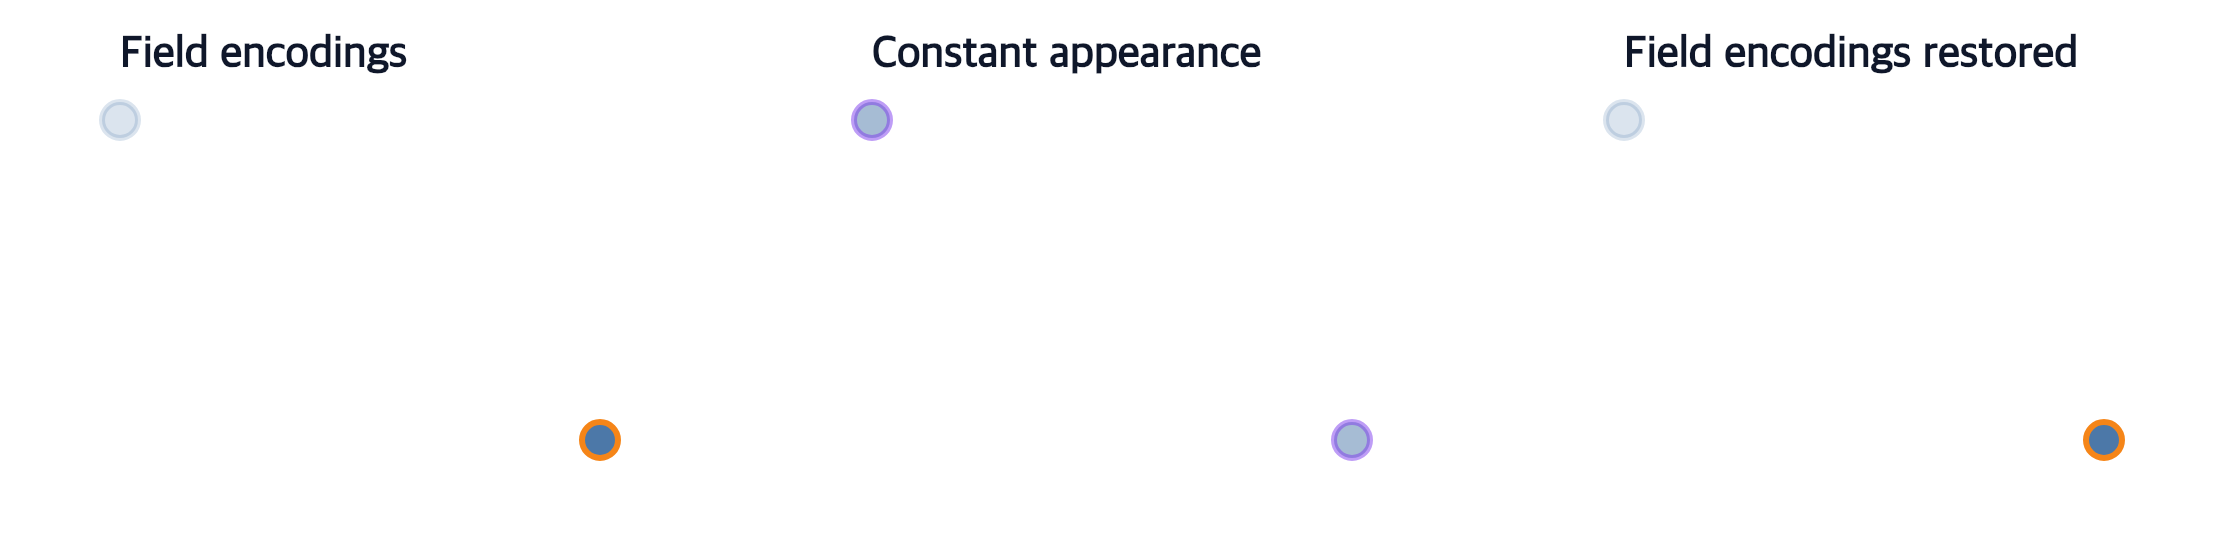
Switch encoding modes atomically with explicit inputs and immutable program revisions.
createScatterPlot
encodeChannels
View full size
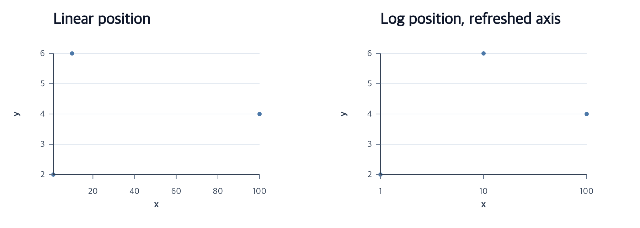
Edit scales and refresh guides with explicit inputs and immutable program revisions.
createScatterPlot
editXScale
editXAxis
View full size
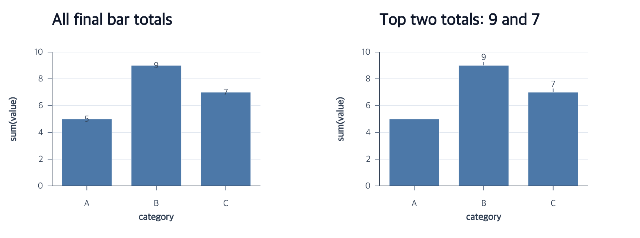
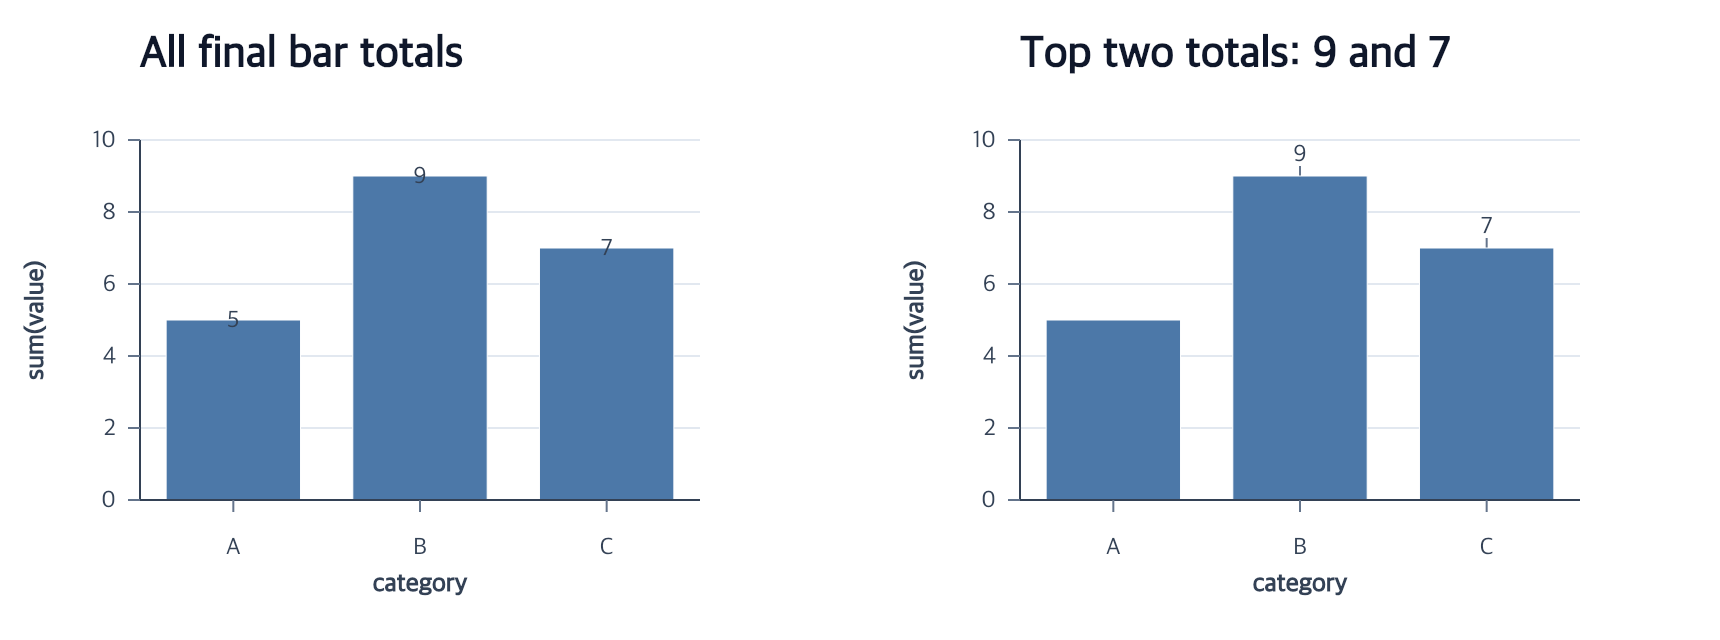
Select and place final-item labels with explicit inputs and immutable program revisions.
editMarkLabelSelection
editMarkLabelPlacement
layoutLabels
View full size
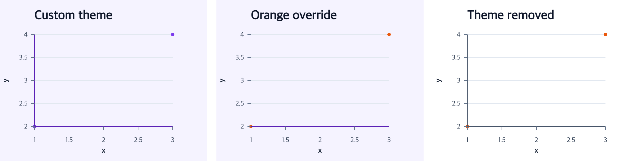
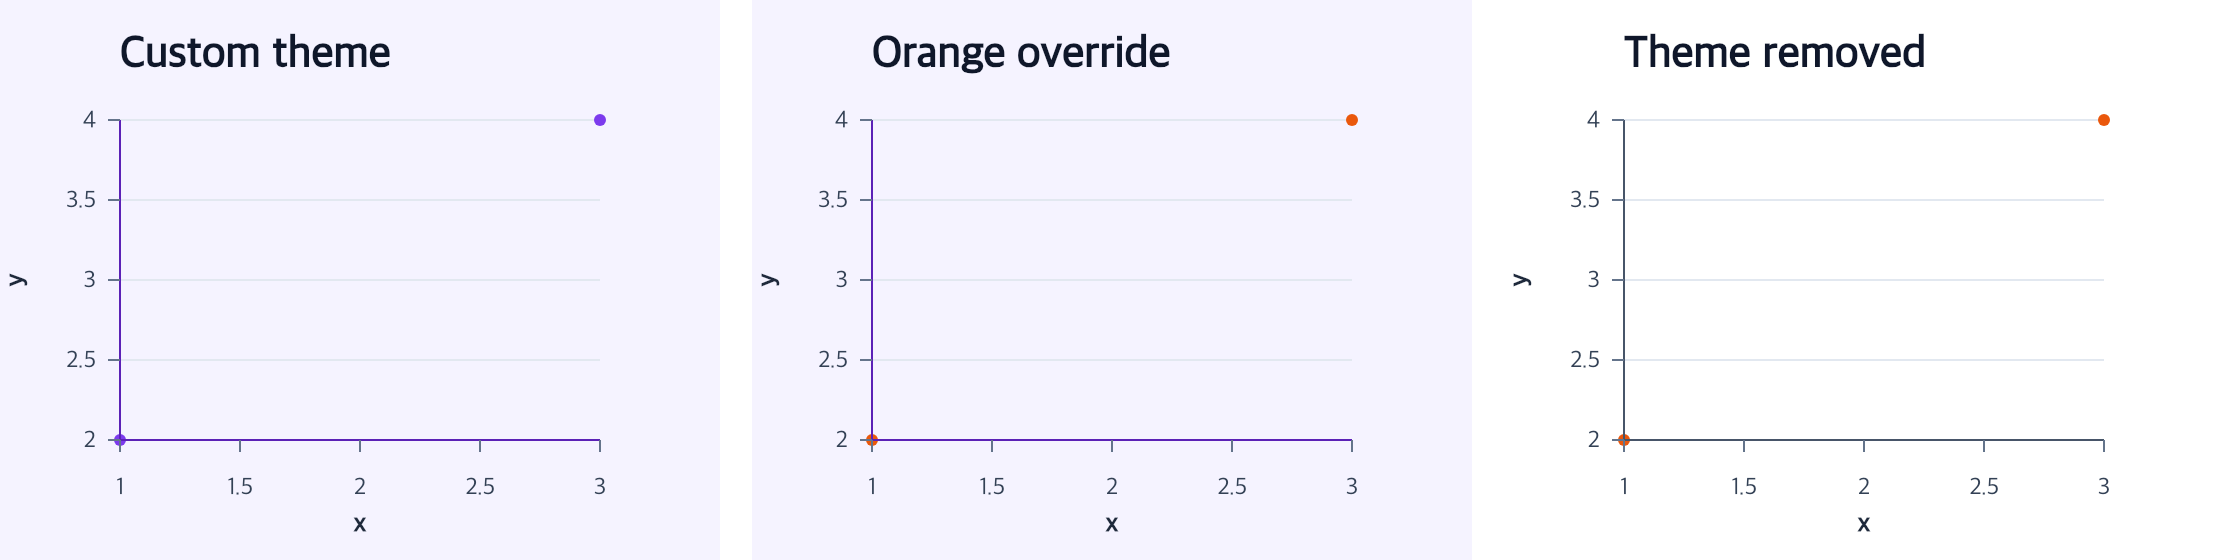
Apply, override, and remove a theme with explicit inputs and immutable program revisions.
applyTheme
editPointMark
removeTheme
View full size
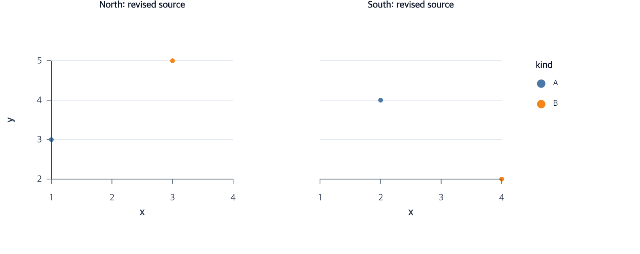
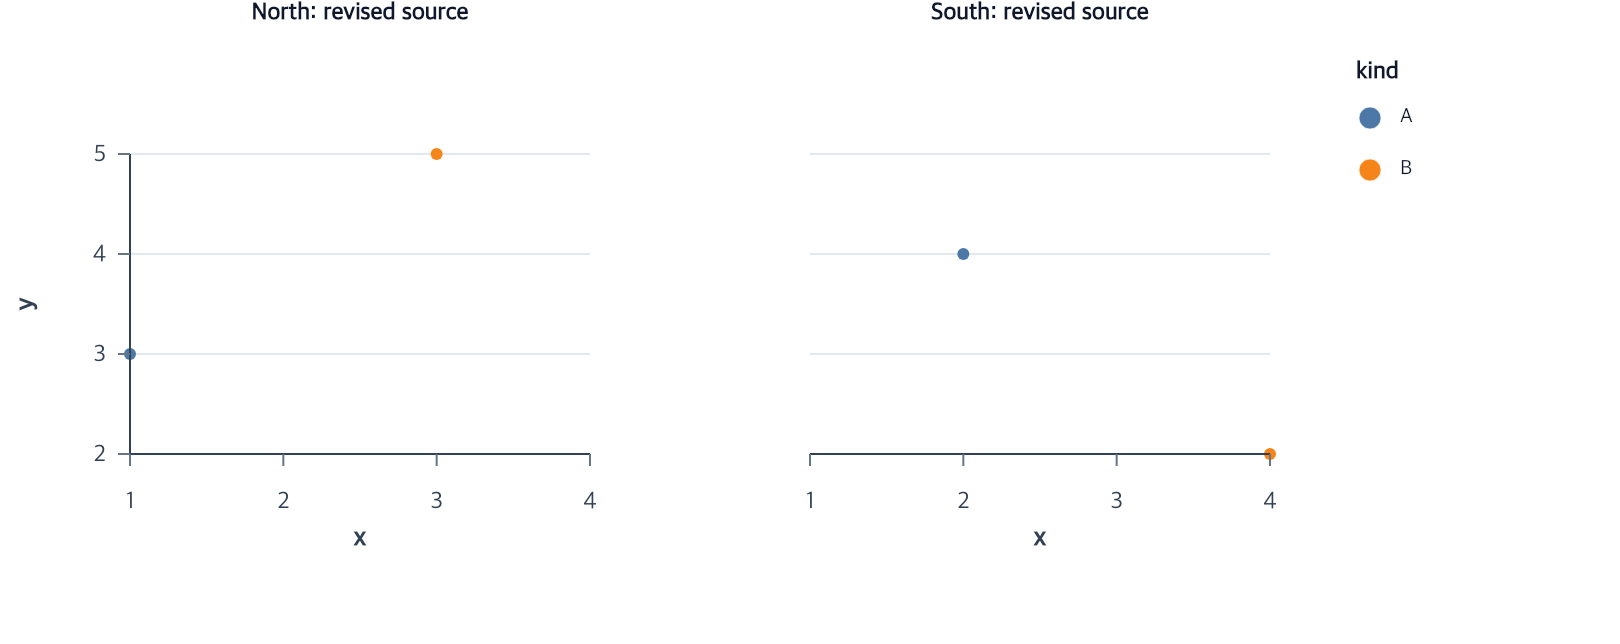
Revise facet source and shared guides with explicit inputs and immutable program revisions.
editFacetSource
editFacetHeaders
editFacetGuides
View full size
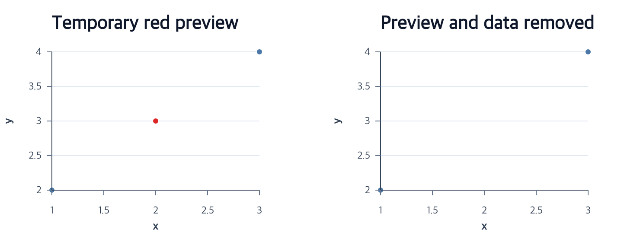
Remove resources in dependency order with explicit inputs and immutable program revisions.
encodeY
removeData
removeMark
View full size
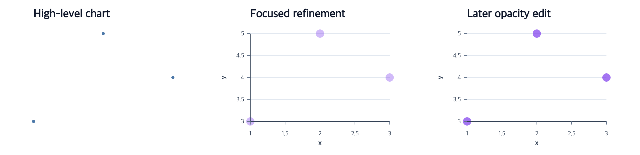
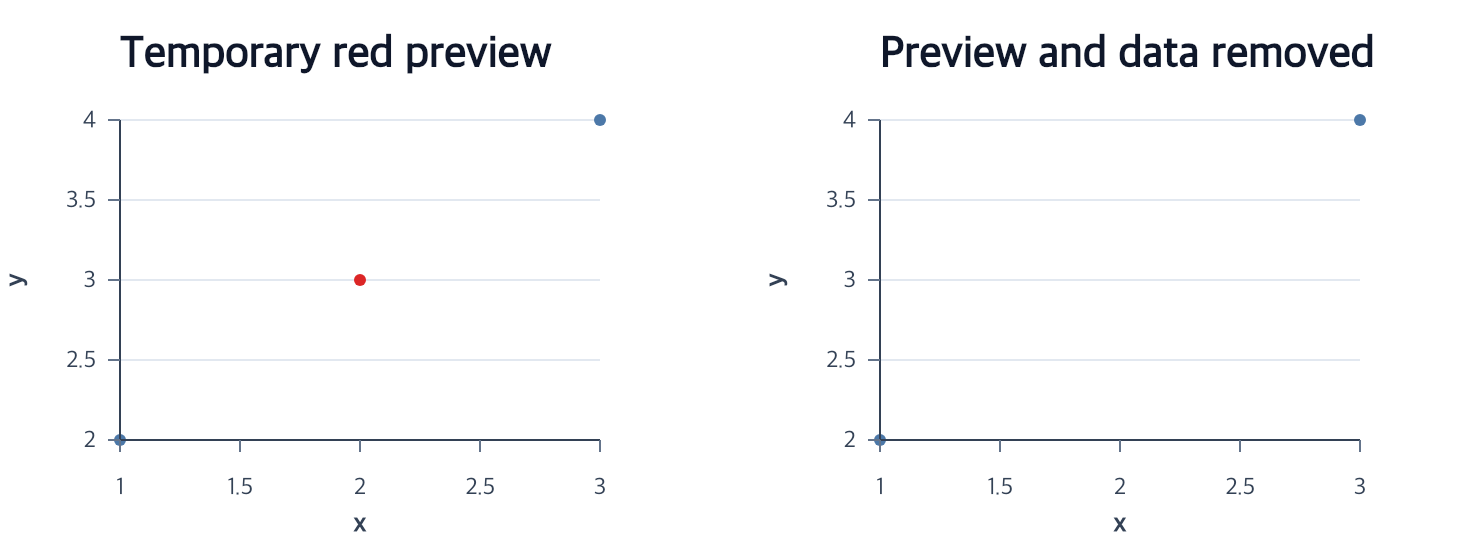
Choose the smallest action that expresses the intended chart change.
createScatterPlot
createPointMark
editPointMark
View full size
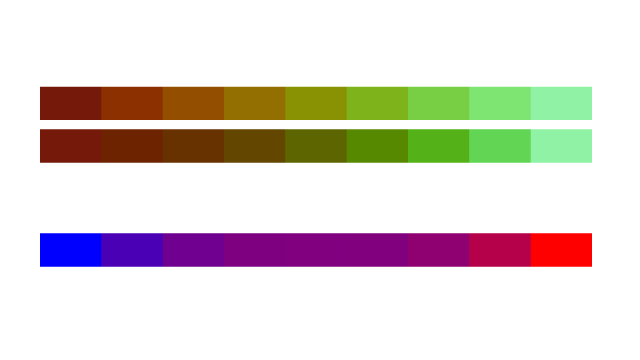
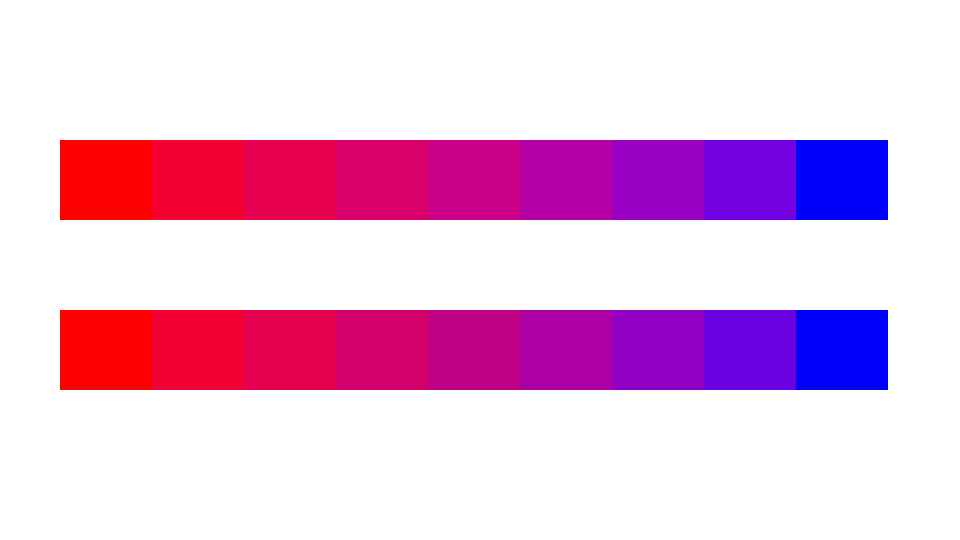
Edit lightness interpolation and transform original color values.
createRectMark
encodeColor
editColorScale
View full size
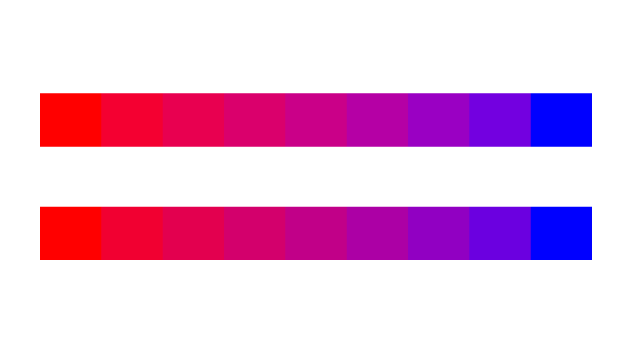
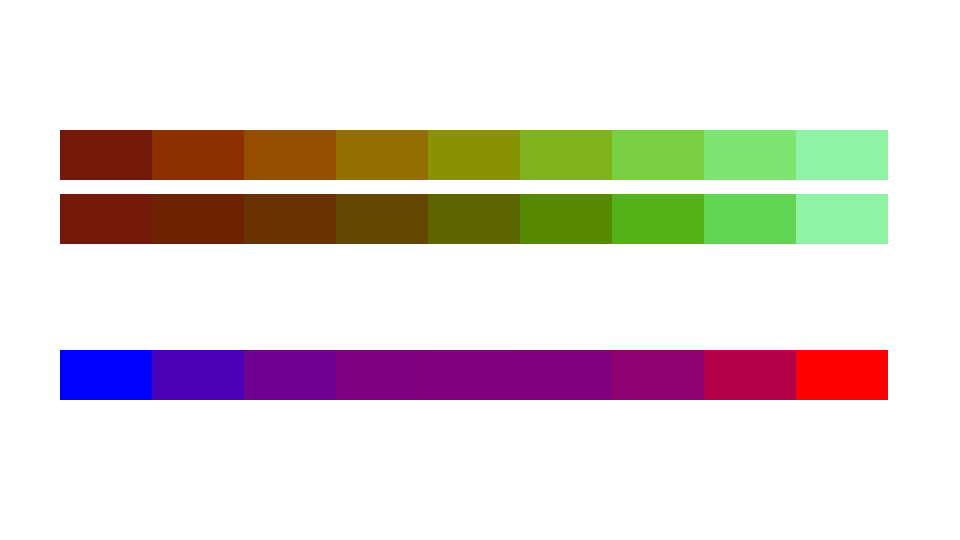
Choose a white point and edit it without changing the source values.
createRectMark
encodeColor
editColorScale
View full size
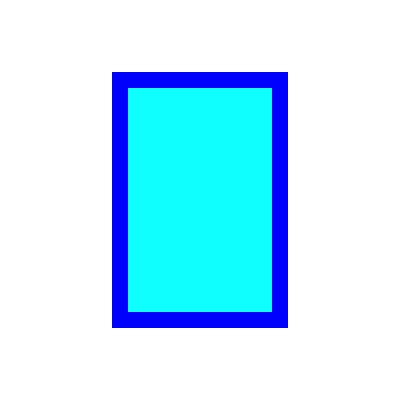
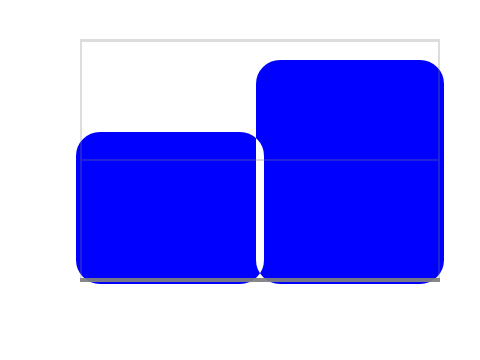
Refine a complete bar with one compositing edit.
createBarPlot
editBarMark
View full size
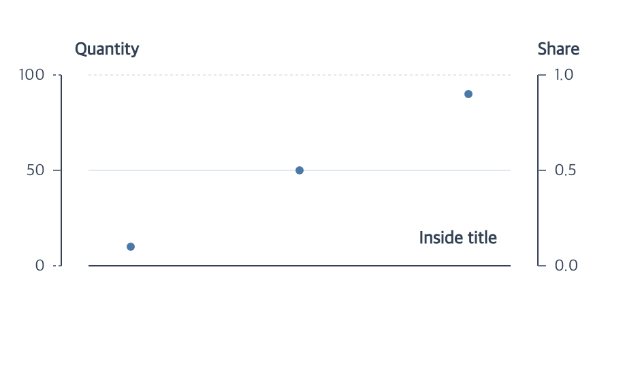
Create complete named axes before focused placement and text edits.
createAxes
editYAxis
editYAxisLabels
View full size
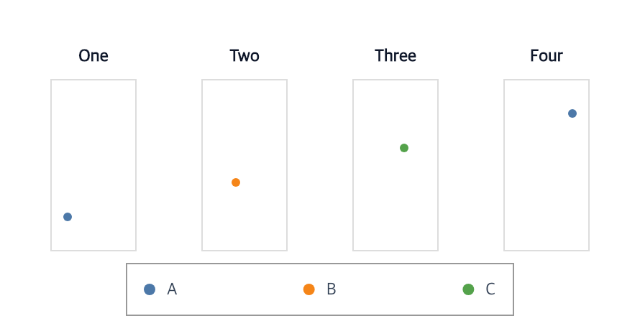
Declare and edit one parent legend across a repeated chart.
facet
editLegendLayout
View full size
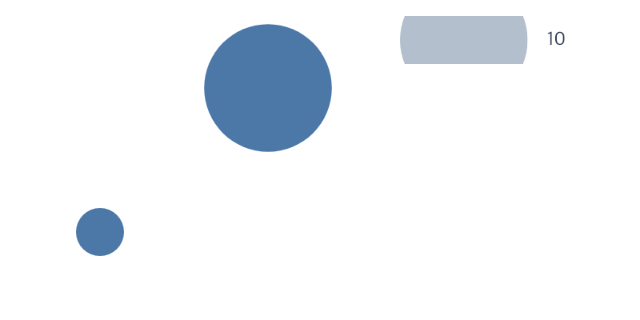
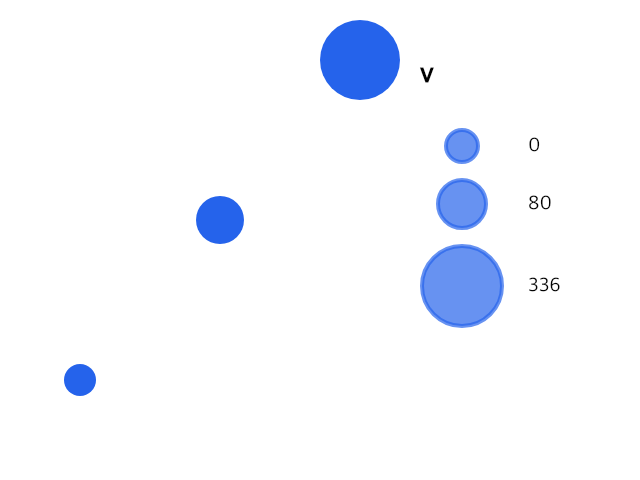
Clip an oversized sample without changing its physical area.
encodeSize
createLegend
editLegendSymbols
View full size
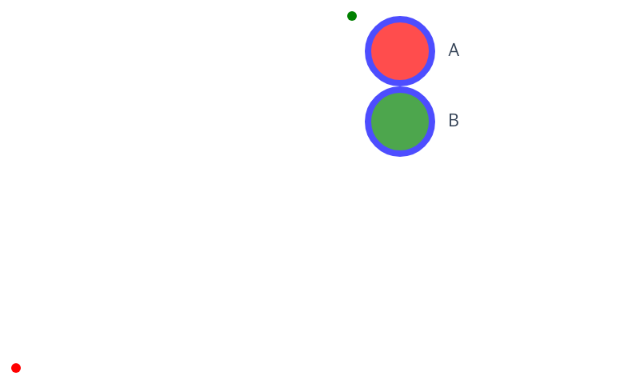
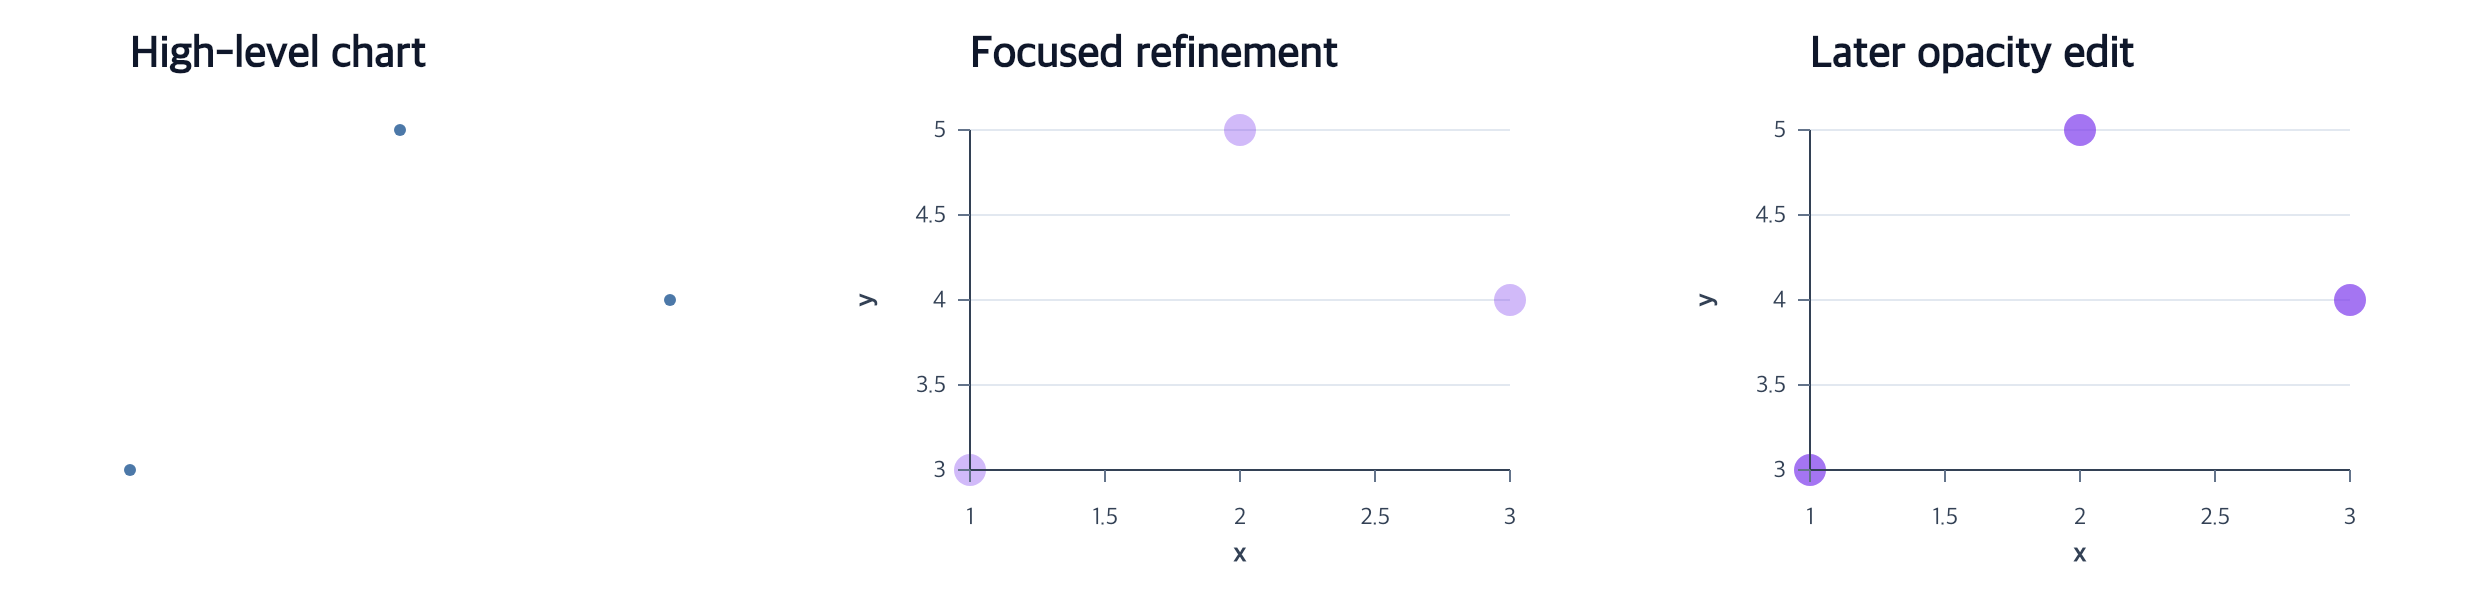
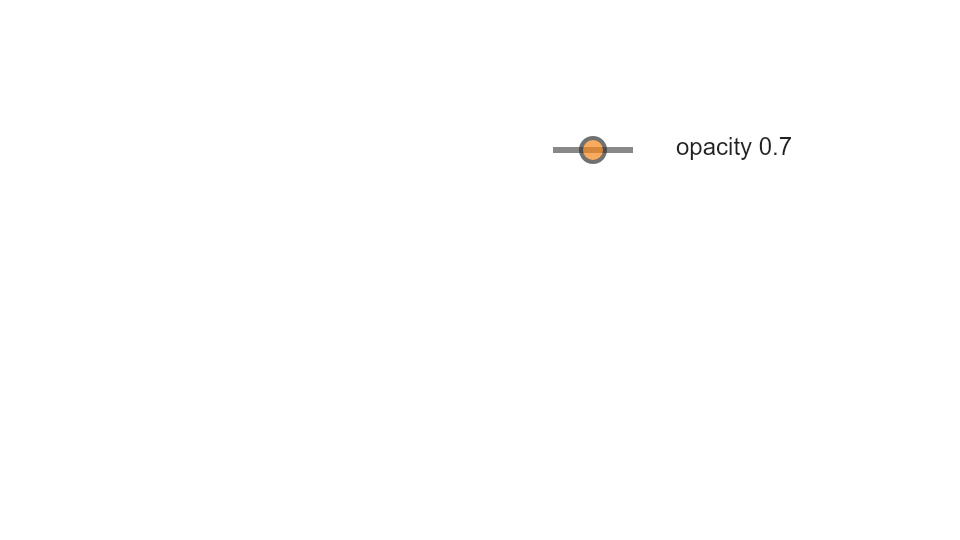
Apply opacity to one recipe layer while retaining labels and mapped colors.
createLegend
editLegendSymbols
View full size
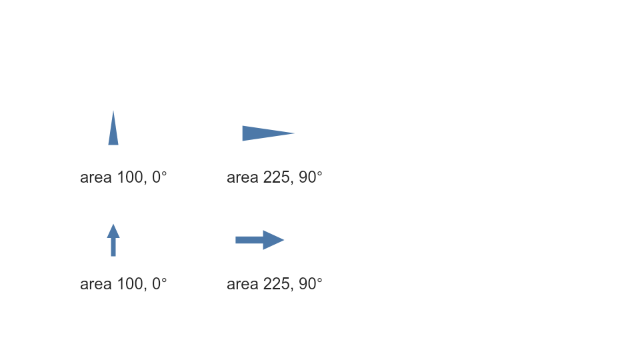
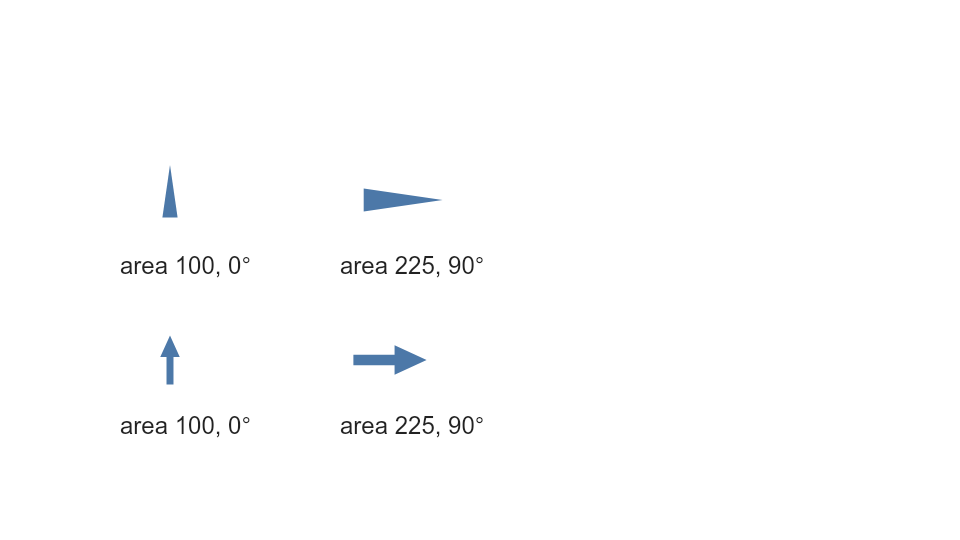
Refine a complete scatterplot with shape, physical area and angle encodings.
createScatterPlot
encodeShape
encodeSize
encodeAngle
View full size
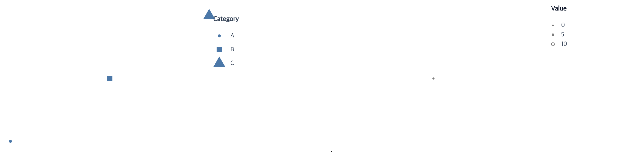
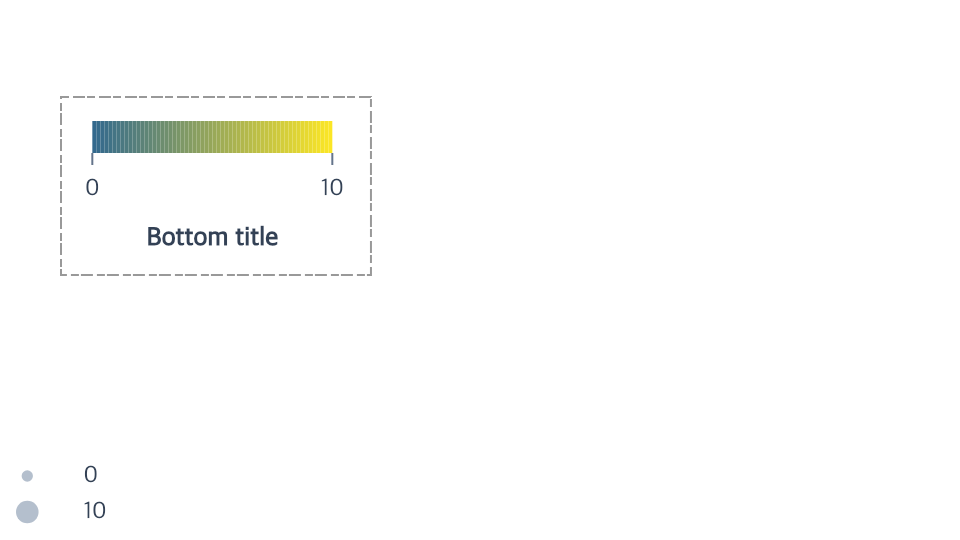
Combine compatible quantitative color and size without changing mark data.
encodeColor
encodeSize
createLegend
editLegend
View full size
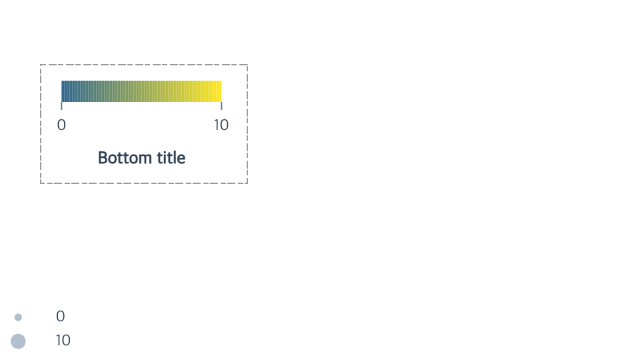
Start with legend blocks, then edit orientation, title, border and one local anchor.
createLegend
editLegendLayout
editLegendBorder
editLegendBlock
View full size
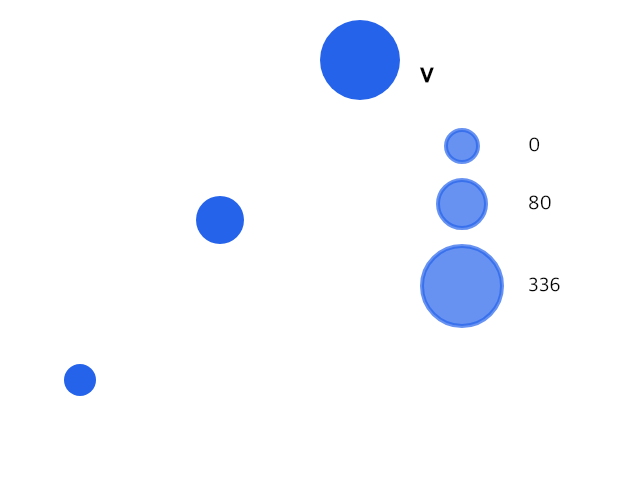
Set occupied row gaps separately from title padding and legacy center pitch.
createLegend
editLegendLayout
View full size
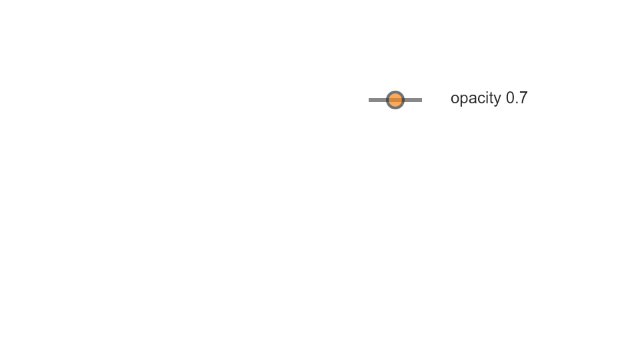
Style an existing legend with a complete line and point recipe.
createLegend
editLegendLabels
editLegendSymbols
View full size
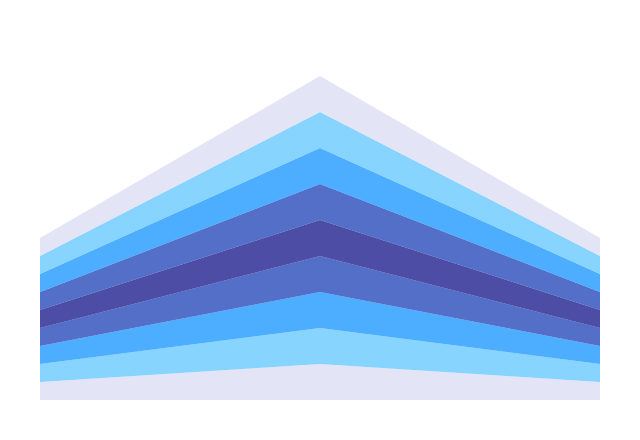
Declare complete areas and refine color independently from series layout.
createAreaPlot
encodeGroup
encodeColor
layoutSeries
View full size
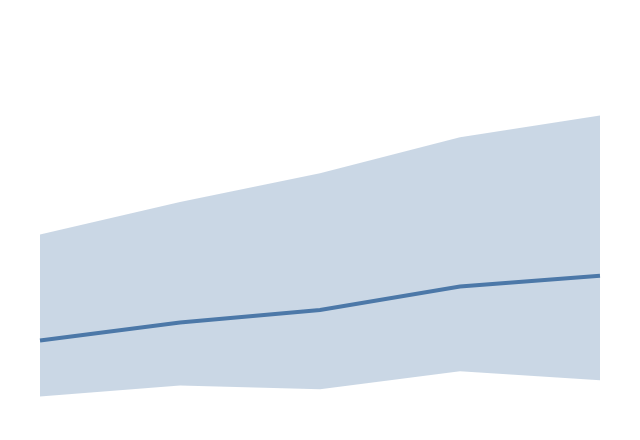
Preserve raw observations and calculate reusable asymmetric intervals before drawing existing areas and lines.
createSummaryData
createAreaPlot
createLineMark
View full size
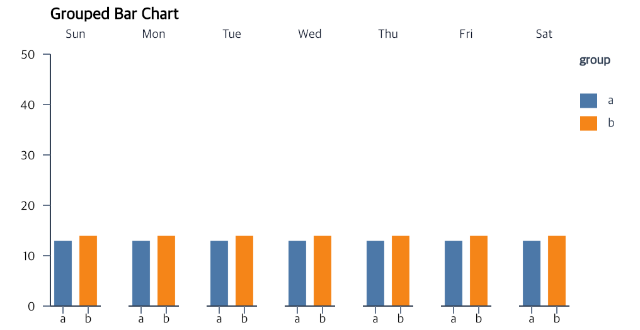
Keep fixed plot sizes while reusing existing top space for titles and facet headers.
facet
editCompositionLayout
editFacetHeaders
View full size
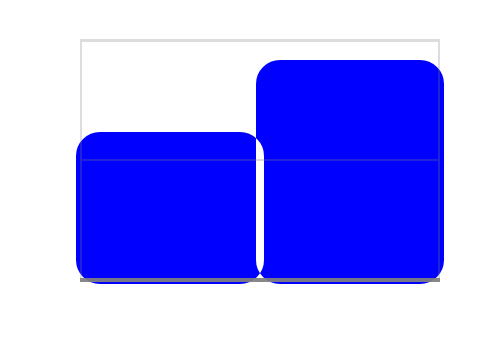
Move a complete Cartesian axis or plot border behind ordinary marks without changing geometry.
createXAxis
editXAxis
editCanvas
View full size
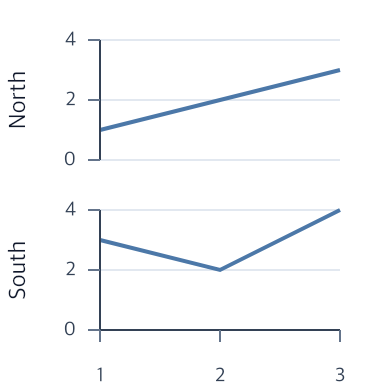
Put panel names beside their plots with an explicit header rotation.
facet
editFacetHeaders
editCompositionLayout
View full size
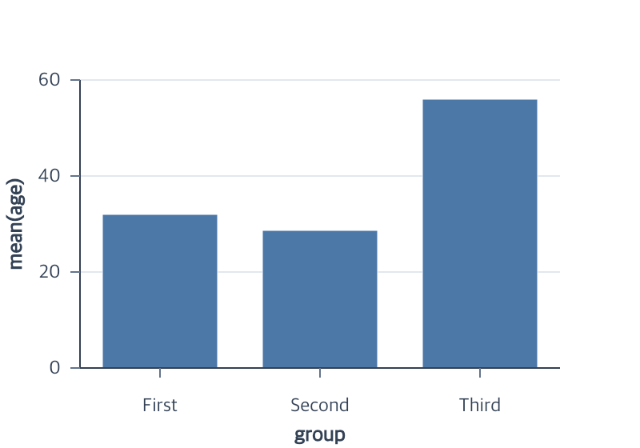
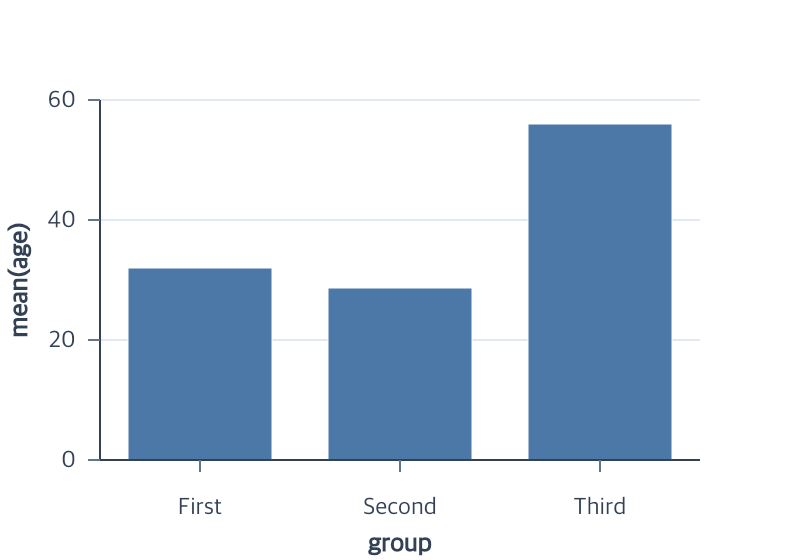
Copy typed reference values while keeping both original tables unchanged.
createData
createLookupData
createBarPlot
View full size
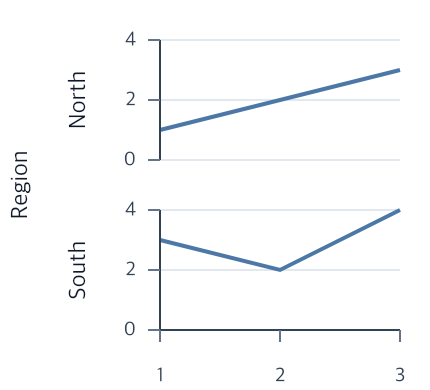
Add an independent field title to existing facet headers.
facet
editFacetHeaders
editCompositionLayout
View full size
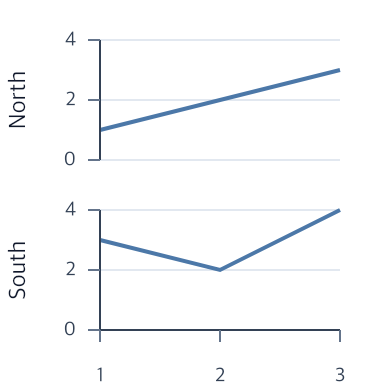
Choose automatic linear domain rounding without hard-coding a range for every panel.
createLinePlot
editYScale
editFacetScales
View full size
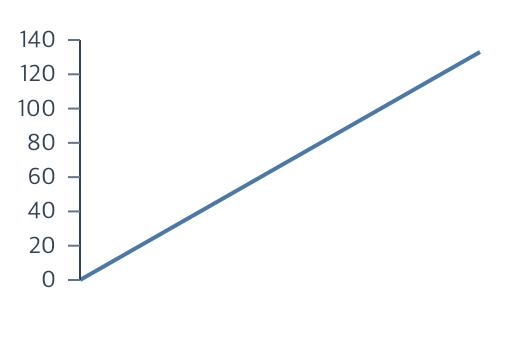
Use one automatic tick policy across independently scaled facet panels.
createLinePlot
createYAxis
editYAxisTicksAndLabels
View full size
293 actions · sha256:e755591a2e5f5e2b494867583876e28020a478c5220b77bdc6ad469a6224891d