Published-release documentation · release compatibility
Regression
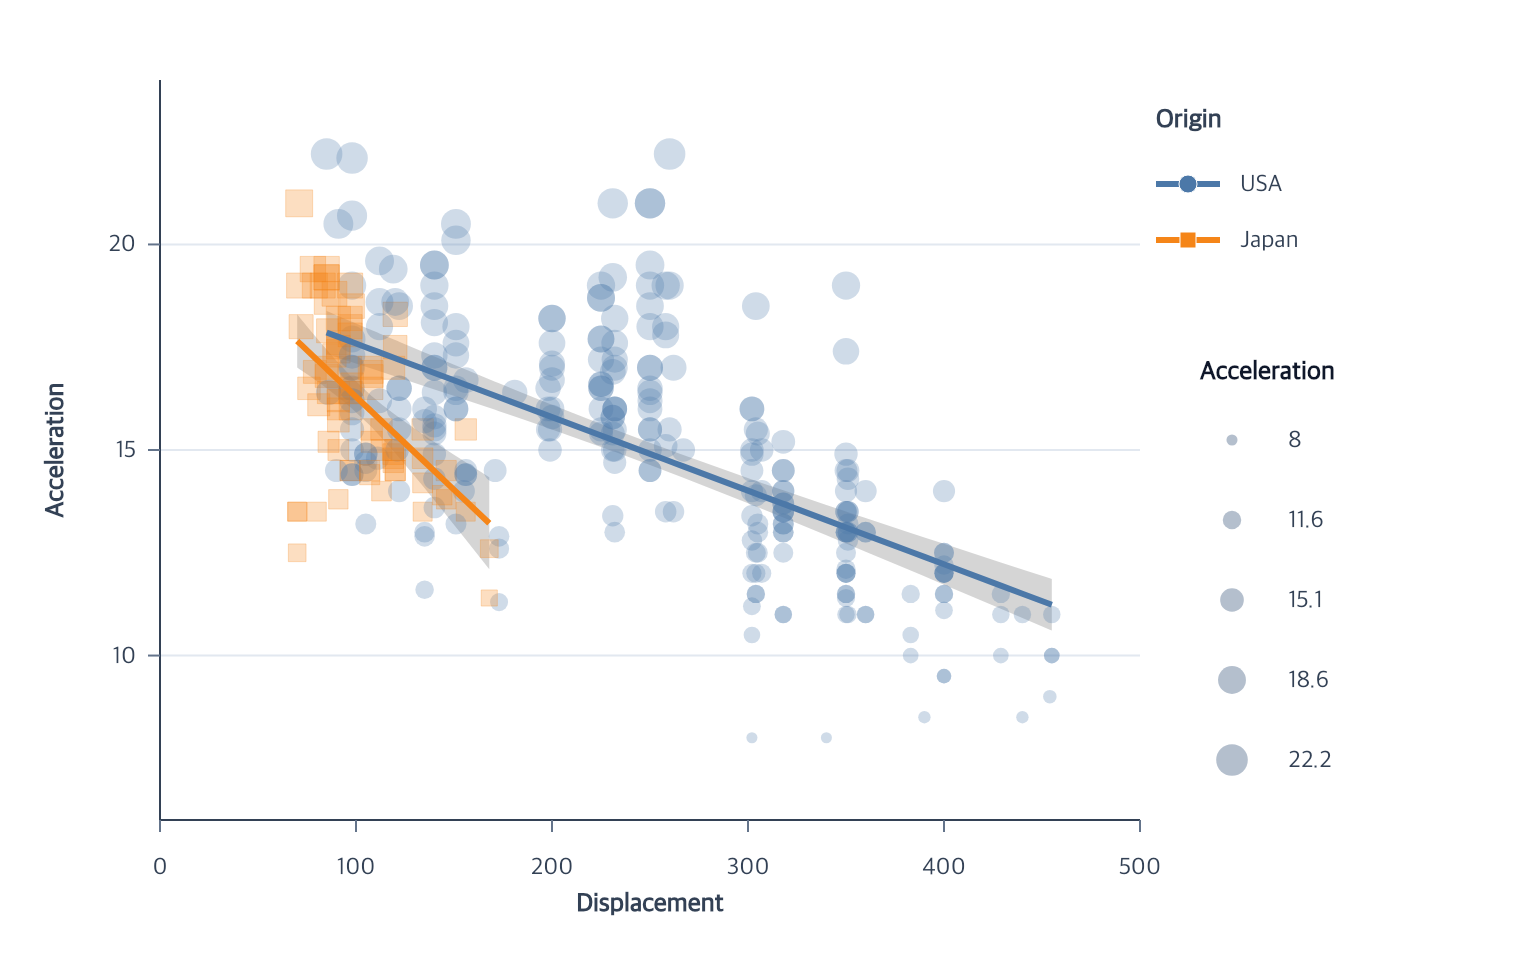
createRegression() layers grouped linear, polynomial, LOESS, or exponential fits over an
existing quantitative point mark. Linear and polynomial fits can include mean
or prediction interval bands; LOESS is line-only.
Use createRegression({ placement: "plot-last" }) to paint the band and then the
fit after existing plot marks. The default keeps the band before its source points
and the fit immediately after them. Both policies preserve grid underlays and axis
or frame overlays. editRegression({ placement: "source" }) restores source
attachment; omission retains the current policy through model/data edits and saved
programs. Later independently authored marks follow ordinary authoring order;
editing a plot-last regression reapplies its placement. createRegressionPlot
accepts the same option.
At a glance
| Action | Required decision | Inferred or default behavior |
|---|---|---|
createRegression(options?) |
Nothing when one eligible point layer exists | Target, x, y, grouping, linear method, 95% mean interval, band and line appearance |
editRegression(options) |
At least one model or component option | Current or unique owner; unchanged values and fitted data retained |
createRegression(options?)
Contextual fragment. Use an ES module with the imports, data, and prepared resource state described in this section. Caller-provided receivers:
points. Resolve these names from setup in this fragment or section; alternatives branch from the same base.
const program = points.createRegression();
The shortest call infers the target from the current or only eligible point
mark, x/y from its quantitative positions, and group from the unique nominal
field used by color and/or shape. Dataset, Cartesian coordinate, and x/y scales
come from that point layer. Inference fails rather than choosing among multiple
targets or group fields. Explicit groupBy: false requests one model and survives JSON serialization.
Legacy explicit groupBy: undefined keeps the same JavaScript behavior.
Contextual fragment. Use an ES module with the imports, data, and prepared resource state described in this section. Caller-provided receivers:
program. Resolve these names from setup in this fragment or section; alternatives branch from the same base.
program.createRegression({
  confidenceMethod: "student-t",
  level: 0.95,
  band: {
    color: "#111111",
    opacity: 0.18,
    stroke: "#334155",
    strokeWidth: 1
  },
  line: { strokeWidth: 3, curve: "linear" }
});
| Option | Type | Default |
|---|---|---|
placement |
"source" or "plot-last" |
"source" |
target |
eligible point mark ID | inferred |
x, y |
quantitative field names | target x/y fields |
groupBy |
nominal field name or false (legacy explicit undefined also supported) |
unique color/shape field |
method |
"linear", "polynomial", "loess", or "exp" |
"linear" |
degree |
integer from 1 through 32 for polynomial |
2 |
span |
number greater than 0 and at most 1 for LOESS |
0.75 |
robustIterations |
LOESS residual reweighting passes, integer 0..32 |
0 |
confidenceMethod |
"normal" or "student-t" |
"student-t" |
level |
number strictly between 0 and 1 |
0.95 |
confidence |
compatibility alias for level; must match it when both appear |
omitted |
interval |
"mean", "prediction", or false |
"mean" |
predict |
{ values } or { domain, steps } |
observed unique x values |
missing |
"error" or "drop" |
compatibility behavior when omitted |
sourceBinding |
"fixed" or "follow" |
"fixed" |
band |
appearance object or false |
default band; no band for LOESS |
band.color |
color string | "#111111" |
band.opacity |
number from 0 to 1 |
0.18 |
band.stroke |
non-empty color string | no outline |
band.strokeWidth |
non-negative finite number | 1 with stroke |
band.lineCap, band.lineJoin, band.miterLimit |
shared stroke-detail values | butt, miter, 10 |
line.strokeWidth |
non-negative finite number | 3 |
line.curve |
supported curve interpolation | "linear" |
line.lineCap, line.lineJoin, line.miterLimit |
shared stroke-detail values | butt, miter, 10 |
Choose another model or interval without coordinating its child layers:
Contextual fragment. Use an ES module with the imports, data, and prepared resource state described in this section. Caller-provided receivers:
points. Resolve these names from setup in this fragment or section; alternatives branch from the same base.
points.createRegression({ method: "polynomial", degree: 2 });
points.createRegression({ method: "loess", span: 0.55 });
points.createRegression({ method: "loess", span: 0.55, robustIterations: 2 });
points.createRegression({ method: "exp" });
points.createRegression({ interval: "prediction" });
points.createRegression({ interval: false, band: false });
Polynomial degree 1 retains polynomial provenance while producing the same
fit as linear regression. Prediction intervals include residual uncertainty
and are therefore at least as wide as matching mean intervals. LOESS does not
accept confidenceMethod, level, confidence, interval, or a band object; its omitted or false band
produces only the fitted line. Linear and polynomial bands can also be disabled
with band: false.
method: "exp" fits y = amplitude * exp(rate * x) using response weights
w = y on log(y). This differs from ordinary unweighted log regression.
Every eligible response must be strictly positive, and each group needs at
least two observations with varying x. Missing-value policy runs first;
zero and negative responses are errors. Omitted or false interval gives
point estimates with no band or interval columns. Confidence options, degree,
span, robust iterations, interval objects, and band objects are rejected.
Unrepresentable coefficients or nonpositive/nonfinite predictions fail
atomically. Existing explicit prediction positions remain available.
sourceBinding: "fixed" keeps the regression attached to the source snapshot
used at creation. "follow" refits when reviseData advances that logical
source. Appearance-only edits preserve fitted rows. Statistical, field, or
prediction-grid edits create one new immutable fitted dataset.
LOESS defaults to an ordinary local-linear fit. Set robustIterations: 2
for two residual reweighting passes. Each neighborhood contains
max(2, ceil(span * groupRowCount)) rows; equal distances use source order,
and duplicate x values share one prediction. If all neighbors lie at the
tricube boundary (all distance weights zero), equal weights resolve the tied
sample. Each pass multiplies the tricube distance
weights by bisquare residual weights with cutoff six times the median absolute
residual within the group. Residuals are normalized by the group’s largest
absolute response. If the cutoff is at most 64 * Number.EPSILON, only residuals
within that tolerance keep weight one. Unchanged weights stop iteration early.
A neighborhood with no remaining positive weight uses its ordinary local fit;
the span does not expand. Short spans can therefore retain isolated outliers.
Arbitrary prediction positions use the final residual weights. Confidence bands
remain unavailable. Omitted or zero iterations preserve the ordinary result and
its persisted transform; positive counts are stored in provenance.
Each regression produces at most 10,000 group/x rows. Polynomial and LOESS
inputs whose estimated fitting work exceeds 10,000,000 units throw a
RangeError before the expensive fit begins.
The action keeps each fitted dataset, band, and line associated with its target point mark, so multiple point layers can add independent regressions in one program. The exact generated IDs are internal and are not required in ordinary chart-authoring code.
Its trace records createRegressionData, optional createRegressionBand, and
createRegressionLine as meaningful children. The band child validates
regression provenance and delegates its interval geometry to a nested
createErrorBand call. See
Actions and trace trees when that
decomposition matters.
Editing a regression
Use the original point owner, not generated band or line IDs:
Contextual fragment. Use an ES module with the imports, data, and prepared resource state described in this section. Caller-provided receivers:
program. Resource selectors used here:target: "points". Resolve these names from setup in this fragment or section; alternatives branch from the same base.
const revised = program.editRegression({
  target: "points",
  method: "polynomial",
  degree: 2,
  band: { color: "#a78bfa", opacity: 0.16 },
  line: { strokeWidth: 4 }
});
Create-time data roles can be revised through the same stable owner:
Contextual fragment. Use an ES module with the imports, data, and prepared resource state described in this section. Caller-provided receivers:
program. Resource selectors used here:data: "observations". Resolve these names from setup in this fragment or section; alternatives branch from the same base.
const rebound = program.editRegression({
  data: "observations",
  x: "time",
  y: "value",
  groupBy: false
});
method, degree, span, robustIterations, confidenceMethod, level, confidence, interval,
predict, missing, and sourceBinding follow the same
method-specific rules as creation. A data-role or statistical change creates
one new immutable fitted-data revision, rebinds every owned regression
component, and releases the old revision when nothing references it.
groupBy: false removes line color/group and band grouping. Component IDs,
coordinate, and position scale IDs remain stable. A request containing only
band or line appearance retains the existing fitted rows.
Set band: false or switch to LOESS or exponential regression to remove the owned band. Switching back
to linear or polynomial regression recreates the band by default; a band
object can also restore it explicitly. Target omission uses the current or
only regression owner and fails on ambiguity.
Editing generated components
Contextual fragment. Use an ES module with the imports, data, and prepared resource state described in this section. Resolve these names from setup in this fragment or section; alternatives branch from the same base.
const emphasized = program
  .editRegressionBand({
    color: "#475569",
    opacity: 0.12,
    stroke: "#111827",
    strokeWidth: 1.5,
    curve: "cardinal"
  })
  .editRegressionLine({ strokeWidth: 5 });
Each action infers the only compatible generated component or accepts an
explicit target. Band edits delegate to editAreaMark; line edits delegate to
editLineMark. They preserve fitted data, result fields, grouping, coordinates,
and scales. stroke: false removes a band outline. Band curves use the same
eight-value interpolation vocabulary as area and line marks.
Errors and limitations
The action rejects ambiguous point targets, missing quantitative x/y encodings, incompatible coordinates or scales, ambiguous nominal grouping, invalid method-specific parameters, and groups that cannot support the chosen fit. LOESS confidence bands are not supported. Failed calls leave the earlier immutable program unchanged.
Related
Regression scatterplot tutorial · Data · Marks · Encodings · Guides
Documentation provenance
293 actions · sha256:e755591a2e5f5e2b494867583876e28020a478c5220b77bdc6ad469a6224891d