Published-release documentation · 281 actions; release compatibility · contract 5520b0fa9525
Choose a Chart
Start with the chart that expresses the data’s meaning, then edit its parts through lower-level actions. Every complete-chart action in the current declared catalog appears below, including composition and deferred-construction entries.
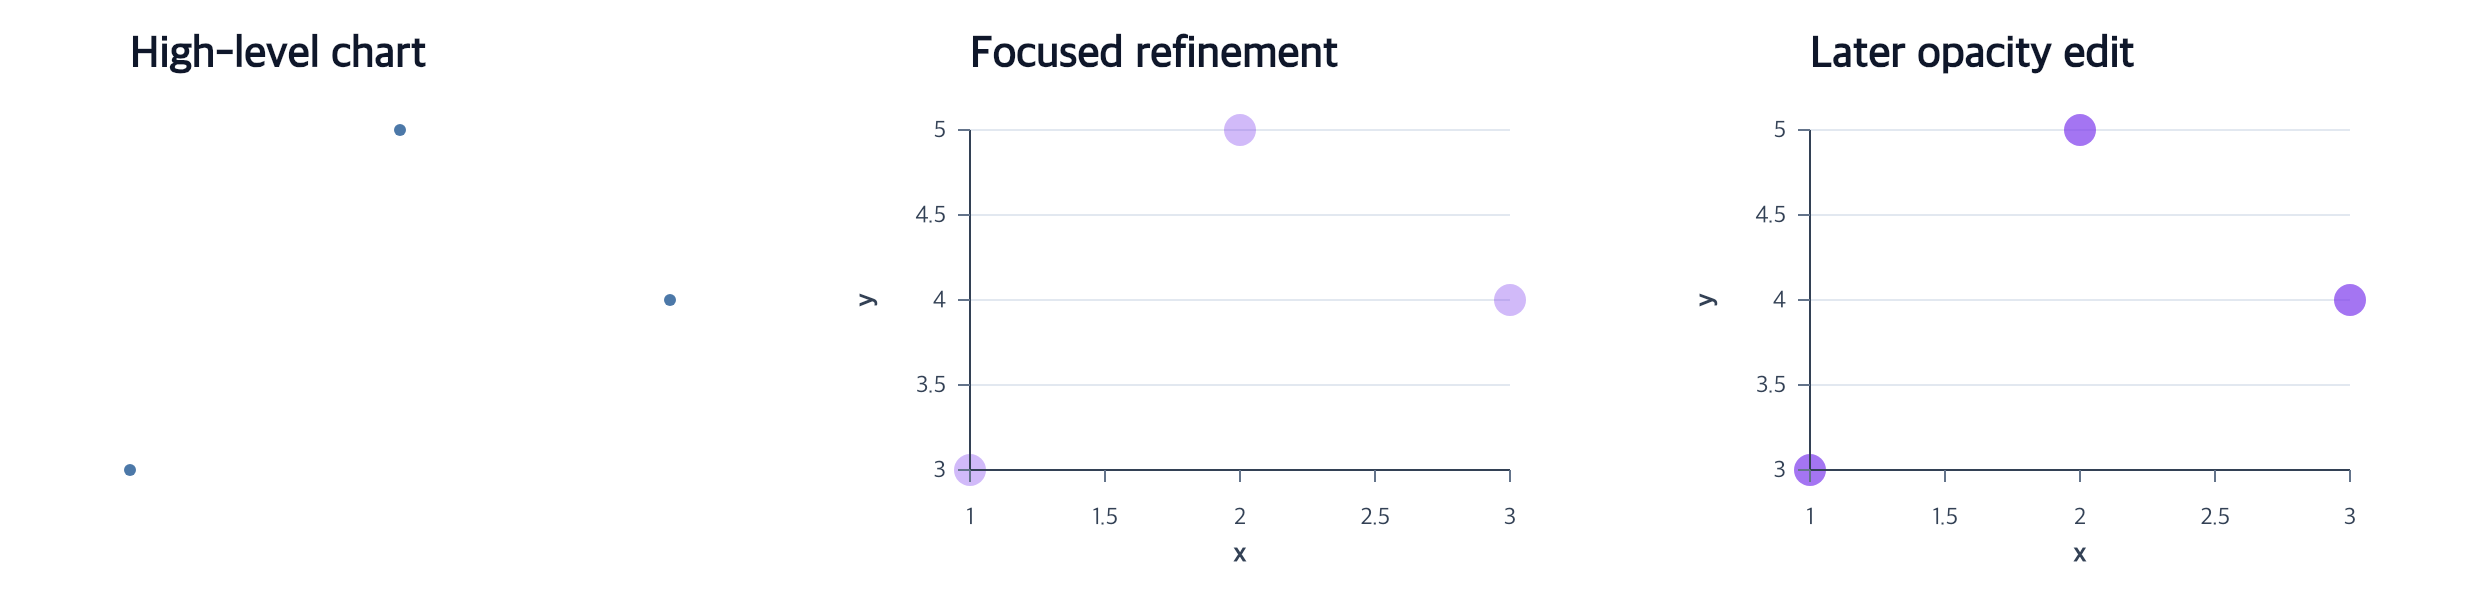
Three independent choices
H0–H4 catalog role tags group related authoring tasks; the actual hierarchy comes from the smaller actions an action composes. API layer describes user-facing, advanced, or primitive exposure. Package entry describes availability from the full or basic import. A higher-level action is not automatically part of the smaller package, and a low-level domain action is not automatically an extension primitive.
Prepare a Canvas and explicit or unambiguous materialized data before a unit chart facade. Repetition consumes a complete program. Box and Gradient constructors can defer roles, so merely calling them does not necessarily produce a complete chart.
Relationships and trends
| Task / input | Chart action | Role tags · API layer · entry | Direct editor | Lower-level actions |
|---|---|---|---|---|
| One row per observation; x and y fields | createScatterPlot |
H0 · user-facing · default, basic | Refine the owned marks, encodings, or guides | createPointMark · encodeX · encodeY · encodeColor · encodeShape · createGuides |
| Ordered positions and measures; explicit aggregation when needed | createLinePlot |
H0 · user-facing · default, basic | Refine the owned marks, encodings, or guides | createLineMark · encodeX · encodeY · encodeGroup · encodeColor · encodeStrokeDash · createGuides |
| Ordered values and a baseline, or paired interval bounds | createAreaPlot |
H0 · user-facing · default | Refine the owned marks, encodings, or guides | createAreaMark · encodeGroup · encodeX · encodeYRange · layoutSeries · encodeColor · createGuides |
| Finite quantitative observations for a fit and optional uncertainty | createRegressionPlot |
H0, H1 · user-facing · default | Refine the owned marks, encodings, or guides | createScatterPlot · createRegression |
| Angular and radial fields per observation | createPolarScatterPlot |
H0 · user-facing · default | Refine the owned marks, encodings, or guides | createPointMark · encodeTheta · encodeR · encodePointRadius |
| Ordered angular/radial observations per path | createPolarLinePlot |
H0 · user-facing · default | Refine the owned marks, encodings, or guides | createLineMark · encodeTheta · encodeR |
| Long category/value rows or explicitly selected wide fields | createRadarPlot |
H0 · user-facing · default | Refine the owned marks, encodings, or guides | createPolarLinePlot |
| Rows with two or more quantitative or ordinal dimensions | createParallelCoordinates |
H0 · user-facing · default | Refine the owned marks, encodings, or guides | createCoordinate · createLineMark · encodeParallelCoordinates · encodeColor · encodeStrokeDash · createGuides |
Comparisons and intervals
| Task / input | Chart action | Role tags · API layer · entry | Direct editor | Lower-level actions |
|---|---|---|---|---|
| Categorical/measure roles, explicit summary, or ranged endpoints | createBarPlot |
H0 · user-facing · default, basic | Refine the owned marks, encodings, or guides | createBarMark · encodeY · encodeX · encodeColor · encodeBarWidth · createGuides |
| Category and measure per raw row, or an explicit summary | createDotPlot |
H0, H1 · user-facing · default | editEndpointPlot |
createSummaryData · createPointMark · encodeX · encodeY |
| Category, measure, and a finite baseline | createLollipopPlot |
H0, H1 · user-facing · default | editEndpointPlot |
createSummaryData · createRuleMark · encodeX · encodeY · encodeX2 · createPointMark |
| Category plus named start and end measurements | createDumbbellPlot |
H0, H1 · user-facing · default | editEndpointPlot |
createSummaryData · createRuleMark · encodeX · encodeY · encodeX2 · createPointMark |
| Center and interval measurements or a statistical interval definition | createIntervalPlot |
H0, H1 · user-facing · default | Refine the owned marks, encodings, or guides | createErrorBar · createPointMark · encodeX · encodeY |
Distributions
| Task / input | Chart action | Role tags · API layer · entry | Direct editor | Lower-level actions |
|---|---|---|---|---|
| Quantitative observations; one bin policy; optional weights | createHistogram |
H0, H1 · user-facing · default, basic | Refine the owned marks, encodings, or guides | createBarMark · encodeHistogram · encodeColor · createGuides |
| Finite numeric observations and KDE decisions | createDensityPlot |
H0, H1 · user-facing · default | editDensity · editAreaMark |
createAreaMark · encodeDensity · createGuides · encodeColor |
| Numeric support observations; optional group and weight field | createECDFPlot |
H0, H1 · user-facing · default | editECDFPlot |
createECDFData · createLineMark · encodeX · encodeY · encodeGroup |
| One categorical and one quantitative role; constructor may defer roles | createBoxPlot |
H0, H1 · user-facing · default | editBoxPlot |
createBarMark · encodeX · encodeY |
| Category and quantitative profile roles; constructor may defer roles | createGradientPlot |
H0, H1 · user-facing · default | editGradientPlot |
createRectMark · encodeX · encodeY |
| Category and quantitative measure; optional two-value split | createViolinPlot |
H0, H1 · user-facing · default | editViolinPlot |
createAreaMark · encodeDensity · encodeColor · createGuides |
| One quantitative or temporal measure | createRugPlot |
H0 · user-facing · default | Refine the owned marks, encodings, or guides | createTickMark · encodeX · encodeY · encodeAngle |
| One measure, optionally with a categorical slot | createStripPlot |
H0 · user-facing · default | Refine the owned marks, encodings, or guides | createPointMark · encodeX · encodeY · encodePointRadius |
| Category and measure for glyph-aware deterministic packing | createBeeswarmPlot |
H0 · user-facing · default | Refine the owned marks, encodings, or guides | createStripPlot · packPoints |
| Shared category/measure rows for density, summary, and observations | createRaincloudPlot |
H0, H1 · user-facing · default | editRaincloudPlot |
createViolinPlot · createBoxPlot · createBeeswarmPlot |
Parts, radial values, and dense samples
| Task / input | Chart action | Role tags · API layer · entry | Direct editor | Lower-level actions |
|---|---|---|---|---|
| Category counts or category sums for proportional sector angles | createPiePlot |
H0 · user-facing · default | Refine the owned marks, encodings, or guides | createArcMark · encodeTheta · encodeColor · createGuides |
| Category counts or sums represented by sector area | createRosePlot |
H0 · user-facing · default | Refine the owned marks, encodings, or guides | createArcMark · encodeTheta · encodeR · encodeColor · createGuides |
| Category counts or sums represented by radial length | createRadialBarPlot |
H0 · user-facing · default | Refine the owned marks, encodings, or guides | createArcMark · encodeTheta · encodeR · encodeColor · createGuides |
| Pre-gridded cells or two raw quantitative fields for rectangular bins | createHeatmap |
H0 · user-facing · default, basic | Refine the owned marks, encodings, or guides | createRectMark · encodeX · encodeY · encodeColor · createGuides · createBin2DData · encodeX2 · encodeY2 |
| Ordered quantitative/temporal x and foldable quantitative y | createHorizonPlot |
H0, H1 · user-facing · default | editHorizon · editAreaMark |
createAreaMark · encodeHorizon · createGuides |
Repeated chart structure
| Task / input | Chart action | Role tags · API layer · entry | Direct editor | Lower-level actions |
|---|---|---|---|---|
| One complete chart and an eligible shared ancestor field | facet |
H0 · user-facing · default | editFacetSource · editFacetHeaders · editFacetScales · editFacetGuides · editCompositionLayout |
|
| One complete chart plus row and column fields | facetGrid |
H0 · user-facing · default | editFacetSource · editFacetHeaders · editFacetScales · editFacetGuides · editCompositionLayout |
|
| One eligible mark role and an ordered field list | repeatCharts |
H0 · user-facing · default | editFacetSource · editFacetHeaders · editFacetScales · editFacetGuides · editCompositionLayout |
Compose or refine
hconcat and vconcat are exported functions for arranging independent complete
programs; they are not methods in the direct action catalog. Facet and repeat methods
retain a source recipe. Use the composition overview to choose.
The five basic Cartesian facades are a compact starting subset. For intervals added to existing layers, use Error Bar or Error Band, which add interval layers to a chart. See hierarchical authoring for one chart authored and edited at several levels.
The table’s H0–H4 values are catalog role tags, separate from the relative action hierarchy and from package exposure.