Published-release documentation · release compatibility
Annotation Recipe
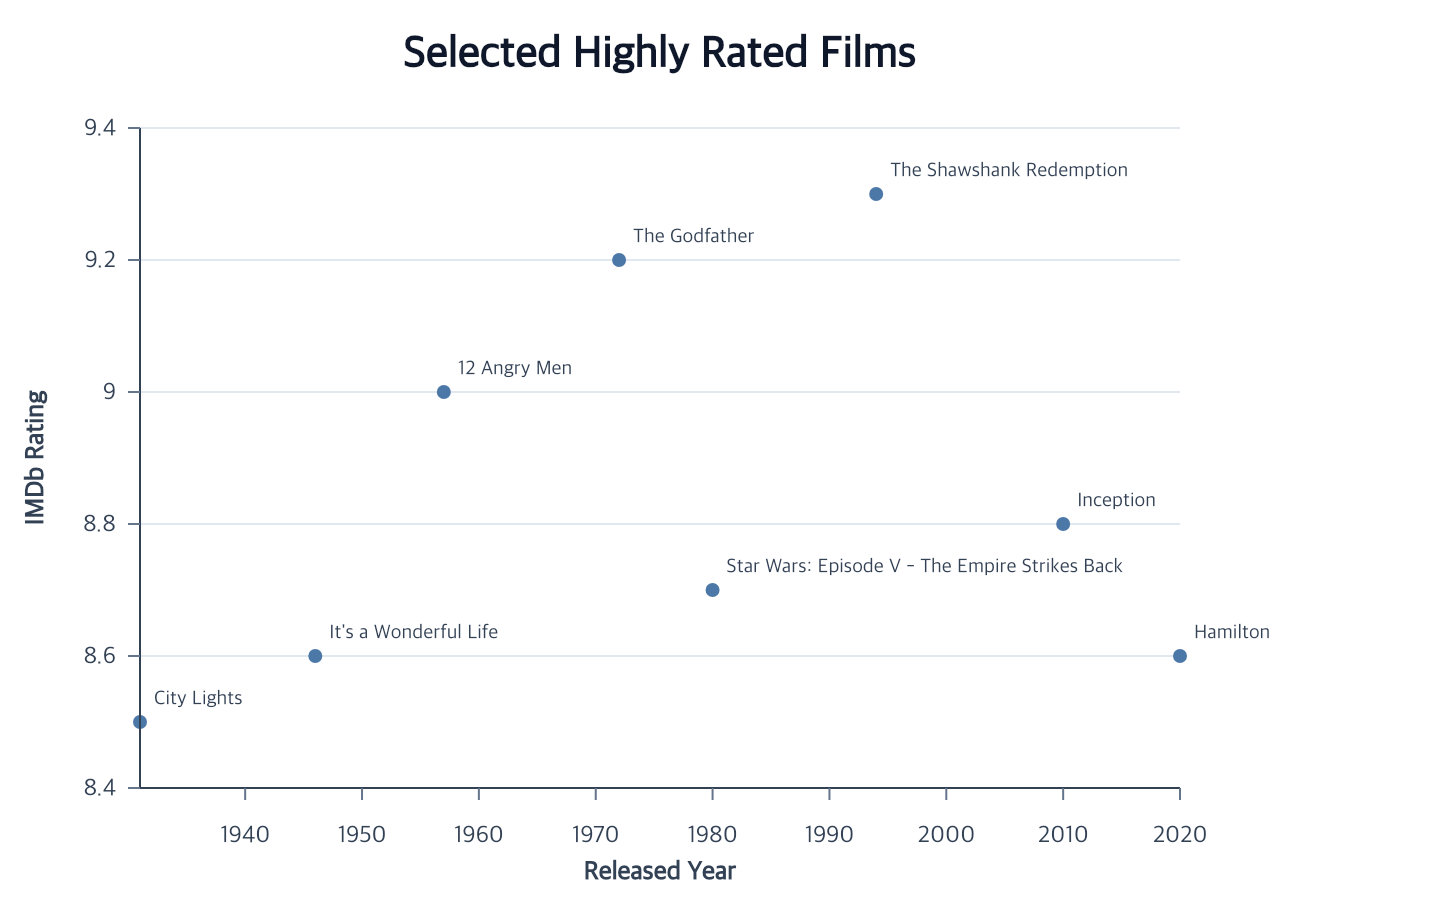
Minimal flow
Runnable: install ggaction and provide the named data array as plain row objects.
import { chart } from "ggaction";

const program = chart()
  .createCanvas()
  .createData({ values: films })
  .createScatterPlot({ x: "Released_Year", y: "IMDB_Rating" })
  .createTextMark({ dx: 7, dy: -6, align: "left", baseline: "bottom" })
  .encodeText({ field: "Series_Title" })
  .layoutLabels({
    padding: 3,
    maxDisplacement: 48,
    leader: { stroke: "#94a3b8", opacity: 0.8 }
  });
films is an array of plain row objects containing the two position fields and
the label field. The text layer reuses the preceding point layer’s data and
resolved Cartesian anchors.
You must decide
- The field or constant text to display
- Label offset, alignment, and typography
- Whether labels should keep explicit offsets or use bounded collision-aware layout
The library infers
- The current compatible source layer and dataset
- One text item per final point, bar, rect, or rule item
- Updated anchors after Canvas or scale revisions
- Stable collision-aware positions when
layoutLabels()is present
layoutLabels() reduces label-to-label overlap within the requested plot or
Canvas bounds. It is bounded best effort: dense impossible layouts store a
warning summary instead of expanding margins or changing typography. Filter
rows when every label still cannot fit.
Continue
For host-measured text widths, see Measured text layout.
Documentation provenance
293 actions · sha256:e755591a2e5f5e2b494867583876e28020a478c5220b77bdc6ad469a6224891d